Supply Chain Reorganization
•Download as PPTX, PDF•
0 likes•184 views

Result of the operational area reorganization at a footwear business

Recommended
Recommended
More Related Content
What's hot
What's hot (20)
Similar to Supply Chain Reorganization
Similar to Supply Chain Reorganization (20)
Recently uploaded
Recently uploaded (20)
Supply Chain Reorganization
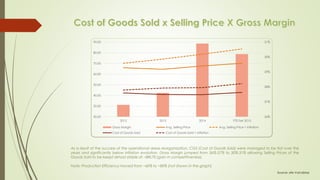
- 1. 26% 27% 28% 29% 30% 31% 20.00 30.00 40.00 50.00 60.00 70.00 80.00 90.00 2012 2013 2014 YTD Set 2015 Gross Margin Avg. Selling Price Avg. Selling Price + Inflation Cost of Goods Sold Cost of Goods Sold + Inflation As a result of the success of the operational areas reorganization, CGS (Cost of Goods Sold) were managed to be flat over the years and significantly below inflation evolution. Gross Margin jumped from 26%-27% to 30%-31% allowing Selling Prices of the Goods Sold to be keept almost stable at ~BRL70 (gain in competitiveness). Note: Production Efficiency moved from ~60% to ~80% (not shown in the graph) Source: site Vulcabras
- 2. Figures expressed as % of the Total Company Turnover -6.00% -4.00% -2.00% 0.00% 2.00% 4.00% 6.00% 8.00% 10.00% 12.00% 14.00% 2012 2013 2014 YTD Jun 2015 EBITDA % Operational Result % Source: site Vulcabras