SlideShare a Scribd company logo
1 of 2
Download to read offline
eBay –

Allocation of Revenue by Segment
Q1-2008 to Q1-2013

100%
90%
80%
70%
60%
50%
40%
30%
20%
10%
0%
Q2-08

Q2-09

Marketplace Revenue

Q2-10
Payment Revenue

Q2-11
Enterprise Revenue

Q2-12

Q2-13

Communications Revenue (Skype)
Need more metrics, statistics and
performance indicators on digital
leaders?
Visit: www.digital-quarterly.com

More Related Content

What's hot

What's hot (17)

Google Revenue Growth versus Operating Income Growth 2009 to 2013
Google Revenue Growth versus Operating Income Growth 2009 to 2013Google Revenue Growth versus Operating Income Growth 2009 to 2013
Google Revenue Growth versus Operating Income Growth 2009 to 2013
 
Digital Quarterly: Google Comparison Cost-per-click vs. Paid clicks
Digital Quarterly: Google Comparison Cost-per-click vs. Paid clicksDigital Quarterly: Google Comparison Cost-per-click vs. Paid clicks
Digital Quarterly: Google Comparison Cost-per-click vs. Paid clicks
 
PayPal Payments per Active Account 2008 to 2013 plus growth rate
PayPal Payments per Active Account 2008 to 2013 plus growth ratePayPal Payments per Active Account 2008 to 2013 plus growth rate
PayPal Payments per Active Account 2008 to 2013 plus growth rate
 
Amazon Invested Capital Plus Annual Growth 2009 to 2013
Amazon Invested Capital Plus Annual Growth 2009 to 2013Amazon Invested Capital Plus Annual Growth 2009 to 2013
Amazon Invested Capital Plus Annual Growth 2009 to 2013
 
Linkedin Corporate Customers Plus Growth Rate 2010 to 2013
Linkedin Corporate Customers Plus Growth Rate 2010 to 2013Linkedin Corporate Customers Plus Growth Rate 2010 to 2013
Linkedin Corporate Customers Plus Growth Rate 2010 to 2013
 
Amazon Operational Income 2006 to 2013
Amazon Operational Income 2006 to 2013Amazon Operational Income 2006 to 2013
Amazon Operational Income 2006 to 2013
 
PayPal Payment Volume per Account 2008 to 2013 per quarter
PayPal Payment Volume per Account 2008 to 2013 per quarterPayPal Payment Volume per Account 2008 to 2013 per quarter
PayPal Payment Volume per Account 2008 to 2013 per quarter
 
Reliance Industries Growth for the Year 2017-2018 y-o-y analysis
Reliance Industries Growth for the  Year 2017-2018  y-o-y analysisReliance Industries Growth for the  Year 2017-2018  y-o-y analysis
Reliance Industries Growth for the Year 2017-2018 y-o-y analysis
 
Coney Auditing 3.0 - An Introduction
Coney Auditing 3.0 - An IntroductionConey Auditing 3.0 - An Introduction
Coney Auditing 3.0 - An Introduction
 
Digital Quarterly: Facebook - Revenue distribution by region - Q3-2013
Digital Quarterly: Facebook - Revenue distribution by region - Q3-2013Digital Quarterly: Facebook - Revenue distribution by region - Q3-2013
Digital Quarterly: Facebook - Revenue distribution by region - Q3-2013
 
Digital Quarterly: Google revenues - owned websites vs. google network yy - 2...
Digital Quarterly: Google revenues - owned websites vs. google network yy - 2...Digital Quarterly: Google revenues - owned websites vs. google network yy - 2...
Digital Quarterly: Google revenues - owned websites vs. google network yy - 2...
 
Supply Chain Reorganization
Supply Chain ReorganizationSupply Chain Reorganization
Supply Chain Reorganization
 
Baxter Denney - Altamont Group Sales and Marketing Alignment Presentation
Baxter Denney - Altamont Group Sales and Marketing Alignment PresentationBaxter Denney - Altamont Group Sales and Marketing Alignment Presentation
Baxter Denney - Altamont Group Sales and Marketing Alignment Presentation
 
Greater Toronto Area High Rise Market Outlook 2016 NBLC
Greater Toronto Area High Rise Market Outlook 2016 NBLCGreater Toronto Area High Rise Market Outlook 2016 NBLC
Greater Toronto Area High Rise Market Outlook 2016 NBLC
 
Toronto Area High-Rise Market Outlook
Toronto Area High-Rise Market Outlook Toronto Area High-Rise Market Outlook
Toronto Area High-Rise Market Outlook
 
Statistik lk bptp sumsel 2015 2019
Statistik lk bptp sumsel 2015 2019Statistik lk bptp sumsel 2015 2019
Statistik lk bptp sumsel 2015 2019
 
海外SaaS企業プレスリリースで見る最新業界動向(Slack, shopify, Zoom, okta, Datadog, Zendesk)
海外SaaS企業プレスリリースで見る最新業界動向(Slack, shopify, Zoom, okta, Datadog, Zendesk)海外SaaS企業プレスリリースで見る最新業界動向(Slack, shopify, Zoom, okta, Datadog, Zendesk)
海外SaaS企業プレスリリースで見る最新業界動向(Slack, shopify, Zoom, okta, Datadog, Zendesk)
 

Viewers also liked

Retail sales reporting & analysis
Retail sales reporting & analysisRetail sales reporting & analysis
Retail sales reporting & analysis
Retail EDI
 
Sales reports every sales manager should be reviewing
Sales reports every sales manager should be reviewingSales reports every sales manager should be reviewing
Sales reports every sales manager should be reviewing
MyLMS Inc.
 

Viewers also liked (8)

Friday
FridayFriday
Friday
 
Company presentation by_2015_16_en_16-9_final
Company presentation by_2015_16_en_16-9_finalCompany presentation by_2015_16_en_16-9_final
Company presentation by_2015_16_en_16-9_final
 
Bank branch audit
Bank branch auditBank branch audit
Bank branch audit
 
Finance PowerPoint Presentation
Finance PowerPoint PresentationFinance PowerPoint Presentation
Finance PowerPoint Presentation
 
Retail sales reporting & analysis
Retail sales reporting & analysisRetail sales reporting & analysis
Retail sales reporting & analysis
 
Sales reports every sales manager should be reviewing
Sales reports every sales manager should be reviewingSales reports every sales manager should be reviewing
Sales reports every sales manager should be reviewing
 
Sales report analysis and recommendation
Sales report analysis and recommendationSales report analysis and recommendation
Sales report analysis and recommendation
 
Creative Traction Methodology - For Early Stage Startups
Creative Traction Methodology - For Early Stage StartupsCreative Traction Methodology - For Early Stage Startups
Creative Traction Methodology - For Early Stage Startups
 

More from Self Employed

More from Self Employed (20)

Alibaba Marketplaces Ecosystem
Alibaba Marketplaces EcosystemAlibaba Marketplaces Ecosystem
Alibaba Marketplaces Ecosystem
 
Alibaba Group - Strategic Analysis - Overview
Alibaba Group - Strategic Analysis - OverviewAlibaba Group - Strategic Analysis - Overview
Alibaba Group - Strategic Analysis - Overview
 
LinkedIn Revenue Per Corporate Customer 2010 to 2013
LinkedIn Revenue Per Corporate Customer 2010 to 2013LinkedIn Revenue Per Corporate Customer 2010 to 2013
LinkedIn Revenue Per Corporate Customer 2010 to 2013
 
Apple Average Revenue By Device Sold 2007 to 2013
Apple Average Revenue By Device Sold 2007 to 2013Apple Average Revenue By Device Sold 2007 to 2013
Apple Average Revenue By Device Sold 2007 to 2013
 
Apple Distribution Of Devices Sold 2007 to 2013
Apple Distribution Of Devices Sold 2007 to 2013Apple Distribution Of Devices Sold 2007 to 2013
Apple Distribution Of Devices Sold 2007 to 2013
 
Amazon Kindle Direct Publishing Revenue Per Borrow 2011 to Q32013
Amazon Kindle Direct Publishing Revenue Per Borrow 2011 to Q32013Amazon Kindle Direct Publishing Revenue Per Borrow 2011 to Q32013
Amazon Kindle Direct Publishing Revenue Per Borrow 2011 to Q32013
 
Apple Annual Revenue By Product 2007 to 2013
Apple Annual Revenue By Product 2007 to 2013Apple Annual Revenue By Product 2007 to 2013
Apple Annual Revenue By Product 2007 to 2013
 
Facebook Monthly Active User Growth By Region 2011 to 2013 QQ
Facebook Monthly Active User Growth By Region 2011 to 2013 QQFacebook Monthly Active User Growth By Region 2011 to 2013 QQ
Facebook Monthly Active User Growth By Region 2011 to 2013 QQ
 
Amazon Invested Capital As Percent Of Revenue 2009 to 2013 QQ
Amazon Invested Capital As Percent Of Revenue 2009 to 2013 QQAmazon Invested Capital As Percent Of Revenue 2009 to 2013 QQ
Amazon Invested Capital As Percent Of Revenue 2009 to 2013 QQ
 
Apple Cumulative Unit Sales Per Quarter 2007 to 2013
Apple Cumulative Unit Sales Per Quarter 2007 to 2013Apple Cumulative Unit Sales Per Quarter 2007 to 2013
Apple Cumulative Unit Sales Per Quarter 2007 to 2013
 
Linkedin Advertising Revenue Per Unique Visitor 2010 to 2013
Linkedin Advertising Revenue Per Unique Visitor 2010 to 2013Linkedin Advertising Revenue Per Unique Visitor 2010 to 2013
Linkedin Advertising Revenue Per Unique Visitor 2010 to 2013
 
Amazon Invested Capital Sequential Growth 2009 to 2013
Amazon Invested Capital Sequential Growth 2009 to 2013Amazon Invested Capital Sequential Growth 2009 to 2013
Amazon Invested Capital Sequential Growth 2009 to 2013
 
Linkedin Revenue per Corporate Customer 2010 to 2013
Linkedin Revenue per Corporate Customer 2010 to 2013Linkedin Revenue per Corporate Customer 2010 to 2013
Linkedin Revenue per Corporate Customer 2010 to 2013
 
Google Chrome Active Users 2009 to 2013
Google Chrome Active Users 2009 to 2013Google Chrome Active Users 2009 to 2013
Google Chrome Active Users 2009 to 2013
 
Apple iPad Sales by Primary Model 2010 to 2013
Apple iPad Sales by Primary Model 2010 to 2013Apple iPad Sales by Primary Model 2010 to 2013
Apple iPad Sales by Primary Model 2010 to 2013
 
Apple Revenue Distribution by Product 2007 to 2013
Apple Revenue Distribution by Product 2007 to 2013Apple Revenue Distribution by Product 2007 to 2013
Apple Revenue Distribution by Product 2007 to 2013
 
Facebook MAU versus DAU Ratio 2011 to 2013
Facebook MAU versus DAU Ratio 2011 to 2013Facebook MAU versus DAU Ratio 2011 to 2013
Facebook MAU versus DAU Ratio 2011 to 2013
 
Facebook Monthly Mobile Active Users 2011 to 2013
Facebook Monthly Mobile Active Users 2011 to 2013Facebook Monthly Mobile Active Users 2011 to 2013
Facebook Monthly Mobile Active Users 2011 to 2013
 
PayPal Revenue Per Active Account 2008 to 2013 (Per Quarter)
PayPal Revenue Per Active Account 2008 to 2013 (Per Quarter)PayPal Revenue Per Active Account 2008 to 2013 (Per Quarter)
PayPal Revenue Per Active Account 2008 to 2013 (Per Quarter)
 
Apple App Store Available Apps 2008 to 2013
Apple App Store Available Apps 2008 to 2013Apple App Store Available Apps 2008 to 2013
Apple App Store Available Apps 2008 to 2013
 

Digital Quarterly: eBay Share of revenue by business segment - Q3-2013

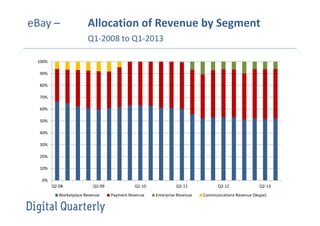
  • 1. eBay – Allocation of Revenue by Segment Q1-2008 to Q1-2013 100% 90% 80% 70% 60% 50% 40% 30% 20% 10% 0% Q2-08 Q2-09 Marketplace Revenue Q2-10 Payment Revenue Q2-11 Enterprise Revenue Q2-12 Q2-13 Communications Revenue (Skype)
  • 2. Need more metrics, statistics and performance indicators on digital leaders? Visit: www.digital-quarterly.com