3D Inversion & Negative Inversional Fault Systems, Taranaki Basin, Offshore NZ
•Download as PPTX, PDF•
3 likes•1,665 views

This is my final MSc Petroleum Geoscience Presentation to academics and professionals at the Royal Holloway University annual MSc Petroleum Geoscience Symposium.

Recommended
Recommended
More Related Content
What's hot
What's hot (20)
Viewers also liked
Similar to 3D Inversion & Negative Inversional Fault Systems, Taranaki Basin, Offshore NZ
Similar to 3D Inversion & Negative Inversional Fault Systems, Taranaki Basin, Offshore NZ (20)
Recently uploaded
Recently uploaded (20)
3D Inversion & Negative Inversional Fault Systems, Taranaki Basin, Offshore NZ
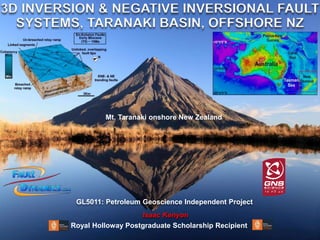
- 1. 3D INVERSION & NEGATIVE INVERSIONAL FAULT SYSTEMS, TARANAKI BASIN, OFFSHORE NZ Isaac Kenyon Mt. Taranaki onshore New Zealand GL5011: Petroleum Geoscience Independent Project Royal Holloway Postgraduate Scholarship Recipient
- 2. Research Location Source: Modified from (King et.al., 2010) Study Regions
- 3. Dataset Source: Modified from (King et.al., 2010) & (Energy-pedia.com, 2016) Shell drilled the Maari well Maui Field (3.4 TCF) largest field in the Taranaki Basin
- 4. Aims Of Research 1. Model the tectonostratigraphic evolution of the Taranaki Basin. 2. Identify precise locations inversion initiation on individual faults during the Eocene-Miocene compression. 3. Analyse tip line propogation of young Plio-Pleistocene extensional faults and their kinematic interaction between separate fault segments. 4. Discussion of negatively inverted rift faults and reactivated normal faults during the Pliocene and their implications on hydrocarbon migration.
- 5. (Mid-Late Cretaceous (100-66MA) Intra-Continental Rifting Rifting associated with Gondwana break up and spreading of the Tasman Sea. Dominated by non- marine deposition close to NZ and deep water in the Taranaki Basin. Source: Modified diagram from (King et al., 2010)
- 6. (Paleocene to Eocene (40Ma) Passive Margin End of the Tasman Sea spreading (52Ma) during the Early to Middle Eocene developing tectonic quiescence and widespread marine transgression. Middle Eocene to Oligocene, sees sea- floor spreading in the Emerald Basin Source: Modified diagram from (King et al., 2010)
- 7. Mid Oligocene (27Ma) Convergent Margin Mid Eocene sees sea-floor spreading in the Emerald Basin develop. Pacific Plate subduction under north-eastern New Zealand (27Ma). Source: Modified diagram from (King et al., 2010)
- 8. Miocene To Present (10-0Ma) Back-arc Extension & Trench Roll-back Alpine Fault evolved, forming a link between west-dipping Hikurangi subduction, Emerald Basin spreading and oblique extension in the southwest. Relative motion across this plate boundary is increasingly convergent throughout the Neogene. Source: Modified diagrams from (King et al., 2010)
- 9. CHRONO- STRATIGRAPHIC CHART Source: modified from (King and Thrasher, 1996) (King et.al., 2010)
- 11. Amplitude attribute Regional 2-D Line
- 12. Fault & Fold Map Analysis Horsts, grabens & growth strata appear. Post rift faults reactivated. Early rifting faults negatively Inverted. New extensional faults develop. Strike trend changing. Large rift border faults. Synthetic smaller extensional faults. Large depression develops between these. General trend in NNE strike. Faults begin to link up. into larger master faults. Extensional faults develop. oblique to major rift faults. Major rift faults show inversion signature here (Harpoon shape). New extensional faults develop again oblique to major rift faults (crestal collapse structures accommodating inversion perhaps). Two clearly different strike trends. Recent extensional faults reactivated. Other rift faults negatively inverted. Faults only active in the North of study area. NE strike trend.
- 15. Pre-Rift (Basement) CAP~115Ma Regional Extensional Direction perpendicular to antithetic faults Sand bodies in asymmetrical half graben depocentres Economic Deep Reservoirs Curved fault wing tips, potential link up 0 2 4 6 3 7 8 8 10 11 11 16 Throw(Km) Fault Length (Km) Pre-Extension Fault Length (Km) Vs Throw (km)
- 16. Recent extension faults penetrating in the NE. Rift faults link and increase in strike length. Regional Extensional Direction perpendicular to antithetic faults Syn-Extension 1 (CAL~110Ma) Extraction shows the 3D arch of faults 0 1000 2000 3000 4000 5000 6000 2 3 3.5 3.8 5 5.8 6 7.2 9 9.5 14 25 Throw(m) Fault Length (Km) Syn-Extension 1 Fault Length (Km) Vs Throw (m)
- 17. Post Rift CS~85Ma Trends: Basement involvement seismically active Regional Extensional Direction perpendicular to antithetic faults NE-SW (accommodation faulting) NNW-SSE (tend to be Inverted) NNE-SSW Maui- 4 well target 0 1000 2000 3000 4000 5000 6000 1.8 2 2.52.52.83.13.53.8 4 4 4.34.44.5 5 6 7 8 9 10 10 19 Throw(m) Fault Length (Km) Post-Extension 1 Fault Length (Km) Vs Throw (m)
- 18. Post-Inversion (TO)~23Ma 0 1000 2000 3000 4000 5000 85 65 50 CumulativeThrow(m) Age (Ma) Late Cretaceous to Palaeocene Fault Growth Curve Large inverted (Kiwi Rift Fault) Smaller Fault Younger Structure Regional Compressional Direction perpendicular to antithetic faults Relay ramps Linked en-echelon faults Segmented inversion of rift faults Overlapping fault tips B B’
- 19. (B) (B’) Hydrocarbon Trap Leakage Post-Inversion Hydrocarbon Implications Gas leakage through chimneys, utilizing reactivated faults. NS
- 20. -100 100 300 500 700 900 1100 22 7 0 CumulativeThrow(m) Age (Ma) Miocene to Plio-Pleistocene Fault Growth Curve Large Extensional NE Fault Smaller Extensional Faults not contributing much to recent extension Post-Recent extension (CC)~7Ma Lack of faults in the south Negatively Inverted faults Regional Compressional Direction perpendicular to antithetic faults Extension is NNW-SSE trending. D D’
- 21. Negative Inversion in the Plio-Pleistocene Located in the North of the 3D dataset, lack of reactivation in the South. Growth stratal sequences fairly recent in the Plio- Pleistocene. Basement rift faults are fairly challenging to understand so reason for activation isn’t truly understood.
- 22. Tectono-Stratigraphic Evolution Pre-Rift (Basement) Pre Late Cretaceous CAP~115Ma Large rift border faults. Synthetic smaller extensional faults. Large depression develops between these. General trend in NNE strike.
- 23. Tectono-Stratigraphic Evolution Faults begin to link up. into larger master faults. Extensional faults develop oblique to major rift faults. Major source rock intervals are located in the HW of these faults. Syn-Extension 1 Late Cretaceous CAL~110Ma
- 24. Tectono-Stratigraphic Evolution Post-Extension 1 Early Paleocene CS~85Ma New extensional faults develop again oblique to major rift faults (crestal collapse structures accommodating inversion perhaps). Major marine transgression i.e. differential compaction. Prograding delta clinoforms develop towards the WNW. Two clearly different strike trends.
- 25. Tectono-Stratigraphic Evolution Post-Inversion Early Miocene (TO)~23Ma Syn-extensional up-dip growth strata. Master rift faults reactivated during syn-inversion. HW anticline and FW synclines. Erosional unconformity develops. New NE depocenter with many horsts and grabens.
- 26. Tectono-Stratigraphic Evolution Syn-Extension 2 Early Pliocene (TM)~7Ma Recent extensional faults reactivated. Other rift faults negatively inverted. Faults only active in the North of study area. NE strike trend.
- 27. Tectono-Stratigraphic Evolution Present Day (0Ma) Lack of extensional activity (only 10% of faults active at this time), evidence in seismic. No faults seen on this surface.
- 28. Migration Pathway & Traps Risk Analysis
- 29. Conclusions • Sedimentary strata record four main periods of deformation; • Locations and orientations of various periods of faulting are influenced by the locations and orientations of pre-existing faults; • Basement reactivation, inversion, fault propagation and recent extension observed in the Maari survey; • Plio-Pleistocene faults in the Maari Area form a relatively immature fault system i.e. long fault lengths achieved rapidly; • Exploration targets comprise both structural and stratigraphic objectives, with high risk levels due to multiple phases of reactivation (inversion and recent extension) & seal effectiveness;
- 30. ACKNOWLEGEMENTS Professor Ken McClay Dr. Nicola Scarselli Dr. Ian Watkinson Geoscience New Zealand (GNS Science) – Maari survey dataset Halliburton Landmark – Seismic Interpretation Software (DecisionSpace & Geoprobe) THANK YOU FOR LISTENING! IN ASSOCIATION WITH
- 31. Further Study • Inversion of Late Cretaceous Rift Faults to understand the implications of structural style on New Zealand’s plate boundary settings; • Investigation of Plio-Pleistocene fault kinematics and growth history within Maari 3-D survey; • Implications of inversion and extension on the migration of hydrocarbons along faults;
- 32. EXTRA SLIDES
- 33. Exploration History Source: Modified from (King et.al., 2010) & (Energy-pedia.com, 2016)
- 34. Structural Elements Inverted rift faults from the Late Cretaceous in the blue area (South basin where my dataset is and also the Cape Egmont Fault Zone) with recent volcanics found in the North of the Taranaki Basin. Western Platform is in yellow and is the stable deepwater region. Source: Modified from (Muir et.al., 2000) & (Knox, 1982)
- 36. Regional Extensional Direction perpendicular to antithetic faults Pre-Extension (Basement) CAP~115Ma Antithetic Fault Faults generally dipping SE Inverted rift faults Economic Deep Reservoirs
- 37. Syn-Rift (CAL~110Ma) Variance Time Slice RMS (CAL) horizon Intersecting seismic variance slice
- 38. Post-Extension Transgression (CS~50Ma) High amplitude chaotic reflectors. Channel basal surfaces. Prograding WNW Economic Regional Seal
- 39. Post-Recent extension (CC)~7Ma -100 100 300 500 700 900 1100 22 7 0 CumulativeThrow(m) Age (Ma) Miocene to Plio-Pleistocene Fault Growth Curve Large Extensional NE Fault Smaller Extensional Faults not contributing much to recent extension D D’ Lack of faults in the south Negatively Inverted faults
- 40. C C’
- 41. Fault Growth Curves 0 500 1000 1500 2000 2500 3000 3500 4000 4500 5000 85 65 50 Cumulativehrow(m) Age (Ma) Late Cretaceous to Palaeocene Fault Growth Curve Large inverte d (Kiwi Rift Fault) Smalle r Fault Young er Structu re -100 100 300 500 700 900 1100 22 7 0 CumulativeThrow(m) Age (Ma) Miocene to Plio-Pleistocene Fault Growth Curve Large Extensional NE Fault Smaller Extensional Faults not contributing much to recent extension
- 42. Strike Dimension VS Fault Throw 0 100 200 300 400 500 1.9 3.5 6 6.5 3.8 4.8 6.5 7 6.6 Throw(m) Strike Dimension (Km) Post Extension Fault Strike Dimension (Km) Vs Throw (m) 0 500 1000 1500 16 12 9.5 4.2 8.5 2.7 11 9 6 6 7 Throw(m) Strike Dimension (Km) Syn-Inversion Fault Strike Dimension (Km) Vs Throw (m) 0 2000 4000 6000 2 3 3.5 3.8 5 5.8 6 7.2 9 9.5 14 25 Throw(m) Fault Length (Km) Syn-Extension 1 Fault Length (Km) Vs Throw (m) 0 2 4 6 3 7 8 8 10 11 11 16 Throw(Km) Fault Length (Km) Pre-Extension Fault Length (Km) Vs Throw (km) 0 1000 2000 3000 4000 5000 6000 1.8 2.5 2.8 3.5 4 4.3 4.5 6 8 10 19 Throw(m) Fault Length (Km) Post-Extension 1 Fault Length (Km) Vs Throw (m)
- 43. Fault Orientation (Rose Diagram)
- 44. Evolution Model of Inversion 1 2 3 4 5
- 45. Gippsland Comparative Basin Digital terrain image of the Gippsland Basin displaying the major tectonic Elements. Source: (Ga.gov.au, 2016)
- 46. Gippsland Basin Regional Line
Editor's Notes
- Welcome to the Taranaki Basin, offshore NZ, where I am working on 4D tectonic evolution with a major focus on inversion fault architecture.
- The Taranaki Basin encompasses an area of 330,000 km2 and is located along the west coast of New Zealand’s North Island, stretching out towards the Tasman Sea. The plate tectonic setting is shown in the left diagram with the Pacific plate actively subducting under the Australian plate. The basin is principally a subsurface feature, much of it present offshore. The location of the project is within the Southern Inversion Zone and Kupe Area, and the sedimentary succession is Cretaceous to Recent.
- The seismic data utilized for this study consists of one 3D dataset acquired by Geco-Prakla covering 500 km2 of the Maari Field, numerous 2D lines and 8 wells within the 3D data provide excellent well control. The Maari Well that is producing and is located within my area of 3D dataset amongst 16 other producing fields in the area all with successful plays related to inversion tectonics such as the prolific mature Maui field discovered in 1969. MAUI-1,2,3,4,5,6,7,8 – Drilled by Shell BP Todd Oil – for gas/condensate MOKI 1 – Oil Test (Tricentral exploration) MOKI 2A - Oil shows (Tricentral exploration) KUPE SOUTH 1 – National Petroleum (Gas/Condensate) KUPE-1 – Shell BP Todd Oil (Gas/Condensate) KUPE SOUTH 4 – TCPL Resources Ltd (Oil/Gas) Regional 2D lines in black, with a variety of attributes (coherency, reflection strength etc). Data can be challenging in areas so attributes are required to bring out best results. Two sets of 3D data shown in red squares
- The aims of the project were to create a tectonostratigraphic evolution of the Taranaki Basin to understand the implications of structural style on New Zealand’s plate boundary settings. Identify precise locations of where inversion first initiated on individual faults during compression and recent extension. Understand Plio-Pleistocene fault kinematics during recent extension and discuss the recent negatively inverted faults and reactivated faults and their implications with hydrocarbon migration.
- The paleogeography of the area begins in the Mid Cretaceous with the Tasman Sea beginning to rift.
- Upon cessation of the Tasman Sea spreading, New Zealand drifted away from Antarctica during the Mid Eocene. During this period of comparative tectonic quiescence, regional post-rift thermal subsidence occupied the basin during a widespread marine transgression.
- Middle Eocene to Oligocene, sees sea-floor spreading in the Emerald Basin, with subduction of the Pacific Plate under north-eastern New Zealand taking place in the Mid-Oligocene.
- The early Miocene highlights the Alpine Fault evolution, forming a link between west-dipping Hikurangi subduction and Emerald Basin spreading and oblique extension in the southwest. Relative motion across this plate boundary became increasingly convergent throughout the Neogene.
- Chrostratigraphy from literature suggests the Syn-Rift starts in the late Cretaceous to Paleogene, post rift stretches from the Paleocene to late Eocene, the key syn and post inversion occurs from the Late Eocene to mid Miocene, with post-compressional relaxation establishing a second extensional phase in the Plio-Pleistocene.
- This seismostratigraphy chart shows the Amplitude attribute used to identify horizons. Key unconformities and formation tops were picked from surface picks, suggesting good well data control. Many horizons are distinguished by high amplitudes and key tectonic events. Key horizons are: TO used to identify the timing of inversion, TM marking the onset of recent extension and CAP for identifying the pre-existing basement rift faults.
- A NW-SE trending regional line taken from my dataset penetrates through my 3D dataset (CLICK) Here is an amplitude attribute that highlights the strong reflector of the basement nicely. (CLICK) below is an interpretation showing megasequences and the typical stratal layout of the Taranaki Basin. A general shallowing to the SE and deepening to NW is observed. The largest oil fields in the Taranaki Basin are trapped in inverted harpoon anticlines due to the Oligo-Miocene compression.
- Fault maps generated from horizons highlight key tectonic features beginning with large rift faults and smaller synthetic faults, linking up to form larger faults during rifting and post rifting, these larger faults are inverted during compression and result in folding of syn and post extensional strata. After compression ceases some of these faults are reactivated and even negatively inverted during a recent stage of extension.
- Time thickness variations suggest a basin evolution story developing during the first syn extension phase with a Central depocenter and a SE palaeoflow. During the Post extension to syn-inversion phase a thin seal stretches over rift faults developing a weakness in trapping hydrocarbons, east of the thin seal are positive areas of uplift representing HW anticlines. After inversion ceases a new NE-SW trending depocenter develops. A-A’ is a section showing key inversion fault architecture in this dataset.
- This E-W trending line shows a key truncation of the folded post-rift after inversion. It has eroded almost all of the syn-inversion growth strata. Growth wedges are located in the HW of the inverted faults.
- Moving into Seismic Attribute Mapping. The pre-existing rifted fault architecture displays all rift faults with a NE-SW strike trend. They seem to be curved at the fault tips towards other segments suggesting future fault linkage in later tectonics. Rift faults dip SE with the largest faults generating the most throw and are also the most likely to be inverted, whilst smaller faults less than 10km in strike tend not to be inverted but instead reactivated, if that. Depocentres of sands and potential reservoirs are focussed in areas within the HW of the isolated half grabens. These sand reservoirs are typically deep and possibly in the overmature window.
- Faults grow in strike during the syn-rift. A 3D arch of the largest master rift fault can be seen in this coherency attribute extraction nicely. More recent faults are seen penetrating in a NE-SW strike trend.
- Rift faults during the post rift have ceased to grow in strike but gain in throw. A palaeo-high located between the two master faults represent an inverted HW anticline. Shell’s Maui-4 Well has drilled into this and has made a successful oil and gas discovery. 3 trends of faults show that the pre-existing rifted faults have linked up in 2 different orientations (purple and green) during the pre-rift and syn-rift, influencing the location of inversion. Smaller faults in (yellow) are concentrated in the NW, with a NE-SW strike, these are accommodation structures during compressional shortening in later inversion. The shelf is in the SE and is deepening to the NW during a marine transgression, evidence for this is provided in Section (A-A’).
- After inversion a new depocenter occupies the NE area observed in this Spectral Decomposition extraction. Compression has resulted in the majority of faults trending ENE-WSW. A Coherency extraction shows the inverted fault architecture such as: fault linkage, relay ramps and differentially segmented inversion along sections of the large central master fault. This fault happens to have produced the largest throw since the post rift. Inversion has resulted in gas leakage issues from structural traps evidenced in Section B-B’.
- Gas leakage occurs at the crests anticlines, utilizing reactivated faults to escape to higher stratigraphic levels observed in gas chimneys in seismic and pock marks on surfaces. The recent extensional phase also reactivates faults providing further gas escape routes.
- Recent extension occurs in the Plio-Pleistocene with evidence located mainly in the North of study area, with the limit of extension diminishing towards the south observed by a lack of faulting. Fault lengths tend to grow rapidly in strike and poorly in throw, highlighting an immature system of NE-SW trending faults. Evidence of the new extension and some rift faults being potentially inverted negatively is observed in Section (D-D’).
- Negatively inverted rift faults are attributed to the new depocentre in the NE and is evidenced by strata growing into a previously inverted rift fault in the upper sequences.
- To conclude the tectonostratigraphic evolution of the area I start with the 1st stage of deformation, where Pre-extensional rift border faults have influenced locations and orientations of 4 periods of faulting in later deformation sequences.
- Syn-extension is the 2nd stage of deformation shows a larger master fault growing from SE rotation of pre-existing fault blocks.
- Smaller faults begin to developing during the 1st post-extension phase due to differential compaction over rift faults, prograding deltas are seen stretching to W.
- The 3rd stage of deformation is Syn-Inversion which produces HW anticlines and FW synclines of the inverted large master faults. Post inversion sees major tectonics end for a short duration and a new depocenter developing in the NE.
- The most recent stage of deformation is an immature extensional fault system which has reactivated faults, and negatively inverted segments of the previously inverted master faults.
- Since the plio-pleistocene only 10% of faults are observed penetrating the surface resulting in potentially another post extension phase.
- Implications of 4 phases of deformation produce a lot of risk when exploring the Taranaki Basin due to the frequency of faults reactivating, by compression from inversion and recent reactivation from new extension, all contributing to seal breaching and escape features from traps.
- To conclude there are 4 sequences of deformation that are influenced by the locations of pre-existing faults. Basement reactivation, inversion, fault propagation and recent extension are all observed in the Maari 3-D survey; Plio-pleistocene faults represent an immature fault system. Exploration targets comprise of both structural and stratigraphic objectives, with high risk levels due to multiple phases of reactivation decreasing seal effectiveness;
- Thank you for listening!
- Inversion of Late Cretaceous Rift Faults to understand the implications of structural style on New Zealand’s plate boundary settings; Investigation of Plio-Pleistocene fault kinematics and growth history within Maari 3-D survey; Implications of inversion and extension on the migration of hydrocarbons along faults;
- EXPLORATION HISTORY Early discoveries in the Taranaki Basin have proven a record of oil and gas successes that make an important contribution to the national economy. In the 1950’s the modern age of exploration emerged and with the aid of seismic Shell discovered the onshore Kapuni field in 1959. With the ability to drill and explore offshore the largest hydrocarbon field Maui was discovered in 1969 (3.4 TCF), this field is now mature. In recent years many fields have become established as commercial such as Kapuni. Maari (In the dataset) and McKee (onshore field). There are 16 producing fields with successful plays related to inversion tectonics. Economics of the gas market has controlled exploration with some discoveries limiting exploration offshore. There are still underexplored basins close to the Maari field that have the possibility of significant unrealised reserves, as well as areas of the Maari filed that may yield undrilled reserves.
- Key structural elements are normal faults that have been inverted in the South. There is a volcanic region in the north and thrust tectonics at the western Taranaki Boundary Fault. The blue is where my dataset is located and is focussed in the Southern Inversion Zone of the Taranaki Basin (orange box). To the west of this location is the Western Stable Platform in the deeper water.
- The Rakopi Formation source rock interval can be picked through variance and amplitude attributes in the HW of the larger rift faults. These are the major source rocks for many plays in the Taranaki Basin. Inversion of rift faults has caused migration problems from this source rock to reservoirs.
- High amplitude chaotic reflectors and channel basal surfaces of a WNW prograding delta system characterise the post rift marine transgression providing an excellent extensive regional seal.
- Recent extensional
- This N-S trending seismic line shows new normal faults cutting through syn-inverted strata on the left within the FW of the previously inverted rift faults, thus utilizing the pre-existing weakness of then FW syncline.
- The deepwater Taranaki Basin seems to be time equivalent to Gippsland offshore oil-prone zone. Nearshore Taranaki Basin seems to be analogous to the gas-prone zone nearshore Gippsland. Australia’s most productive basin to date with comparable figures of TCF of gas and BBL of oil to Taranaki Basin. Valid analogies between the two basins either side of the Tasman Sea can be used to clarify poorly-understood factors. Here is an interpreted regional line that shows a similar basin tectonic structure to the Taranaki Basin.
- Inversion similar represented in the black circles. Equivalent horizon time intervals
- The majority of all hydrocarbon elements occur in the Palaeogene to Neogene transition pinpointing the sweet spot critical moment in the Early Miocene.