Well logging
•
11 likes•3,595 views

Well logs can be states as “a recording against depth of any of the characteristics of the rock formations traversed by a measuring apparatus in the well-bore.”

Recommended
More Related Content
What's hot
What's hot (20)
Similar to Well logging
Similar to Well logging (20)
Recently uploaded
Recently uploaded (20)
Well logging
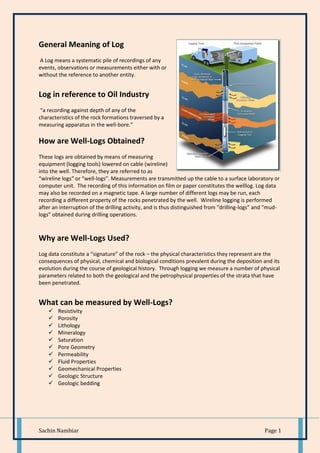
- 1. Sachin Nambiar Page 1 General Meaning of Log A Log means a systematic pile of recordings of any events, observations or measurements either with or without the reference to another entity. Log in reference to Oil Industry “a recording against depth of any of the characteristics of the rock formations traversed by a measuring apparatus in the well-bore.” How are Well-Logs Obtained? These logs are obtained by means of measuring equipment (logging tools) lowered on cable (wireline) into the well. Therefore, they are referred to as “wireline logs” or “well-logs”. Measurements are transmitted up the cable to a surface laboratory or computer unit. The recording of this information on film or paper constitutes the welllog. Log data may also be recorded on a magnetic tape. A large number of different logs may be run, each recording a different property of the rocks penetrated by the well. Wireline logging is performed after an interruption of the drilling activity, and is thus distinguished from “drilling-logs” and “mud- logs” obtained during drilling operations. Why are Well-Logs Used? Log data constitute a “signature” of the rock – the physical characteristics they represent are the consequences of physical, chemical and biological conditions prevalent during the deposition and its evolution during the course of geological history. Through logging we measure a number of physical parameters related to both the geological and the petrophysical properties of the strata that have been penetrated. What can be measured by Well-Logs? Resistivity Porosity Lithology Mineralogy Saturation Pore Geometry Permeability Fluid Properties Geomechanical Properties Geologic Structure Geologic bedding
- 2. Sachin Nambiar Page 2 Process of Well-Logging
- 3. Sachin Nambiar Page 3 Types of Well-Logging and Well-Logging Techniques Log measurements may either be open-hole or cased-hole. These log measurements are grouped into two broad categories: 1. those arising from natural phenomen 2. those arising from induced phenomena The first group simply employs a suitable detector to obtain the measurement; the second group requires an appropriate type of emitter to “excite” a particular response in the formation, in addition to a detection system. 1) Natural Phenomena: a) Natural gamma radioactivity b) Spontaneous Potential c) Formation Temperature d) Hole-diameter e) Inclination of the hole 2) Induced Phenomena: a) Electrical Measurements b) Nuclear Measurements c) Acoustic
- 4. Sachin Nambiar Page 4 The well log types discussed here are: Resistivity Log Spontaneous Potential Log Caliper Log Neutron Density Log NMR Log, and Sonic Logs Resistivity Log The resistivity of a substance is the electrical resistance measured between opposite faces of a unit cube of the substance at a specified temperature. Formation Resistivity is a key parameter in determining hydrocarbon saturation. The resistivity of a formation depends on the resistivity of the formation water, the amount of water present, and the structure and geometry of the pores. An electric current pass through a formation because it contains water with enough dissolved ions to be conductive. With a few rare exceptions, such as metallic sulfides and graphite, dry rock matrix is a good electrical insulator. Formation resistivities are usually in the range of 0.2 to 1000 ohm/m. Resistivities higher than 1000 ohm/m are uncommon in most permeable formations but are observed in impervious, low-porosity formations such as evaporates. A few low-porosity hydrocarbon bearing formations with almost no formation water can have resistivities as high as 20,000 ohm/m. Resistivity increases with decreasing pore space; 10% porous formation is about 10 times more resistive than 30% porous formation. Most wireline resistivity-logging tools also have the ability to measure and record small differences in the electrical potential that occur spontaneously in conductive muds as a continuous SP curve. Spontaneous Potential Log The SP curve is a continuous recording v/s. depth of the electrical potential difference between a movable electrode in the borehole and a surface electrode.
- 5. Sachin Nambiar Page 5 The deflection may be either to the left (negative direction) or to the right (positive direction), depending upon the salinity content of the formation water and the mud filtrate. If the formation water salinity is greater than the mud filtrate salinity, the deflection is observed on the left side. Adjacent to Shales, SP readings usually define a straight line known as the shale baseline. Next to permeable formations, the curve departs from the shale baseline; in thick permeable beds, these excursions reach a constant departure from the shale baseline defining the ‘sand line’. The SP log is typically scaled at 100mV per log track. The movements of ions from the drilled formations to the borehole accounts for 85% of the measured potential difference, and the invasion of drilling mud from the borehole into the formation accounts for 15%. For this reason, SP Logs are a measure of permeability. Caliper Log Caliper log provides continuous measurement of the size and shape of a borehole along its depth. It also indicates cave-ins or shale swelling in the borehole, which can affect the results of other well logs. Since wellbores are usually irregular – rugose, it’s important to have a tool by our side which measures diameter at several different locations simultaneously. Caliper data are integrated to determine the volume of the openhole, which is then used in planning cementing operations. Gamma Ray Log Gamma ray Log measures radioactivity to determine the types of rocks. Decay of radioactive elements produces high energy gamma ray. This gamma radiation originates from K-40 and the isotopes of U-Ra and Th series. A physical phenomenon called Compton Scattering is associated here.
- 6. Sachin Nambiar Page 6 Compton Scattering occurs until the gamma ray is of low energy that it is completely absorbed by the formation. The Gamma ray Log curve appears similar to SP curve of the electrical log. Shale has normally the highest curve value. Here, there is no baseline or zero. All the recordings are positive. The curve is not affected with variation in borehole diameter, or different formation fluids. Also, any information regarding porosity and permeability is not obtained by this curve. However, it’s greatly affected by highly radioactive formations. Neutron Log Neutron Logs determine porosity by measuring the amount of hydrogen atoms (neutrons) in the pores. This tool has a neutron source. Hydrogen absorbs neutrons and emits Gamma rays. Hydrogen is mostly found in the formation fluids like water or hydrocarbons. Neutron logs can also be run in Cased holes. It measures the neutron bombardment effect of a formation. The neutron bombardment upsets the radioactive equilibrium of the rocks in the bore hole and includes a secondary gamma ray radiation whose intensity is much higher than the natural gamma ray radiation from these rocks. The curve is similar in appearance to the resistivity curve of electrical log. Neutron curve is difficult to interpret alone (separately). But it cannot always be correlated because it represents primary fluid content. Shale has normally the lowest curve value. So it may be used as baseline for the curve. Nuclear Magnetic Resonance Log – NMR Log NMR Logs measures the magnetic response of the fluids. It is used to measure both porosity and permeability of the formation rocks. It also assists in the identification of the reservoir fluid type in the pore spaces. It also provides valuable information about rock composition and hydrocarbon producibility. NMR Logging tools are equipped with powerful permanent magnets that create
- 7. Sachin Nambiar Page 7 magnetic fields in the rock formations surrounding the borehole. The Hydrogen nuclei contained in the oil, gas and brine filling the rock pore spaces behave like microscopic magnets. The magnetic moments of these nuclei align along the direction of the applied magnetic field thus creating a net magnetization or polarization in the formation. Then the time required to align the hydrogen nuclei along the direction of the magnetic field is characterized by a longitudinal relaxation time, denoted by T1 symbol, is recorded as it’s referred to as the longitudinal direction. The rate of decay of NMR signal can be described by a distribution of decay times, T2s, which are called transverse relaxation times. As T2 values can be related to pore sizes, an idea about the porosity can be obtained by T2 distribution. Sonic Log Sonic logs provide information about a formation’s interval transit time which is a measure of a formation’s capacity to transmit seismic waves. Geologically, this capacity varies with lithology and rock textures, most notably decreasing with an increasing effective porosity. Sonic logs are used to calculate porosity of a formation if the seismic velocity of the rock matrix and the pore fluid are known. Sonic logs are used in mineral exploration, especially exploration for iron and potassium. It is also used in the cement evaluation and also the identification of the gas-bearing intervals.
- 8. Sachin Nambiar Page 8 References 1. O. Serra (1988). Fundamentals of Well-log Interpretation: The acquisition of logging data. Elsevier Science Publishers; Elsevier Publications. 2. Toby Darling (2005). Well Logging and Formation Evaluation. Elsevier Publications; Gulf Professional Publishing. 3. Well Logging. Wikipedia, the free encyclopedia. 4. E. R. (Ross) Crain. What is a Log? CPH – Crain’s Petrophysical Handbook. 5. B. C. Schwartz. Lecture Notes. West Virginia University. 6. Well Logging Tools: Product Details. Shanghai Shenkai Petroleum & Chemical Equipment Co., Ltd. 7. Austin Boyd; Michel Claverie; Martin Isaacs; Tony Smithson; (2011). Defining Logging. Schlumberger Oilfield Review, Spring 2011. 8. Types of Logs (2015). Petrowiki, published by SPE International. 9. Resistivity and spontaneous (SP) logging (2015). Petrowiki, published by SPE International. 10.Spontaneous (SP) Log (2015). Petrowiki, published by SPE International. 11. Caliper Log. Wikipedia, the free encyclopedia. 12. Wireline Logs and Interpretation (2014). HubPages. 13. Tom Sturman; Luke Stoeckel. Gamma Ray Logging (2011). DrillEngGroup9-FormationEvaluation. 14.Density and Neutron Log Overlay (2003). Oil and Gas Information, Kansas Geological Survey. 15. Robert Freedman; Nick Heaton. Fluid Characterization using Nuclear Magnetic Resonance Logging (2004). Society of Petrophysicists and Well Log Analysts. 16.George R. Coates; Lizhi Xiao; Manfred G. Prammer. NMR Logging Principles & Applications (1999). Halliburton Energy Services. Halliburton Energy Services Publications. 17. Sonic Logging. Wikipedia, the free encyclopedia. 18. E. R. (Ross) Crain. Sonic Log Basics. CPH – Crain’s Petrophysical Handbook.