Downloaded 219 times
![EMERGENCY TRANSPORT PLANNING FOR MATERNAL HEALTH IN RURAL GHANA
MAHAMA SEINU SEIDU, MSc TRANSPORT PLANNING AND THE ENVIRONMENT SUPERVISOR: JEFFREY TURNER 2ND READER: FRANCES HODGSON
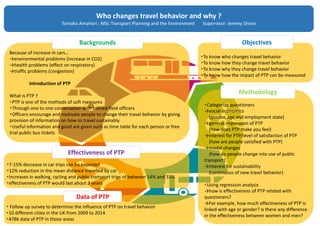
BACKGROUND
REFERRAL SYSTEM
AIM AND OBJECTIVES
METHODOLOGY
EXPECTED OUTCOME
REFERENCES
Thaddeus and Maine,1994
The aim of the study is to assess the impact/effect of Ambulance
services in maternal health
OBJECTIVES:
The study is to focus on understanding and assessing the role of
ambulance services in emergency maternal health in Ghana. This is
intended to be achieved through :
Assessment of the role and impact of Ambulance services in
maternal health delivery in rural areas .
Whether or not Ambulance services have any significant
contribution to reduction of maternal mortality.
How efficient and effective transport can improve emergency
maternal health intervention in rural Ghana
Millennium Development Goal (MDG 5),maternal mortality is
identifies by the United Nations(UN) as a serious concern for the
welfare of women across the world particularly a pandemic in
developing countries and specifically an “unfortunate tragedy in sub
sahara Africa as the region records the highest maternal mortality
ratio” (Ganyaglo & Hill, 2012)
About 350,000 women die annually from pregnancy related causes
and child birth complications .
Utilization and access to health facilities for maternal services in
these settings is hindered by several factors including lack of
transport and high cost –(4) .Referral intervention aim to address
these problems and one such intervention is the provision of
emergency ambulance referral transport services.
In most developing countries such National ambulance services
have not been sustained effectively, providing very limited, or no
service. As a result, many segments of the population, particularly
in rural or peri‐urban areas are not covered and this poses serious
challenges to reach the appropriate health facility in case of an
emergency.
In Ghana ,the maternal mortality ratio (MMR) is currently 350 in
every 100,000 live births .It is estimated that 75 percent of the
women who die in the course of childbirth do so as a result of
inadequate emergency transport‐(1).
Transport is critical in the provision of health delivery and access to
services, and in the Overall effectiveness of the referral process.
As have been identified by Thaddeus and Maine(1994), poor access
and lack of reliable transport also explain why families delay in
seeking care in an emergency situation or arrive too late at health
facilities for effective treatment as well as poor service utilization.
Emergency transport interventions could save an estimated 75
percent of pregnant women each year, which could further save
nearly 14,500 births if functional referral systems are put in place.
The study will be conducted in the Millennium Village project
communities in the Ashanti Region of Ghana. A literature review
will be done. Data on ambulance utilisation for maternal
emergency referral in the health facilities in this communities
will be accessed. Other case received without intervention of
the ambulance services within the same period will also be
collected .The response times and cost will be determined as
well as the outcomes of the different scenarios. Analysis will
then be done to assess the impacts.
Lack of ambulances and absence of other means of transport
in remote areas (Shehu et al. 1997) and high transport costs
represent a major constraint for women and their families
who need to access health facilities for both preventive and
emergency care. A key solution therefore is to improve
transport access in a way that is both affordable and
sustainable for these two levels of care.
It should be possible to reduce maternal deaths in rural Ghana
by effective and efficient emergency (ambulance) referral
transport planning .
1. Babinard,J. and Roberts,P.,2006 Maternal and Child Mortality Development Goals:
What Can the Transport Sector Do? The World Bank Group Washington, D.C.
http://www.worldbank.org/transport/
2. Thaddeus S, Maine D (1994) Too far to walk: maternal mortality in context. Soc Sc
Med 38(8): 1091–1110.
3. Lungu K, Kamfose V, Hussein J, Ashwood‐Smith H (2001) Are bicycle ambulances and
community transport plans effective in strengthening obstetric referral systems in
Southern Malawi. Malawi Med J 13: 16–18.
4. Maxwell Ayindenaba Dalaba,et al.,2015 Cost to households in treating maternal
complications in northern Ghana: a cross sectional study. BMC Health Services
Research 2015, 15:34 doi:10.1186/s12913‐014‐0659‐1
5. Murray SF, Pearson SC (2006) Maternity referral systems in developing countries:
current knowledge and future research needs. Soc Sc Med 62: 2205–2215.
6. WHO | Maternal mortality [http://www.who.int/mediacentre/factsheets/fs348/en/]
Without intervention
With intervention
UNIVERSITY OF LEEDS](https://image.slidesharecdn.com/allmastersposters2014-15-150506105803-conversion-gate01/85/Masters-Dissertation-Posters-2015-18-320.jpg)
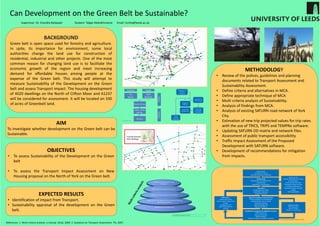
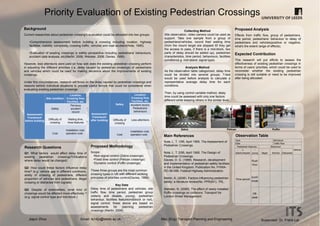
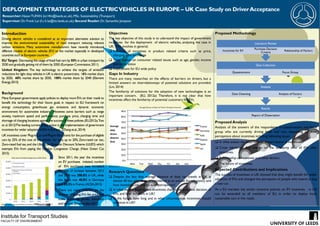
![Motorcyclists’ Acceptance of Automated
Road Transport Systems in Taiwan
Shu-Cheng, Hsieh (ml13sch@leeds.ac.uk)
MSc (Eng) Transport Planning & Engineering
Supervisor: Dr Natasha Merat, Tyron Louw
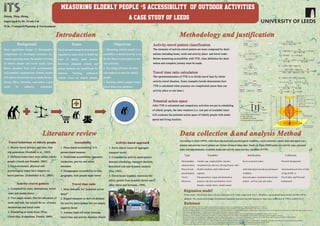
Motorcycles in Taiwan
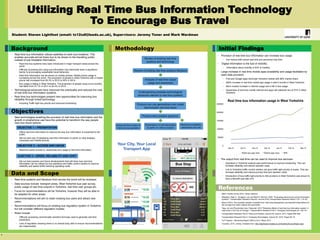
Large density and amount of registered motorcycles
Motorcycles : Other vehicles = 1.8 : 1
Public Transport in Taiwan
Projects promoting public transport
by Taiwanese government since 2010
Involving buying new buses, improving
service quality, providing real-time and
subsiding rural routes
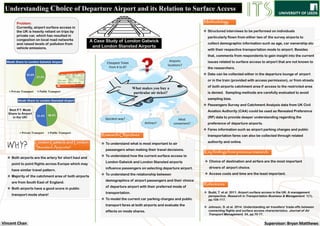
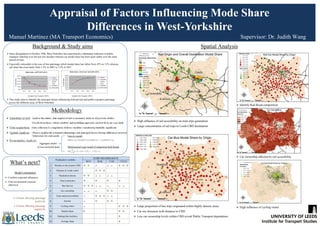
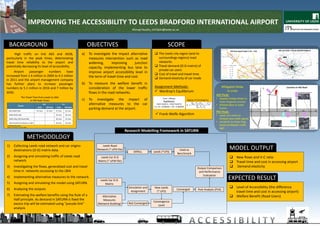
2. Background
Year Car Bus &
Coach
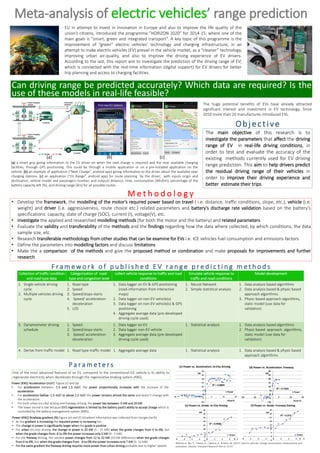
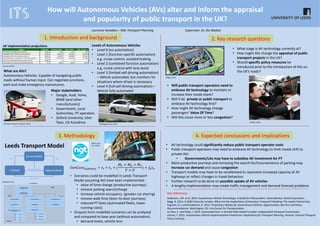
LGV HGV Subtotal Motorcycle
2013 6,236,879 31,960 875,544 162,122 7,367,522 14,195,123
2014 6,405,778 32,928 890,703 163,446 7,554,319 13,735,994
Road user interactions
Conflicts between
motorcycles and buses
(Particularly at bus
stops)
Public Transport
Little changes on usage
Financial difficulties for
operators
Lack of drivers
3. Research Problems
An example: City Mobil2
An EU project
assessing ARTS
Deliver ARTS in several
European cities
Investigate road users acceptance
(focus on pedestrian)
Aims:
1) Evaluate what ARTS could provide to sustainable
transport
2) Examine and improve interactions between ARTS and
other road users
How about in Taiwanese
transport environment?
4. Research Motivation
Literature review, technology approach and integration
Questionnaire
Sample: Motorcyclists in Taiwan
Asking acceptance in two sections
Data Analysis and discussion
5. Methodology
Section 1
• Applying Drive Behaviour Questionnaire
• Initial acceptance by introducing ARTS
Section 2
• Scenario with safety systems on ARTS
• Scenario with road infrastructure for ARTS
Understand the factors that influence
motorcyclist’s acceptance of ARTS
Motorcyclist–centred design recommendation
fro ARTS in Taiwan
6. Expected Outcomes
Public transport systems based on the use of a fleet of
communication-enabled cybercars – road vehicles with
automated driving capabilities.
Advantages
Provide “Last-mile connections” for individuals
Low personnel costs (No drivers)
Sustainable urban transport
Existing Cases
1. What is Automated Road Transport
Systems (ARTS)?
ARTS in the West Region of
Lausanne, Switzerland
ARTS in La Rochelle, France
Key References
CityMobil (2015), http://www.citymobil-project.eu/. CityMobil2 (2015), http://www.citymobil2.eu/
Directorate General of Highways, Ministry of Transportation and Communications, Taiwan (R.O.C.) (2014), Annual Report for Motor Vehicle Administration.
Rockall, Wil, 2014, Can driverless car see off cyber attacks? [Online] London, United Kingdom. http://goo.gl/oFQZNg
Reason, Manstead, Stradling, Baxter & Campbell (1990), Errors and violations on the roads: a real distinction? http://goo.gl/ZMzgVX
Understand motorcyclists’ initial acceptance of ARTS in
Taiwan
Find out what will increase motorcyclists’ acceptance and
confidence of ARTS when assessing them, in:
Safety systems on ARTS
Road infrastructure
5. Objectives
Can ARTS be a solution?](https://image.slidesharecdn.com/allmastersposters2014-15-150506105803-conversion-gate01/85/Masters-Dissertation-Posters-2015-21-320.jpg)
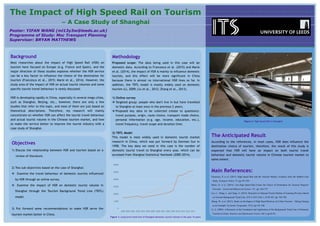
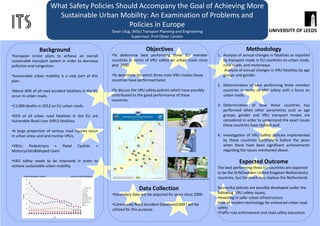
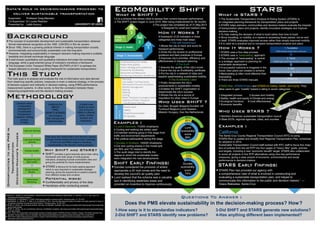
![Traffic flows thresholds for Shared Space in Leeds
Transport Planning and Engineering. Student: Russell Oakes Supervisor: Dr James Tate
Introduction
Shared Space is a concept where streets are re-engineered to reduce the
dominance of motor vehicles (DfT, 2014) Street signage is limited and kerb heights
are reduced or removed completely in some cases.
The focus for this project will be in Headingley, North West Leeds. Pedestrian
desire lines vary due to the mixture of retail and leisure activities this district has to
offer; therefore providing an ideal location to test the theory.
Literature
The dissertation will be educated by various sources of literature, including...
Manual for Streets (1 & 2), Liverpool City Centre Plan (1961), Living Streets
Policy, Local Authority Policy (for example Leeds City Council Supplementary
Planning Documents), University of the West of England Research, Written
interview with the late Hans Monderman and scheme studies.
Objectives
To ascertain the potential for bringing Shared Space to Headingley by:
Understanding previous comparable Shared Space Schemes
Compiling a resource containing pedestrian and vehicular data
Applying the data to a Micro-simulation Package (Aimsun & Legion) with
sensitivity tests
Analysing the Aimsun & Legion outputs
Determining applicability to Headingley and wider Leeds
These objectives will act as milestones throughout the dissertation with the
expectation that each objective will be a development on its predecessor.
Methodology
The project will require site visits to various
contrasting examples, compilation of pedestrian
data from Leeds City Council and a suitable
model simulation running to satisfy the scope of
the project.
Anticipated issues include the inability to
compile pedestrian data for the Headingley
area, therefore flexibility with pilot site locations
may be required.
Two preliminary pilot sites of contrasting traffic
density will be used in order to determine the
relative scales of operation for a Shared Space
scheme. Currently, these sites are North Lane/
Otley Road and St Michaels Road outside the
Church.
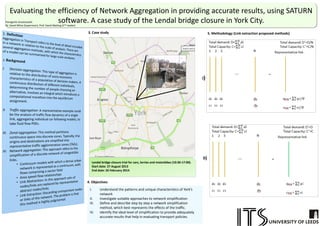
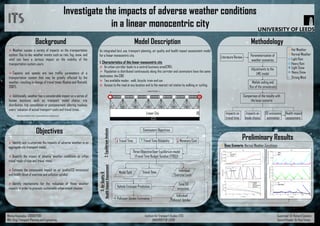
Coventry Top: Before. Source: Oakes, R (2010) Bottom: After. Source: Oakes, R (2015)
Preston
De-cluttering of street furniture including
the removal of traffic lights
Narrowing of Fishergate providing wider
pavements
Provision of informal pedestrian crossings
Top: Before. Source: Oakes, R (2013) Bottom: After. Source:
Oakes, R (2015)
UrbanCaseStudies
Top: Before. Source: Oakes, R (2010) Bottom: After. Source:
Oakes, R (2015)
Downgraded routes complimented by
extensive landscaping
Closure of through routes and
implementation of UKs largest 20mph zone
(Coventry City Council, 2010)
Mixture of zebra and informal crossings
Coventry
Top: St Michaels Road. Source: Oakes, R (2015)
Bottom: Otley Road/North Lane. Source: Oakes, R (2015)
Sources used in the dissertation will include:
Early Indications and
Potential Outcomes
No Shared Space scheme is identical, as
demonstrated with the case studies. Therefore, the
site visits will assist in the appreciation of the issues
apparent in Headingley.
An understanding of which environments would
best suit a Shared Space scheme with the potential
to apply the key findings of this project to policy
making within Leeds City Council.
Communities are aware of the Shared Space
concept and have approached Leeds City Council
requesting that this is investigated.
If the timescales fit, efforts will be made to draw
comparisons where relevant to other Shared Space
schemes. This may lead to good practice workings
with other Local Authorities subject to interest.
Sources of Information
The dissertation will call upon quantitative and qualitative sources in order to provide a
robust analysis. This could include:
Quantitative
Leeds City Council Transport Monitoring Database
Primary data collection (where required)
Scheme monitoring reports
(where available)
Qualitative
City and County Borough of Liverpool 1965, Liverpool City Centre Plan,
Liverpool, City and County Borough of Liverpool
Moody, S. and Melia, S. (2014) Shared space: Research, policy and
problems. Proceedings of the Institution of Civil Engineers - Transport, [Online]
Available at: http://www.icevirtuallibrary.com/content/article/10.1680/
tran.12.00047 (Accessed 23rd April 2015)](https://image.slidesharecdn.com/allmastersposters2014-15-150506105803-conversion-gate01/85/Masters-Dissertation-Posters-2015-23-320.jpg)
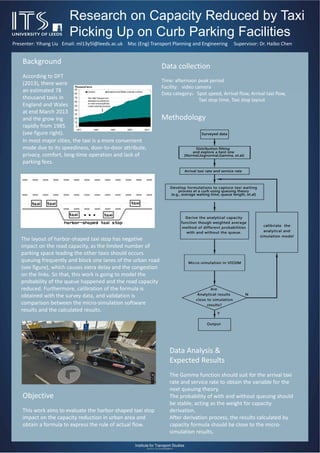
![Who spend what on the High Street? A comparison of the importance of non-car access between city
centre and local shops areas. Institute for Transport Studies, University of Leeds, UK.
RESEARCH QUESTION
(sustrans, 2006)
55% 22% (4'.•"'10% (6cq13% (1 1 %)
Actual mode of customer travel
(Shopkeepers estimates in brackets)
Shoppers' choice of travel modes in Bristol study
rivers limit the range of
compact urban centre, flat
ervice.
One of the best Park and Ride
QUESTIONS & OBJECTIVES
Which are the accessibility patterns in the city centre and
local shops areas?
Have they an implication in shops turnover?
To determinate if retailers perception about their customer mode
of access is accurate, in order to promote a better understanding of
transport and land-use policies.
CITY OF YORK
Advantages for sustainable modes:
geography and good public transport s
Foot street historical and retail centre.
schemes in the UK.
Disadvantages: Historical walls and
interventions.
METHODOLOGY
1) Literature review of economic, planning and transport
approaches to High Streets in U.K. and previous academic and "grey"
studies.
2)Questionnaires designing based on previous studies and
amendments for accuracy to City of York
RISK
Data collection task may take more time than expected.
Get retailers answers while they are working.
Fail in achieving the proposed sample size.
Lack of support from York City Council
CONTEXT
"Local areas should implement free controlled parking schemes..."
"Cars are an intrinsic part of the way many people shop..."
Worths Report,2011,p.5 and p.271
"There is not such thing as "free" parking"
(Tyler et a1,2012,p.651
"The literature on parking and retail divides into two groups: those
suggesting that parking is important for retail activity and those arguing
that retailers have a wrong perception about the modal split of their
customer and usually overestimate car use for shopping"
IMingrado,2012,p1951
3)Data will be collected by different methods with the aim of
accumulating as many answers as possible: face to face, mail drop and
email questionnaires.
4. Analysis: data analysis, interpretations and comparison with other
results from UK and overseas.
1. Conclusion: Findings of the work. Answers to the research questions
and implication for the city of York.
REFERENCES
s,M. (2011). The Portas Review. An independent review into the future of our Highs Streets. [ONLINE].
[Accessed 29 February 2015]. Available from: https://www.gov.uk/government/uploads/system/up-
loadsiattachment_dataifile/6292/2081646.pdf Sustrans. (2006). Real and Perceived travel behaviour in
neighbourhood shopping areas in Bristol. Bristol: Sustrans.
Tyler, S., Semper, G., Guest, P., & Fieldhouse, B. (2012). The relevance of parking in the
success of urban centres, A review for London Councils.
UNIVERSITY OF LEEDS
DATA
Desirable sample size:
Consumers centre(n=200)
Consumer local( n= 100);
Retailers centre(n= 50)
Retailers local(n=25).
QUESTION EXAMPLES
"How often and by which means do
you shop"?
"How often and by which means
do you think your customers
shop?"
Poster Presentation: 01 May 2015. Student: Pedro Scarpinelli . Dissertation Tutor: Professor Greg Marsden. Institute for Transport Studies, University of Leeds](https://image.slidesharecdn.com/allmastersposters2014-15-150506105803-conversion-gate01/85/Masters-Dissertation-Posters-2015-26-320.jpg)
![Traffic flows thresholds for Shared Space in Leeds
Transport Planning and Engineering. Student: Russell Oakes Supervisor: Dr James Tate
Introduction
Shared Space is a concept where streets are re-engineered to reduce the
dominance of motor vehicles (DfT, 2014) Street signage is limited and kerb heights
are reduced or removed completely in some cases.
The focus for this project will be in Headingley, North West Leeds. Pedestrian
desire lines vary due to the mixture of retail and leisure activities this district has to
offer; therefore providing an ideal location to test the theory.
Literature
The dissertation will be educated by various sources of literature, including...
Manual for Streets (1 & 2), Liverpool City Centre Plan (1961), Living Streets
Policy, Local Authority Policy (for example Leeds City Council Supplementary
Planning Documents), University of the West of England Research, Written
interview with the late Hans Monderman and scheme studies.
Objectives
To ascertain the potential for bringing Shared Space to Headingley by:
Understanding previous comparable Shared Space Schemes
Compiling a resource containing pedestrian and vehicular data
Applying the data to a Micro-simulation Package (Aimsun & Legion) with
sensitivity tests
Analysing the Aimsun & Legion outputs
Determining applicability to Headingley and wider Leeds
These objectives will act as milestones throughout the dissertation with the
expectation that each objective will be a development on its predecessor.
Methodology
The project will require site visits to various
contrasting examples, compilation of pedestrian
data from Leeds City Council and a suitable
model simulation running to satisfy the scope of
the project.
Anticipated issues include the inability to
compile pedestrian data for the Headingley
area, therefore flexibility with pilot site locations
may be required.
Two preliminary pilot sites of contrasting traffic
density will be used in order to determine the
relative scales of operation for a Shared Space
scheme. Currently, these sites are North Lane/
Otley Road and St Michaels Road outside the
Church.
Coventry Top: Before. Source: Oakes, R (2010) Bottom: After. Source: Oakes, R (2015)
Preston
De-cluttering of street furniture including
the removal of traffic lights
Narrowing of Fishergate providing wider
pavements
Provision of informal pedestrian crossings
Top: Before. Source: Oakes, R (2013) Bottom: After. Source:
Oakes, R (2015)
UrbanCaseStudies
Top: Before. Source: Oakes, R (2010) Bottom: After. Source:
Oakes, R (2015)
Downgraded routes complimented by
extensive landscaping
Closure of through routes and
implementation of UKs largest 20mph zone
(Coventry City Council, 2010)
Mixture of zebra and informal crossings
Coventry
Top: St Michaels Road. Source: Oakes, R (2015)
Bottom: Otley Road/North Lane. Source: Oakes, R (2015)
Sources used in the dissertation will include:
Early Indications and
Potential Outcomes
No Shared Space scheme is identical, as
demonstrated with the case studies. Therefore, the
site visits will assist in the appreciation of the issues
apparent in Headingley.
An understanding of which environments would
best suit a Shared Space scheme with the potential
to apply the key findings of this project to policy
making within Leeds City Council.
Communities are aware of the Shared Space
concept and have approached Leeds City Council
requesting that this is investigated.
If the timescales fit, efforts will be made to draw
comparisons where relevant to other Shared Space
schemes. This may lead to good practice workings
with other Local Authorities subject to interest.
Sources of Information
The dissertation will call upon quantitative and qualitative sources in order to provide a
robust analysis. This could include:
Quantitative
Leeds City Council Transport Monitoring Database
Primary data collection (where required)
Scheme monitoring reports
(where available)
Qualitative
City and County Borough of Liverpool 1965, Liverpool City Centre Plan,
Liverpool, City and County Borough of Liverpool
Moody, S. and Melia, S. (2014) Shared space: Research, policy and
problems. Proceedings of the Institution of Civil Engineers - Transport, [Online]
Available at: http://www.icevirtuallibrary.com/content/article/10.1680/
tran.12.00047 (Accessed 23rd April 2015)](https://image.slidesharecdn.com/allmastersposters2014-15-150506105803-conversion-gate01/85/Masters-Dissertation-Posters-2015-27-320.jpg)
![Does rail franchise competition damage potential
for environmental performance?
Nicholas Forgham MSc Transport Planning Supervisor: Dr Caroline Mullen
• To investigate the justification for enhancing environmental
performance in rail franchises.
• To assess the effectiveness of the methods and measures
used by franchisees to improve their environmental
performance.
• To identify and discuss what barriers are preventing further
environmental performance improvements.
Context and Rationale
Objectives
Methodology
Key References
Dissertation Key Texts
Denscombe, M. (2011) The Good Research Guide. 5th edition. Maidenhead:
McGraw-Hill.
Department for Transport (2007) Delivering a Sustainable Railway. London: The
Stationary Office
Glover, J. (2013) Principles of Railway Operation. Hersham: Ian Allan Publishing.
Network Rail (2009) Network RUS: Electrification. London: Network Rail.
Network Rail (2013) Industry Strategic Business Plan - England and Wales:
Industry’s response to the High Level Output Specification for CP5. London:
Network Rail.
Rail Safety and Standards Board (2011) The Rail Industry Sustainable
Development Review. London: RSSB.
Rail Steering Group (2014) Long Term Passenger Rolling Stock Strategy for the
Rail Industry. London: Angel Trains.
The dissertation will adopt a qualitative structure using both
primary and secondary forms of data taking the form of:
• Documentary analysis of current reports on environmental
performance and the structure of the rail industry.
Denscombe (2014) suggests the wealth of information and
permanence of this research method can strengthen
investigations.
• Interviews with key stakeholders such as TOCs, Local
Authorities and Transport Campaign Groups.
• Analysis and evaluation of results to deliver conclusions on
environmental performance within the UK rail industry to
inform future policy direction.
Scope
The size and scale of the UK rail industry make it important for
this dissertation to clearly outline it’s intended scope as follows:
• Carbon Dioxide (CO2) reductions and how this is
achievable in the current railway industry from the
perspective of two geographically and operationally
different TOCs.
• To examine if environmental performance improvements
are motivated by economic or social reasons.
• To understand where the momentum for environmental
performance is in the current industry structure – TOCs,
ROSCOs, Network Rail.
Source: DfT (2012)
Source: RSSB (2011)
High Level Output Strategy Electrification by 2019
Source: Mark (2015)Source: Hampton (2015)
Source: Community Rail Lancashire (2015)
Dissertation Images
Community Rail Lancashire (2015) Accrington Station [online]. Available from:
http://www.communityraillancashire.co.uk/lines/east-lancashire. [Accessed 26th
April 2015].
DfT (2012) Rail HLOS electrification by 2019 [online]. Available from:
https://www.gov.uk/government/uploads/system/uploads/attachment_data/file/36
47/map-hlos-electrification.pdf. [Accessed 25th April 2015].
Hampton (2015) Together in electric dreams [online]. Available from:
http://www.roberthampton.me.uk/wordpress/wp-content/uploads/2015/03/bigger-
better-electric.jpeg. [Accessed 27th April 2015].
Mark (2015) 185113 at Eccles [online]. Available from:
http://mark5812.smugmug.com/keyword/Eccles/i-fxfCPvP/A. [Accessed 2015]
RSSB (2011) Sustainable Rail Program - Meeting Rail’s Carbon Ambition:
Carbon and cost reduction in the Industry Strategic Business Plan. London:
RSSB.
The demand for rail travel is increasing with over 1.4bn
passengers using the UK rail network in 2012, twice as many
as 1995 (Network Rail, 2013). This growth in demand is being
accommodated in Network Rail’s latest Control Period 5 (2014-
2019) which for the first time in recent years includes ambitious
plans for railway electrification.
The privately owned Train Operating Companies (TOCs), who
run services on Network Rail’s infrastructure, operate under a
franchise system specified by the Department for Transport
(DfT) which details performance criteria they must deliver
during their tenure.
However, the relatively short length of railway franchises,
compared to long term environmental performance
improvement projects, such as electrification, mean that
incumbent franchisees may be in the position of having to
endure service interruption and reduced revenues for
environmental performance gains which may not arise until the
next franchise (Glover, 2011).](https://image.slidesharecdn.com/allmastersposters2014-15-150506105803-conversion-gate01/85/Masters-Dissertation-Posters-2015-32-320.jpg)

![Effectiveness Evaluation of the Discounted Residential MetroCard Plan in West Yorkshire
Mengjiao Long
Supervisor: Jeremy Toner; Second Reader: Jeremy Shires
UNIVERSITY OF LEEDS Institute for Transport Studies, University of Leeds, Leeds, UK
Introduction
Proposed Methodology
Background
Predicted Results
References
The Aim and Objectives
Visit to the Study Area
Related Literature
Review
Survey
Design
Indicator
Identification
Questionnaire Delivery
to the Control and
Experiment Group
GIS and
Census data
Comments on
the Plan
Data
Collection
Data Analysis
Result Report and
Conclusions
The Coverage and Scope
Data Category
ITS
In order to encourage the new house occupier to utilise public transport from the very start, the Residential MetroCard (RMC) Scheme first launched in 2006 is a joint initiative between Metro, West
Yorkshire bus and rail operators. If a RMC agreement is in place, the new house occupier can enjoy:
• One RMC for each household.
• Totally free buses and trains in West Yorkshire for the first year, 25% discount in the second year and 10% discount in the third year.
• Property developers pay the balance for each household.
A major problem facing West Yorkshire today is the increasing
car use and decreasing public transport use, especially the bus.
Based on 2010 census data, in West Yorkshire:
• 32% of households have no car, 43% have one car and 20%
two or more cars.
• The bus patronage has been decreasing, a 5.5% decrease in
2010.
• Mode share: 56.1% car, 22.2% bus, train 16%, 4.2% walk,
1.6% cycle.
As a short term incentive (just 3 years), the RMC scheme is
expected to influence the travel habit of new house owners in
the long term, attracting them out of cars and taking public
transport as a preference.
A survey will be conducted among the targeted population.
• Focus on all journey types.
• Focus on households not individuals.
• The target experiment population is the new house occupiers
with a provision of RMC scheme in West Yorkshire.
• The target control population will be the new house occupiers
without a RMC scheme provision.
A point to point comparison will be applied to analyse the
collected data, mainly involving data:
• Household basic information
• RMC use
• Car use
• Public transport accessibility and quality
The aim of the topic is to:
• Study the impacts of the RMC plan on travel behaviour
change in the target households.
The objectives:
• Identity factors that affect residents mode choice.
• To identify whether the scheme has helped the property
developers mitigate traffic generation from new home
buyers in the short and long term perspective.
The predicted outcomes should be:
• Residents in the experiment group should have a higher
use of public transport, especially in the first year, and may
decrease in the following 2 years.
• RMC should restrain the car increase at least in the first 3
years.
• Residents’ awareness in the experiment area on public
transport use will be improved in the long term.
• Off-peak travels may have a higher use of public transport.
• Good degree of satisfaction from new residents.
• Thøgersen, J. and Møller, B. 2008. Breaking car use habits: The
effectiveness of a free one-month travelcard. Transportation. 35(3),
pp.329-345.
• Bonsall P. Do we know whether personal travel planning really
works?[J]. Transport Policy, 2009, 16(6): 306-314.
• Chatterjee K. A comparative evaluation of large-scale personal travel
planning projects in England[J]. Transport Policy, 2009, 16(6): 293-
305.
• Möser G, Bamberg S. The effectiveness of soft transport policy
measures: A critical assessment and meta-analysis of empirical
evidence[J]. Journal of Environmental Psychology, 2008, 28(1): 10-26](https://image.slidesharecdn.com/allmastersposters2014-15-150506105803-conversion-gate01/85/Masters-Dissertation-Posters-2015-38-320.jpg)
![Hypothesis 1: As house prices increase, the house price uplift
per minute of time saving from public transport decreases.
Background and Proposal
• High congestion on the A660 corridor
• Tram proposal scrapped in 2005 due to escalating costs
• Trolleybus proposed as cheaper alternative at £250 million to run
between Holt Park in the north-west to Stourton in the south-east
• Electrically powered by overhead cables
• 65% route segregation, Peak frequency of 10 services per hour
• Due to open in 2020 if approved by government
Current Literature
• Travel time is main transport characteristic reflected on house prices
• Current hedonic pricing methods only give overall percentage change
in house prices
• Steer Davies Greave (2013) used a linear model from Volaterra (2008)
to predict house price changes from the Leeds trolleybus, though the
model is only a good fit to actual house prices up to about £150,000,
after which the model overestimates house prices
• Du and Mulley (2012) found areas were affected differently in the Tyne
and Wear region from changes in public transport accessibility, by use
of geographically weighted regression. Larger percentage changes in
house prices per change in accessibility occurred in poorer areas
compared to richer areas
Value this work will add to the subject area
• Provide clear evidence of house price uplift deviating from a
uniform uplift when certain characteristics are strong
• Provide solid grounding for further research into different
house price uplift from transport investment
Hypothesis 2: As car ownership increases, the house price uplift
per minute of time saving from public transport decreases.
Map of Local parameter estimates of house prices in Tyne and
Wear, associated with Public Transport Accessibility
Methodology
• Using past investments in transport infrastructure to
assess the property price changes caused by changes in
travel time
• Use Arc GIS Geographically Weighted Regression to
identify house price changes per travel time saving
• Use of colour coded maps to compare areas differing in
car ownership and previous property prices
• Further regression analysis used to identify the extent
car ownership and previous property prices are
responsible for changes in house price uplift per travel
time saving
• Use of actual house prices from the UK Land Registry
• Past UK tram investments used including Manchester
Metrolink, Nottingham tram and Edinburgh tram
• Non UK trolleybuses not considered due to ridership
differences between Europe and the rest of the world,
(Currie and Delbosc, 2013), modal split differences
between the UK and Europe, except Germany (European
commission, 2012, p.47), different paced housing
markets in the UK and Germany (Hilbers et al, 2008)
Modelled House Prices Against Actual House Prices
References
• Carey-Campbell, C. 2013. A Presentation to Leeds City Council on Wednesday 8th May Regarding the Proposal NGT Trolleybus Scheme. North Leeds life. [Online]. 9 May. [Accessed
22 April 2015]. Available from: http://www.northleedslifegroup.com/
• Currie, G. and Delbosc, A. 2013. Exploring Comparative Ridership Drivers of Bus Rapid Transit and Light Rail Transit Routes. Journal of Public Transportation [Online]. 16 (2), pp.47–
65. Available from: www.researchgate.net
• Du, H. and Mulley, C. 2012. Understanding spatial variations in the impact of accessibility on land value using geographically weighted regression. Journal of Transport and Land
Use [Online]. 5 (2), pp.46-59. Available from: https://www.jtlu.org/
• European Commission. 2012. EU Transport in Figures: Statistical Pocketbook 2012. [Online]. Luxembourg City, Luxembourg: European Union. [Accessed 16 April 2015]. Available
from: http://ec.europa.eu/
• Hilbers, P. Hoffmaister, A. Banerji, A. and Shi, H. 2008. House Price Developments in Europe: A Comparison. [Online]. Washington D.C., USA: International Monetary Fund.
[Accessed 16 April 2015]. Available from: https://www.imf.org/
• New Generation Transport (NGT). No Date. New Generation Transport’s Website. [Online]. [Accessed 14 April 2015]. Available from: http://www.ngtmetro.com/
• Office of National Statistics (ONS). 2011a. 2001 vs 2011 Census – Car Ownership. [Online]. [Accessed 14 April 2015]. Available from: http://www.ons.gov.uk/
• Steer Davies Gleave. 2013. New Generation Transport for Leeds: Improving Connectivity, Adding Value. [Online]. Leeds, United Kingdom: New Generation Transport (NGT).
[Accessed 15 April 2015]. Available from: www.ngtmetro.com/
(NGT, No Date)
(Carey-Campbell, 2013)](https://image.slidesharecdn.com/allmastersposters2014-15-150506105803-conversion-gate01/85/Masters-Dissertation-Posters-2015-40-320.jpg)
![ANALYSING THE RELATION BETWEEN PUBLIC TRANSPORT AND SOCIAL EXCLUSION
IN INNER-CITY AND SUBURBS OF BUENOS AIRES
LUCILA CAPELLI - TS14LC@LEEDS.AC.UK
SUPERVISORS: JEFF TURNER & FRANCES HODGSON
1. JUSTIFICATION & BACKGROUND
-In the Metropolitan Area of Buenos Aires (MABA) there are almost
340,000 of households with unsatisfied needs (INDEC, 2010).
-There is a broad consensus around the idea that problems with transport
provision can reinforce social exclusion and that public transport plays a
key role in guarantee access to employment, rights and goods (Social
Exclusion Unit, 2003, Lucas, 2004, Hine and Mitchell, 2003, Church et al., 2000 & Farbiarz
Castro, 2013).
-There is a lack of data and analysis regarding public transport access in
deprived areas of Buenos Aires.
2. MAIN OBJECTIVE
Determine the existing disparity of public transport system in the MABA
and its relation with social exclusion.
3. RESEARCH QUESTIONS
4. METHODOLOGY
-Mapping primary data sources (especially National Census of 2010) and
transport supply using GIS (unit of analysis: census radius)
-Calculation of indexes, following Farbiarz Castro (2013):
-Analysis of particular results in case study areas, including relation with
planning projects.
Weaknesses: it is not a forecast demand study. Some data is not publically
available. Lack of official data about travel behaviour and accessibility.
Strengths: it will give a cross-sectional account of the relation between
socio-economical profile of households, transport provision and impact on
BRT and planning projects.
5. CASE STUDY AND SPECIFIC AREAS OF ANALYSIS
-Currently, the MABA has almost 13,000,000 inhabitants. MABA includes
Buenos Aires City district and 24 municipalities of Buenos Aires Province as
it is shown in Figure I.
-While population in Buenos Aires City has not grown in the last 50 years,
in the suburbs from 1947 to 2010 the population has increased six times
(from 1,730,511 to 9,916,715 inhabitants).
Case study 1: La Matanza municipality is located in Buenos Aires Province
and it is the most populated of the suburbs of MABA. Also, it presents the
biggest intercensal population variation (41.8%). Figure II shows deprived
households, existing transport infrastructure and projected BRT.
Case Study 2: The “Villa 21-24” is a slum in the south of Buenos Aires City.
Although the population is not increasing in the city, it grew a 52.6% in
slums (48% in the Villa 21-24). It is close to the Business Central District of
MABA and important transport infrastructures (See Figure III).
6. INDICATIVE RESULTS
-Preliminary analysis indicates much lees public transport provision in
areas with higher levels/proportions of deprived households.
-Urbanisation increasing very quickly but no evidence that public transport
provision is keeping pace.
-Most households are in the south of the MABA.
-There is a lack of transport provision in the suburbs, especially in affecting
case study areas. Poor interurban train service in most of the MABA
corridors.
-Lack of metropolitan view: MABA has not a unified transport authority.
Policy decisions are not made after a planning process. There is not a land
use´s MABA policy, and less and integration between urban development
and transport.
7.REFERENCES
CHURCH, A., FROST, M. & SULLIVAN, K. 2000. Transport and social exclusion in London. Transport Policy, 7, 195-205.
GREAT BRITAIN. SOCIAL EXCLUSION UNIT 2003. Making the connections Final report on transport and social exclusion: summary.
HINE, J. & MITCHELL, F. 2003. Transport disadvantage and social exclusion. London, Aschgate.
LUCAS, K. 2004. Running on empty. Transport, social exclusion and environmental justice. Bristol.
FARBIARZ CASTRO, V. 2013. Measuring the disparity in Bogotá's public transport system. University of Leeds.
BOCAREJO S., J. O. H., D.R. 2012. Transport accessibility and social inequities: a tool for identification of mobility needs and evaluation of transport investments. Journal of Transport
Geography, 24, 142-154.
CARRUTHERS, R. D., M; SAURKAR, A. 2005. Affordability of Public Transport in Developing Countries. In: GROUP, T. W. B. (ed.) Transport Papers.
CURRIE, G. 2004. Gap analysis of public transport needs. Measuring spatial distribution of public transport needs and identifying gaps in the quality of public transport provision.
Transportation Research Record. The Journal of the Transportation Research Board, 1895, 137-146.
CURRIE, G. 2010. Quantifying spatial gaps in public transport supply based on social needs. Journal of Transport Geography, 18, 31-41.
DEPARTMEN OF TRANSPORT 2006. Accessibility Planning Guidance. In: DFT (ed.) Guidance
INDEC 2010. Censo Nacional de Hogares y Población 2010.
SECRETARÍA DE TRANSPORTE 2007. Investigación de Transporte Urbano Público de Buenos Aires (INTRUPUBA). In: NACIÓN, S. D. T. D. L. (ed.).
BUENOS AIRES CITY GOVERNMENT. 2015. Buenos Aires Data [Online]. Buenos Aires City Government. Available: http://data.buenosaires.gob.ar/dataset [Accessed 10/04/2015 2015].
IGN. 2015. Base de datos geografica [Online]. Instituto Geografico Nacional. Available: http://www.ign.gob.ar/sig [Accessed 10/04/2015 2015].
Figure I. Percentage of deprived households per census radio with interurban rail, metro
and BRT infrastructure of MABA.
Source: map prepared by author in base of INDEC (2010); Buenos Aires City Government (2015) and IGM (2015)
Figure III. (a) Map of Case study 2 (“Villa 21-24”) with % of deprived households, transport
infrastructure and planned projects. (b) Google Earth view of neighbourhood
Figure II. (a) Map of Case study 1 (“La Matanza” municipality)
Source: prepared by author in base of INDEC (2010); Buenos Aires City Government (2015) and IGM (2015)
Source: prepared by author in base of INDEC (2010); Buenos Aires City Government (2015) and IGM (2015)
b.a.](https://image.slidesharecdn.com/allmastersposters2014-15-150506105803-conversion-gate01/85/Masters-Dissertation-Posters-2015-44-320.jpg)
![While they have the potential to solve the problems inherent to conventional drainage
systems, the application of permeable pavements on heavily-trafficked roads poses a
number of challenges.
• The lower structural bearing capacity of the permeable pavement means difficulty handling
the high loads of traffic (MAPC, 2010).
• Loose pavement material as well as brake and tyre dust could accumulate in a way that clogs
the pavement pores (Hunt, 2011).
Conventional Asphalt Pavement Permeable Asphalt Pavement
Images adapted from Marshalls, 2015.
One way is to stabilise the permeable pavement layers with cement or other material.
Stabilisation Permeability Bearing Capacity Layer Depth Cost
•Water is the number one enemy of bituminous
pavements. The reason behind this is the fact that
water infiltrating the pavement layer, mixed with
oxygen, could form reactions that make the bitumen
binder brittle, causing it to strip away and destroy the
pavement (Lambert Bros., 2005).
•Another cause for concern when it comes to water
damage is infiltration into the lower layers of the
pavement, where water may cause structural failure
in expansive soils that are prone to swelling (Elarabi,
2010).
•Traditional design of highway pavements revolve
around the idea of keeping water out (DMRB, 2013),
requiring impermeable pavement binding materials,
such as bitumen, as well as cross-sloping roadways
and gullies and gutters to drain all the water from the
pavement.
• Conventional water drainage systems are not only
expensive to maintain, but recent research shows they
pose environmental threats in that running water
across pavement surfaces carry with them pollutants
and biological contaminants that end up in our rivers
and waterways, poisoning marine life, wildlife as
well as us (Davis and Masten, 2003).
•Permeable pavements allow for the infiltration of
water through the pavement into the subgrade soil
without the need to generate runoff.
1. Davis, M. and Masten, S. 2004. Principles of environmental engineering and science. New
York, NY: McGraw-Hill.
2. Department for Transport. 2013. Design Manual for Roads and Bridges.Volume 4:
Geotechnics and Drainage, Section 2: Drainage. London: Department for Transport.
3. Elarabi, H. 2010. Damage mechanism of expansive soils. Khartoum: University of Khartoum.
• Define and identify the problems underlying the use of
permeable pavements on high traffic roads.
• Address the underlying problems in a way that
optimises performance and costs to ensure an effective
and improved design.
BACKGROUND OBJECTIVES
METHODOLOGY
PERMEABLE PAVEMENTS
APPLICATION OF PERMEABLE PAVEMENTS IN HEAVILY-TRAFFICKED ROADS
Isam Bitar, MSc Transport Planning and Engineering
Institute for Transport Studies. Supervised by Mr David Rockliff
Asphalt Layer
Well-graded
Base
Permeable Asphalt Layer
Open-graded
Base
Well-graded
Sub-base
Subgrade
Open-graded
Sub-base
Literature
Review
Identifying
Problems
Underlying
Reasons
PerformanceCost
Other
Factors
Solutions
Based on
Literature
Own
Suggestions
REFERENCES
4. Hunt, W. 2015. Maintaining Permeable Pavements. [Online]. Raleigh, NC: North Carolina
Cooperative Extension. Available from:
http://www.bae.ncsu.edu/stormwater/PublicationFiles/PermPaveMaintenance2011.pdf
5. Lambert Bros. Paving. 2005. Facts about asphalt pavement. Lambertpaving.com [Online].
Available from: http://www.lambertpaving.com/articles.htm#1
6. Marshalls Garden Paving and Driveways, 2015. Drivesett Argent Priora Permeable Block Paving. Marshalls.co.uk. [Online].
Available from: http://www.marshalls.co.uk/homeowners/view-drivesett-argent-priora-permeable-block-paving
7. Metropolitan Area Planning Council (MAPC), 2010. Factsheet # 6: Permeable Paving [Online]. Massachusetts: Metropolitan
Area Planning Council. Available from: http://www.mapc.org/sites/default/files/LID_Fact_Sheet_-_Permeable_Paving.pdf
All links last retrieved 25 April 2015](https://image.slidesharecdn.com/allmastersposters2014-15-150506105803-conversion-gate01/85/Masters-Dissertation-Posters-2015-52-320.jpg)
![GIS Based Accessibility Study of Lancashire
Muhammed Farhad Rahman | Student no. 200750535 | University of Leeds | 01 May 2015
Background
• Accessibility is the ‘extent to which individuals and households can access
day to day services, such as employment, education, healthcare, food
stores and town centres’ (DfT, 2012. P2)
• Without suitable access to opportunities an individual’s economic and
social welfare can be limited leading to social exclusion
Study area
• Population of over 1.4 million (census 2011)
• Estimated economic value £23 billion per annum (LEP,
2014. P7)
• Contains areas within the 10% most and least deprived in
the country
• 80% is classified as rural and 79% of the population live in
urban areas (LCC, 2014)
The number of opportunities at an LSOA* level within specified time
thresholds based on weekday journey times by public transport with an arrival
time by 09.00 *DEFINITION A super output area was ‘designed to improve the
reporting of small area statistics’ (ONS n.d.), of which a LSOA is the smallest
output area.
Objectives
• Understand the role of accessibility within local government and the
limitation of LTP2
• Clearly define measurable and non measurable barriers to accessibility
across different domains
• Quantify origin accessibility within the study area by undertaking a strategic
mapping exercise and make policy recommendations based on results
Local Transport Plan 2 (LTP2)
Methodology
Limitations
• Accessibility is multi‐faceted; a single
accessibility score does not reflect this
• Transport ‐ does not factor in car
ownership
• Land use ‐ limits users to public transport
despite opportunities being accessible
via walking or cycling resulting in an
inappropriate land use measure
• Socioeconomic ‐ does not take into
consider 'deprived' individuals may lack
the resource to access public transport in
terms of finance or limited mobility as a
result of health problems or limited
travel horizon
• Arc View GIS will be used as it is a powerful mapping analysis tool enabling
data to be inputted at the required geographical scale (LSOA level)
• Accessibility is separated into domains enabling in‐depth analysis through
individual domain scores [please note each domain produces average scores
at an LSOA level and does not reflect an individual’s circumstance]
Transport – the availability of transport
• Car ownership (census 2011) – calculate the
proportion of homes that have at least 1 car or
van
• Availability of peak time high frequency bus
(at least 6 buses an hour) – acceptable walking
distance 400m to bus stop
Land use – the number of opportunities within
time threshold
• Use LTP2 time thresholds to calculate the
number of opportunities within an LSOA using
any mode of travel other than a car or van
Socioeconomic – interaction of social and
economic factors
• Index of multiple deprivation (IMD) score will
be used as an indicator
• IMD provides ‘a relative measure of
deprivation at small area level across England’
(Department for communities and local
government. n.d.).
• ‘Income effects and other indices of social
disadvantage have a significant influence on
travel behaviours' (Lucas K, et .al. n.d. P14)
Accessibility score – overall accessibility ranking
• Measure of the transport, land use and socioeconomic domains combined
• A relative measure of accessibility is produced i.e. a score of 80 is not twice
as accessible as 40
• An LSOA can be characterised as highly accessible relative to other areas,
however, individuals within the LSOA may still face accessibility issues
Example of preliminary results
Policy recommendation
A low transport score means….
• Increase bus frequency if appropriate
• Enable community transport if applicable
• Encourage car sharing
Analysis
• Despite 005C being classified as rural, at
a LSOA level it is deemed more accessible
than 007C with accessibility scores of
179.44 and 176.25 respectively
• 005C – with a land use score of 14.3, the
physical separation of opportunities is
the main factor limiting accessibility
• 007C – with a socioeconomic score of
19.92, deprivation is the main factor
limiting accessibility
Project limitation
Following domains are not included
A low land use score means….
• Increase mixed use developments
• Increase density of opportunities through the planning process and
planning policies (e.g. local plan)
CAUTION increasing density in the urban fringe 'can spoil the amenities that
urban fringe resident's desire' (Litman T, 2015. P26).
A low socioeconomic score means....
• Make travel more affordable if applicable
• Increase travel horizon (linked with education, health, living conditions
etc.) – further study necessary
Information
• A lack of information has a direct link on an individual’s travel mode and
ability to travel
• People ‘tend to avoid modes where they feel they do not have good
enough route knowledge' (TfL, 2009. P15).
• Difficult to measure how much information is needed for a location to be
accessible
Perception
• Perception is 'the way in which something is regarded, understood or
interpreted’ (Oxford dictionary).
• Our perception of a journey may limit our travel horizon
• Requires large data collection exercise – very costly
References
Department for communities and local government n.d. English Indices of Deprivation 2010 http://data.gov.uk/dataset/index‐of‐multiple‐deprivation date
accessed 21.04.15
Department for Transport (DfT). Accessibility statistics guidance V1.2. July 2012. P2
Geograph. Photograph every grid square. Portland Street Accrington. http://www.geograph.org.uk/photo/2311769
Lancashire County Council (LCC). Local Transport Plan 2 (LTP2), 2006. P355
Lancashire County Council (LCC).Rural urban definition for small area geographies. 2014
http://www3.lancashire.gov.uk/corporate/web/?siteid=6116&pageid=43246&e=e date accessed 21.04.15
Lancashire Enterprise Partnership (LEP). A Gorwth Deal for the Arc of Prosperity March 2014. P7
Office of National Statistics (ONS). Super Output Area (SOA). n.d. http://www.ons.gov.uk/ons/guide‐method/geography/beginner‐s‐guide/census/super‐
output‐areas‐‐soas‐/index.html date accessed 21.04.15
Litman T, Evaluating accessibility for transportation planning. Measuring people’s ability to reach desired goods and activities. Victoria Transport Institute.
January 2015. P26
Lucas K, Bates J, Moore J, Carrasco J & Antonio J. Modelling the relationship between travel behaviours and social disadvantage. n.d. P14
Morris K. Research into travel horizons and its subsequent influence on accessibility planning and demand responsive transport strategies in Greater
Manchester. Halcrow Group Limited 2006. P1
Oxford dictionary http://www.oxforddictionaries.com/definition/english/perception date accessed 21.04.15
The Marmot Review, Fair Society, Healthy Lives. Strategic Review of Health Inequalities (2010). P134
Transport for London (TfL) Older people’s experience of travelling in London. Mayor of London. 2009. P15
Risks
• Results are only as reliable as the data inputted
• Accessibility scores produced are an average of the LSOA and is not a
reflection on whether individuals face accessibility issues
0
10
20
30
40
50
60
70
80
90
100
LSOA domain scoring
Ribble Valley 005C Burnley 007C
Source: LCC, 2006. P355
LTP2: Accessibility mapping exercise
Burnley bus station
Portland Street,
Accrington
Source: Geograph
Policies
• Lancashire Highways and Transport Masterplans have stated a need for an
accessibility study
• The Marmot Review states ‘fully integrate the planning, transport, housing,
environmental and health systems to address social determinants of health
in each locality’ (The Marmot Review, 2010, P134)
Recommendation will vary depending on
domain score, geography and individual
circumstance
0
20
40
60
80
100
Car ownership Access to high
frequency bus
Transport domain
Ribble Valley 005C Burnley 007C](https://image.slidesharecdn.com/allmastersposters2014-15-150506105803-conversion-gate01/85/Masters-Dissertation-Posters-2015-55-320.jpg)
![ For normalization, Z score= (Raw Score of each MSOA- Mean Raw
Score of whole District)/Standard deviation of Raw Score of Whole
District
WI= (2*CI) +(HDI +FARI)+ EntI + EF +PI
GIS Model Builder:
1. BACKGROUND AND SCOPE
To select indices for calculating a walkability index
from existing literatures
To test the applicability of this index in two case
study areas of UK (Leeds and York)
To make recommendations for more general
application of the method in UK and other places
Scope: This study will help to see the applicability
of such method in other cities of UK from the
comparative analysis of the cities. Spatial
aggregation is also possible, but not in scope of this
study.
Walkability defines the extent to which the built environment is walking friendly. The
role of built environment is utmost important in this case (NZ Transport Agency, 2009).
Creating walkability index is such a method where indices can be developed both
subjectively (Walkonomics.com, Walkscore.com) and objectively (GIS) to define the
relationship (Leslie et al., 2007; Cervero, R., 2005; Agampatian, R. 2014).
PERS is a qualitative walking audit tool but for route based system (TRL, 2009). IPEN
developed a method where four partial indices were created which then combined to
get a final composite (area wide) score (Dobesova, Z. and Krivka, T. 2012). This method is
widely used in North American cities but there are very few applications in UK .
Considering all the above situation, this study intends to create a walkability index
from the publicly available GIS data for the cities of UK.
An Automatically Generated Area Wide Walkability Index For UK Cities Based On Existing GIS Data
4. METHODOLOGY
3. STUDY AREA AND DATA SOURCE
Step 1: Calculating 5 partial/raw parameter indices
1. Connectivity index:
Directness of the
pathway between
households, shops and
places of employment
CI = Number of
intersections of roads/
square km of urban
units
5. Proximity
Describes number and
variety of destinations
within a specified distance
(buffer) of any location.
Creating points of interest
destinations (eg. Parks).
Creating buffers (< 1 km)
Weighting these buffer
layers based on importance
4. Environmental
friendliness:
Important for Comfort;
Cleanliness and Safety.
EF = sidewalk coverage
in m2/street-roadbed
coverage in m2
2. Density:
Household density:
HDI = No. of HHs/ sq km
residential area.
Commercial Density:
FARI = area of CBs/area
of CLs
Middle Layer Super Output Area (MSOA):
minimum 5,000 population (an average of 7,700)
and 2,000 households (an average of 3,200)of
Leeds and York (National Statistics, 2011).
Data sources:
1. Edina Digimap website (digimap.edina.ac.uk)
2. National Statistics website (ons.gov.uk)
3. UK data service: census support website
(census.ukdataservice.ac.uk)
4. OpenStreet Map website (openstreetmap.org)
5. Google Earth (earth.google.com)
A map showing which areas
are walking friendly and
which are not, based on WI.
Will help to understand the
walking condition of UK
based on the physical
environment.
Will help decision makers to
take proper interventions
regarding investment on the
pedestrian facilities.
5. INTENDED RESULTS
2. OBJECTIVES AND SCOPE
6. LIMITATIONS 7. REFERENCES
Agampatian, R. 2014. Using GIS to measure walkability: A Case study in New York City. Unpublished Thesis Report.
[Online]. [Accessed on 30 January, 2015]. [Available at http://www.diva-
portal.se/smash/get/diva2:715646/FULLTEXT01.pdf]
Cervero, R., 2005. Accessible Cities and Regions: A Framework for Sustainable Transport and Urbanism in the 21st Century.
UC Berkeley Center for Future Urban Transport: A Volvo Center of Excellence. Institute of Transportation
Studies (UCB), UC Berkeley. [Online]. [Accessed on 30 January, 2015]/. [Available at:
http://escholarship.org/uc/item/27g2q0cx]
Dobesova, Z. and Krivka, T. 2012. Walkability Index in the Urban Planning: A Case Study in Olomouc City. Advances in
Spatial Planning. Dr Jaroslav Burian (Ed.). ISBN: 978-953-51-0377-6.
Leslie, E., Coffee, N., Frank, L., Owen, N., Baumane, A. and Hugo. G., 2007. Walkability of local communities: Using
geographic information systems to objectively assess relevant environmental attributes. Health & Place. (13) pp: 111–122.
NZ Transport Agency, 2009. Pedestrian planning and design guide. [Online]. [Accessed on 24 January, 2015]. Available
at http://www.nzta.govt.nz/resources/pedestrian-planning-guide/docs/pedestrian-planning-guide.pdf
TRL, 2009. Pedestrian Environment Review Software. [Online]. [Accessed on 24 January 2015]. Available at
https://trlsoftware.co.uk/products/street_auditing/pers
Step 2: Final Walkability Index:
The current GIS database are not readily
available and incomplete. The missing gaps will
be filled in manually by the researcher from
Google Earth source.
Some of the parameters cannot be incorporated
for unavailability of recent data like: traffic flow,
speed etc.
This study is based on objectively measurable
data. Subjective data (such as people perception
about walkability) is not considered.
FARZANA KHATUN (Student No: 200890976), MSc Transport Planning and the Environment- May 2015
Supervisor: Dr ASTRID GÜHNEMANN, Senior Lecturer, ITS, University of Leeds
MSOA boundaries: Leeds
MSOA boundaries: York
Weighted
Overlay
Connectivity
Index
Density
Index
Diversity
Index
Environmental
Friendliness
Index
Household
Density
Commercial
Density
Walkability
Index
Proximity
Index
INSTITUTE FOR TRANSPORT STUDIES
3. Diversity:
Spatial arrangement of
landuse
𝐸𝑛𝑡𝐼 =
− [(𝑃 𝑖
𝑘
𝑖=1 ) .(𝑙𝑛𝑃 𝑖 )]
𝑙𝑛𝑘
k is the category of land
use;
p is the proportion of
the land area devoted
to a specific land use;
N is the number of land
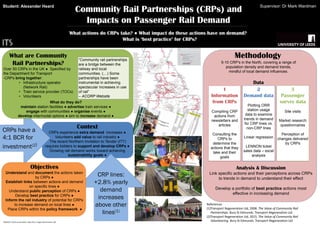
use](https://image.slidesharecdn.com/allmastersposters2014-15-150506105803-conversion-gate01/85/Masters-Dissertation-Posters-2015-56-320.jpg)
![RESEARCH POSTER PRESENTATION DESIGN © 2012
www.PosterPresentations.com
•To review traffic micro‐simulation studies of scramble
intersections
•Assess the performance of the Scramble junction option in
comparison with the current signalised junction under various
traffic flows and pedestrian demand conditions.
•Suggest general guidelines criteria for Scramble junctions micro
simulations.
The concept of scramble intersection was introduced in Vancouver
and Kansas City in the 1940s then in Denver in the 1950s.
Japan has over three hundred of scramble junctions, this includes
the world’s heavily pedestrian scramble, at Hachiko Square,
Shibuya , Tokyo.
In UK, Balham crossing was introduced first in 2005 then the
Oxford Circus in 2009.
However, in UK, little guidance is given by the DfT on determining
whether diagonal crossing should be used as opposed to more
traditional layout (Greenwood, 2012).
Introduction
The Objectives
Example: Oxford Circus
Methodology
Legion for Aimsun model
Case Study Area
This research is carried out at the junction along A660 Otley Road
and B6157 in Headingley. The study intersection is located at the
core of the Headingley area which has high percentage of student
accommodation, bars, shops and the venue for Leeds Rhinos RLFC
and Leeds Carnegie. It is along the busy A660 road which connects
Leeds City and northern areas. This junction carries high local
vehicle and pedestrian traffic. Figure 1 shows the Google picture of
the proposed junction.
References
Google Maps. 2015. A660/B6157 junction [Online]. [Accessed 14 April 2015]. Available from:
www.google.co.uk/maps/@53.821135,‐
1.577556,3a,75y,340.05h,70.01t/data=!3m4!1e1!3m2!1sbnxcuBjzgwMYwZDIZddxjg!2e0
Greenwood, C 2012. Image of Oxford Circus scheme. [Online]. [Accessed 14 April 2015]. Available from:
http://www.atkinsglobal.com/~/media/Files/A/Atkins‐Global/Attachments/sectors/roads/library‐docs/technical‐
journal‐4/scrambled‐pedestrian‐crossings‐at‐signal‐controlled‐junctions‐a‐case‐study.pdf
Bradshaw, A. 2015. Proposed food store modelling . [Online]. [Accessed on 14 April 2015]. Available from: http://www.its‐
ukreview.org/a‐model‐approach‐to‐transport‐assessment/
Leeds City Council. 2014. Personal injury accidents in Leeds: Sites for concern.[Online].[Accessed on 26 April 2015].
Available from: http://www.leeds.gov.uk/docs/Sites%20for%20concern%202014.pdf
HCM.2000. Transportation research board. National Research Council, Washington, DC.
Supervisor: Dr James Tate; 2nd Reader : Hamish Jamson
Clifford Zwomuya: MSc (Eng) Transport Planning and Engineering
Assessing the performance of a Scramble intersection using microscopic traffic and
pedestrian simulation tools
Figure 2: View of Oxford Circus (Source: Greenwood)
Figure 1: Option junction (Source: Google Maps)
Geometric Representation
•Global parameters
•Local parameters
•DXF file from GIS
•Traffic parameters
•Traffic signals
The Model
Scenario 1:
Signalised Option
Scenario 2:
Scramble Option
Comparison
•Junction performance
•Safety level
Best Scenario
Table 1: Level of Service (LoS) criteria (Source: HCM 2000)
Figure 3: Legion for Aimsun model (source: Bradshaw)
Model coding
Configuration
Estimation of Origin‐
Destination Matrix
Traffic flows
•Pedestrian counts
•Pedestrian crossing locations
•Side walk characteristics
Data Input
Model Calibration
and Quality control
Pedestrian and
Traffic Modelling
GEH Analysis:
Comparison with the DfT
Base Model Formulation
1. Literature Review
Reviewing and determination of relevant literature
2. Data Collection and Preparation
Relevant data, cleaning and organising data
3. Data Analysis
Use of LEGION of AIMSUN
4. Interpretation of Results
Evaluating the relevancy of results
AIMSUN: Calibrated and Validated for 2014 demand levels
Veh travel speed LoS on urban roads
Pedestrian LoS criteria for signalised
delay
LoS 30 mph LoS Delay (s)
Likelihood of ped
noncompliance
A >25
Motorists driving at
desired speed
A <10
Low
B 19 ‐ 25 Desired speed significant B 10 ‐ 20
C 13 ‐ 25
Flows stable but
susceptible to congestion
C 20 ‐ 30
Moderate
D 9 ‐ 13 Unstable traffic flows D 30 ‐ 40
E 7 ‐ 9
Unstable and difficult to
predict
E 40 ‐ 60 High
F ≤7 Heavily congested F ≥60 Very high
Year Slight Serious Fatal Total
2009 2 0 0 2
2010 1 1 0 2
2011 2 0 0 2
2012 4 2 0 6
2013 2 1 0 3
Total 11 4 0 15
Table 2: The study area’s accident analysis (Source: Leeds City Council)
Safety: Depends on user compliance to signal indications;
Compliance rests on perceived fairness
The Level of service (LoS): Concerned with the quality of
service provided by the road junction
0
20
40
60
80
100
120
140
160
180
2009 2010 2011 2012 2013
Number of accidents
Year
slight Serious Fatal
Figure 4: Accidents recorded in Leeds](https://image.slidesharecdn.com/allmastersposters2014-15-150506105803-conversion-gate01/85/Masters-Dissertation-Posters-2015-60-320.jpg)
![1.0 Aims and objectives
The research aims to investigate the maintenance of local roads in England,
identifying areas that need the implementation of more efficient and
sustainable policies and practises.
This investigation will follow the Objectives stated below:
I. Identify and assess existing literature on road maintenance regimes,
noting the best practices and policies necessary for efficient and
sustainable delivery of road maintenance.
I. Asses the road maintenance regime employed by the local authorities in
England.
I. Identify the areas that can be improved in the regimes in England and
hence, recommend the most suitable efficient and sustainable practises
and policies to those areas.
2.0 Context and Context Background
2.1 Introduction
• In most countries, an efficient road transport system is seen as a critical
pre‐condition for general economic development (Robinson, Danielson
& Snaith, 1998).
• The Department for Transport and Highways Agency (2014) see the
strategic and local road network as England’s “most highly valued
infrastructure asset” and admit that maintaining it is vital for the
economy and also the social well being of individuals.
• Road user benefits gotten from road improvements include improved
access, comfort, speed and safety. Vehicle operating costs are lowered
as well (Robinson et al, 1998).
• To sustain those benefits, a well planned maintenance programme must
be followed (Robinson et al, 1998).
• Lack of routine and periodic maintenance results in high direct and
indirect costs (Robinson et al, 1998).
• With the current spending cuts (Dft & HA, 2014) by the government and
the inflation of material costs (Dft & HA, 2014), cost‐effective
maintenance regime has to be implemented
3.0 Research Questions
• What are the best practices & policies of successful & effective
road maintenance regimes?
• What maintenance regime is used in England and why?
• How could suitable efficient and sustainable improvements be
made to the regime in use?
2.2 Key Findings on Road Maintenance in England
Fig 1: Estimated value of England’s roads, miles in England’s road network
and maintenance spend 2013/2014 respectively (Dft & HA, 2014).
Fig. 2: Key data on maintenance by local authorities (AIA, 2015)
4.0 Research Methodology
Student Number: 200910126
Poster Board: 7
Course: Msc(Eng) TP & Eng.
344bn 187000 4.2bn
6.0 Data and risks
• Data sources so far: Government documents, documents from
international organizations, textbooks, ALARM survey.
• Other data sources include National transport survey, data from
local authorities.
• The risks in conducting this research include:
I. Lack of response.
II. Accidents when travelling.
III. Lack of relevant data.
Write up the findings from the researchWrite up the findings from the research
Present final results Present final results
Analyze collected dataAnalyze collected data
Conduct interviews/Collect relevant secondary dataConduct interviews/Collect relevant secondary data
Review relevant literatureReview relevant literature
Establish Objectives and research questionsEstablish Objectives and research questions
5.0 Scope of research
This research is to cover road maintenance by the local authorities in
England. The interview will be conducted on 6 – 8 local authorities,
with scope for more local authorities of possible. Ideally half of the
local authorities interviewed are to have successful maintenance
regime and the other half, unsuccessful ones.
7.0 References
Robinson, R. Danielson, U. & Snaith, M. (1998). Road maintenance management: Concepts and Systems. Basingstoke and
London. Macmillan Press LTD.
Department for Transport and Highways Agency. (2014). Managing strategic infrastructures: Roads (Online). [Accessed on
24/04/15]. Available from http://www.nao.org.uk/wp-content/uploads/2015/06/Maintaining-Strategic-Infrastructure-Roads.pdf
Asphalt industry Alliance. (2015). Annual Local Authority Road Maintenance Survey 2015 (Online). [Accessed on 30/04/15].
Available from http://www.asphaltindustryalliance.com/images/library/files/ALARM%202015/ALARM_survey_2015.pdf](https://image.slidesharecdn.com/allmastersposters2014-15-150506105803-conversion-gate01/85/Masters-Dissertation-Posters-2015-62-320.jpg)
![Cost and Efficiency of
Powertrains Oil Price Changes
UK / EU Emissions Policy
EURO 6 Standard (2015-2020)
Low Emissions Zones
Subsidies
Factors Effecting Change
Anand Mistry – MSc (Eng)Transport Planning and Engineering Student
Background
Changes to EU legislation regarding emissions, and the increasing
affordability and efficiency of modern powertrains is encouraging a rapid
change to the powertrains used in vehicles in the UK.
(Fleetnews, 2013)
(Ecomento, 2014)
(Mercedez-Benz, 2011)
What will the UKVehicle Fleet Look Like in 2020?
Literature:
To be gathered:
• Department for Transport and DEFRA publications
• EU and UK government policies and strategies
affecting next 5 years.
Dissertation Supervisor – Dr JamesTate
Available Powertrains
Conventional Petrol and Diesel
Petrol and Diesel Hybrids:
• Internal Combustion ElectricVehicle (ICEV)
• Hybrid ElectricVehicle (HEV)
• Plug-in Hybrid ElectricVehicle (PHEV) Range
Extended ElectricVehicles (REEV)
Battery ElectricVehicle (BEV)
Hydrogen Fuel Cell ElectricVehicle (FCEV)
Biofuels
Outcomes
Methodology:
1. Analyse existing data, including:
• 24 hour number plate survey in Leeds
• Company car data from SMMT (50% of new sales are company cars)
2. Analyse published trends and literature on:
• Trends of powertrains, vehicle size and weight (from SMMT)
• Impact of economic changes in UK, factors effecting choice of powertrain.
• Examples in other countries.
3. Determine any other required data.
4. Predict different futures based on:
• Oil prices, Government Policy / EU Targets, Different Economic Conditions
Data Sources:
To be retrieved:
• Society of Motor Manufacturers and Traders (SMMT)
Already Gathered:
• Transport for London
• Road Traffic Surveys in Leeds
Objectives
To estimate:
Power Trains ● Air Quality Emissions ● Greenhouse
Gas Emissions
(Tate, 2015)
Proportion of Vehicle Fleet by Euro Standard
References
Ecomento, (2014), Image [Online], Accessed 29th April 2015, Available: http://cdn.ecomento.tv/wp-content/uploads/2014/01/VW-Golf-GTE-Plug-in-Hybrid-740x425.jpg
Fleetnews, (2013), Image [Online], Accessed 29th April 2015, Available: (20https://fncdn.blob.core.windows.net/web/1/root/19147_w268.jpg
Mercedez-Benz, (2011), Image, [Online], Accessed 29th April 2015, Available: http://www2.mercedes-benz.co.uk/content/media_library/unitedkingdom/mpc_unitedkingdom/trucks_refresh_2011/more_about_mercedes-benz/environment/euro-vi/how_can_mercedes-benz.object-Single-MEDIA.tmp/euro-help.jpg
Tate, J, (2015),Vehicles Emissions: Measurement and Analysis Lecture
Traffic Survey Leeds, (2015), Query ANPR Results, [Excel Document from Dr JamesTate], University of Leeds](https://image.slidesharecdn.com/allmastersposters2014-15-150506105803-conversion-gate01/85/Masters-Dissertation-Posters-2015-70-320.jpg)
![1. Background:
• Reliability is a key factor for rail passengers.
• There is a need for an intra-modal reliability
metric for the rail industry.
• This will enable passengers to see the likelihood
of their train arriving at their desired destination
on time.
2. Literature Review:
• The only publically available reliability
information comes from Public Performance
Measure but this is not helpful for passengers.
• There is currently no information for rail
passengers about the reliability of an intra-modal
journey or even a specific journey.
• Reliability is a key factor influencing demand and
passengers have to factor in reliability when
planning journeys (de Jong and Bliemer, 2015).
5. Scope:
• This project will focus on 5 main origin-
destination paths as summarised in table 1.
• An airport was chosen as the destination as
they have the largest reliability elasticities
(Wardman and Batley, 2014).
4. Objectives and aim of this report:
• Objective 1: To develop a reliability metric for
intra-modal trips to Manchester Airport.
• Objective 2: To present the data findings in a
format which is best for rail passengers.
Origin Option Location of first
change
Time for
connection (mins)
Location of second
change
Time for
connection (mins)
Regularity Average journey time
(mins)
Brighouse 1 Huddersfield 10 Manchester Piccadilly 15 Hourly 90-95
2 Huddersfield 25 Hourly 95
3 Manchester Victoria 6 Salford Crescent 8 Hourly 115
4 Mirfield 11 Huddersfield 5 Infrequent 110
Ilkley 1 Leeds 13 Twice an hour 120-150
Mossley
(Manchester)
1 Stalybridge 5 Manchester Piccadilly 13 Hourly 56
Knottingley 1 Leeds 28 Hourly 146
2 Wakefield Kirkgate 5 Meadowhall 7 Hourly 150-160
Cottingley 1 Huddersfield 5 Hourly 105
2 Dewsbury 5 Manchester Piccadilly 6 Evening Peak 95
Measuring reliability for intra-modal rail journeys:
A journey planner approach – Andrew Carson
Data
collection
• Data collected on arrival and departure times from
train services in table 1.
Data
analysis
• Once the data has been collected the number of
intra-modal journeys that arrive at their destination
on time will be calculated.
Data
presentation
• The data will be presented in a similar style to
Table 1. with an additional column of the reliability
of the service.
Data
evaluation
• Once the data has been presented for the first
time it will be shown to members of the public in a
focus group(s).
• As a result of this focus group the presentation
will be developed for a final output which is best
for passengers.
Train at Manchester Airport (Mike Peel, 2009, sourced Wikipedia, 2015)
6. Methodology:
Table 1: Typology of journeys to be studied
Key References:
de Jong, G. and Bliemer, M. (2015) ‘On including travel time reliability of road traffic in appraisal’, Transportation Research Part A: Policy and Practice, 73, pp.80-95
Marsden, G., Shires, J.D. and Wardman, M. (2014) Integrated information for integrated transport – Final report for transport systems catapult’, Institute for Transport Studies, Leeds
Peel, M. (2009) A British Rail Class 323 train at Manchester Airport railway station, sourced; Wikipedia (2015) Manchester Airport Railway Station, [online], available at
http://commons.wikimedia.org/wiki/File:Manchester_Airport_Railway_Station_1.jpg, licensed under CC-BY-SA 4.0
Wardman, M. and Batley, R. (2014) ‘Travel time reliability: a review of late time valuations, elasticities and demand impacts in passenger rail market in Great Britain’, Transportation, 41, pp. 1041-1069
3. Key Aim: To provide simple and clear
information on intra-modal journey
reliability, for rail passengers.
ts14apc@leeds.ac.uk](https://image.slidesharecdn.com/allmastersposters2014-15-150506105803-conversion-gate01/85/Masters-Dissertation-Posters-2015-76-320.jpg)

This document explores the influence of surrounding vehicle behaviors on driver performance and vehicle control, particularly focusing on young drivers aged 17-25 and comparing the effects of lead vehicle types (cars vs HGVs). The study utilizes a driving simulator to investigate various scenarios and aims to establish how aggressive driving behaviors impact following drivers on rural roads. It also emphasizes the significance of public transport access to airports and the impact of high-speed rail on tourism, underlined by various case studies and methodologies.


![02-A Components of Traffic System [Road Users and Vehicles] (Traffic Engineer...](https://cdn.slidesharecdn.com/ss_thumbnails/02acomponentsoftsroadusersvehicles-200412120058-thumbnail.jpg?width=640&height=640&fit=bounds)


