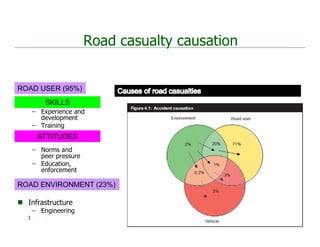
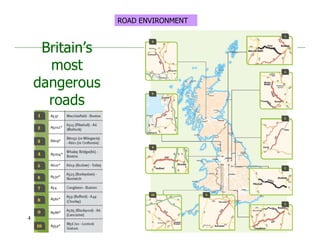
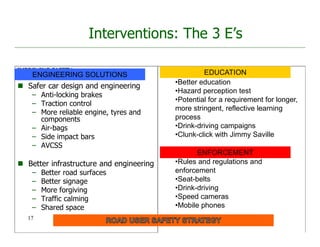
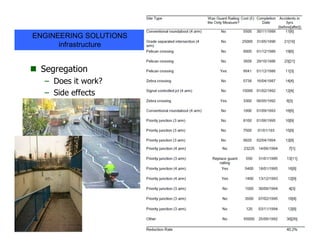
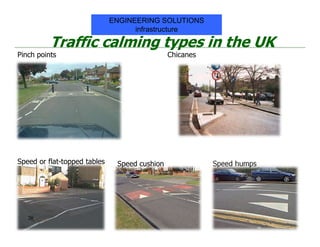
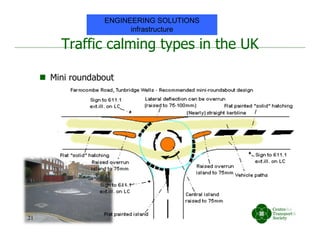
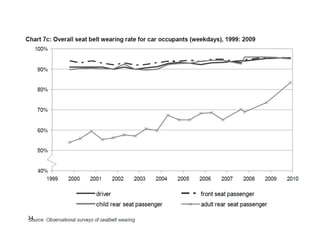
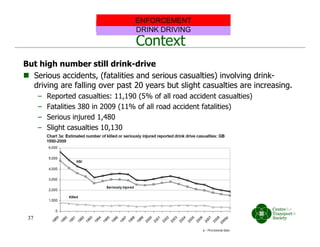
The 3 Es and Road Safety Policy
Developing a road safety audit
Dr Charles Musselwhite
Content
• Reason for accidents
– Road environment
– Skill
– Attitudes
• Interventions for improving road user safety
– Education
– Enforcement
– Engineering
• Policy and Strategies for road user safety
– UK policy
– Vision Zero
• Road safety audit
Road casualty causation
 Skill
– Experience and
development
– Training
 Attitude
– Norms and
peer pressure
– Education,
enforcement
 Infrastructure
– Engineering
ROAD ENVIRONMENT (23%)
ATTITUDES
SKILLS
3
ROAD USER (95%)
Britain’s
most
dangerous
roads
4
ROAD ENVIRONMENT
Worst road. Why?
 A537 through the Peak District,
– known as the Cat and Fiddle,
– had severe bends, steep falls from the carriageway and was edged
by dry-stone walls or rock face for almost all its length.
– Fatal and serious collisions on the route - popular with tourists,
goods vehicles and motorcyclists - rose from 15 in the three years
to 2005 to 34 between 2006 and 2008.
– Single carriageway A road.
– Most crashes happened at weekends during the summer in dry,
daylight conditions.
5
ROAD ENVIRONMENT
Most
improved
roads
6
7
ROAD ENVIRONMENT
Roads and deaths
• 19% of traffic was on motorways, but this accounts for 5% of
casualties
• 38% of deaths occurred on rural A roads with 62% on all rural
roads – but only 40% of the traffic
• Nearly 60% of all casualties occur on urban roads
8
ROAD ENVIRONMENT
Design of streets and
environment
Areas of high road user accidents tend to be characterised by:
• Large open carriage way for vehicles.
• Areas of mixed land-use
• Areas where houses have little or no outside areas for recreation.
• No segregation of heavy volume traffic from pedestrian and other light traffic.
• Housing and streets where pedestrian and other travellers’ safety has not
been considered and were often designed pre-motor-vehicle. Hence greater
on-road parking and narrow pavements increase road user conflict and
increases the potential for accidents (Christie 1995).
• Crossing of main roads to get to services increases road user danger
– it has been found that children from families with the lowest quarter of income
cross 50% more roads than those in families in the highest income quarter
(Judge and Benzeval, 1993; White et al., 2000).
ROAD ENVIRONMENT
9
Skill Deprivation
 Self-reported skill
 Everyone better than the average driver!
– Can this be the case?
 Objective studies suggest
– Poor hazard prediction
– Close focus of gaze
– Inability to multi-task
– High level of concentration on primary order tasks, leaving
little processing for other areas of skill.
• Steering
• Gear changing
SKILLS
10
Novice driver eye gaze and fixation
SKILLS
11
 But does not show why there should be differences
between male and female road users.
 Need to turn to attitudes and other psychosocial variables
12
SKILLS
The public know that driver behaviour is a major contributory
factor in the vast majority of road accidents
(Cauzard, 2003)
but there is a consistent view that others drive in a more risky
manner than individuals themselves do
(King and Parker, 2008)
Not just driving – older children and adolescents think they have
good attitude and skills towards road safety but believe that others
especially those in their peer group do not
(Tolmie. 2006).
Self versus others
ATTITUDES
13
Individuals do not believe they are dangerous on the roads
And
Believe others are a danger on the roads
 I am not likely to be responsible for an accidents, others are likely to be
responsible. Therefore little I can do.
 Hence, less likely to need to “plan to avoid them”
 Campaigns aimed at dangerous driving are for “other” drivers not themselves.
 Such campaigns re-emphasise this difference (2CV, 2008 and Flaming Research, 2008)
 The third-person effect (Davison, 1983).
 High support for enforcement, engineering solutions and education
 But not for themselves - for other people.
Self versus others
ATTITUDES
14
Positive attitudes to the speed limit and dangers of speeding
 90% agree “important that people drive within the speed limit” (British Attitudes
Survey, 2005 in DfT, 2008)
 39% agree it is dangerous to drive over the speed limit at all (Angle et al., 2007)
 76% of drivers completely agree that driving too fast for the conditions is
dangerous (Angle et al., 2007)
 Public support tougher enforcement of speeds especially in residential areas and
surrounding schools (Brake, 2004; Higginson, 2005; Holder n-d; Quimby, 2005)
 77% support 20mph zones (British Attitude Survey, 2007 in DfT, 2008)
 On the whole, the public have good knowledge of the speeding and accident link
(Brake, 2004; Fuller, Bates et al., 2008; Higginson, 2005; Holder n-d; RAC, 2007; Quimby, 2005;)
But drivers continue to drive over the speed limit
 A conservative estimate suggests 49% of drivers continue to drive over the speed
limit in 30mph zones and on motorways (DfT, 2009)
Norms
ATTITUDES
15
Why?
 Driving over the speed limit is not necessarily “speeding”
– Speeding is 1mph over (33%); speeding is 5mph over (33%) (Higginson, 2005)
– 10mph over is normal view for speeding (Corbett, 2001)
 Driving over the speed limit is not necessarily breaking the law
– 94% of drivers consider themselves law abiding (RAC, 2007)
– drivers conceptualisation of law abiding does not involve speeding (Moller, 2004).
– Laws & rules of driving were judged subjectively not simply followed (Christmas, 2007).
 Social comparison/contagion model –
– Other people are doing it, more often and faster than me
– Almost all drivers believe other drivers speed (c.90%) (Holder et al., u/p; SARTRE,
CAuzard, 2003)
– More likely to speed if believe others are speeding (Fuller et al., 2008)
– Other people drive faster than myself (Fuller et al., 2008)
– A view especially held by younger drivers (Yagil, 1998) and faster drivers (Aberg et al.,
1997; Haglund and Aberg, 2005)
OK to drive over the speed limit – it isn’t speeding, it isn’t breaking the
law and others are doing it and are doing it more dangerously than
myself.
Norms
ATTITUDES
16
Interventions: The 3 E’s
IMPROVING SAFETY
ENGINEERING
 Safer car design and engineering
– Anti-locking brakes
– Traction control
– More reliable engine, tyres and
components
– Air-bags
– Side impact bars
– AVCSS
 Better infrastructure and engineering
– Better road surfaces
– Better signage
– More forgiving
– Traffic calming
– Shared space
EDUCATION
•Better education
•Hazard perception test
•Potential for a requirement for longer,
more stringent, reflective learning
process
•Drink-driving campaigns
•Clunk-click with Jimmy Saville
ENFORCEMENT
•Rules and regulations and
enforcement
•Seat-belts
•Drink-driving
•Speed cameras
•Mobile phones
EDUCATION
ENFORCEMENT
ENGINEERING SOLUTIONS
17
Movement and place
Greater emphasis on movement
 1930s: Super segregation proposed
 1950s-1970s: Segregation but hierarchical
 1980/90s: Traffic calming
 Early 2000s: Home Zones
 Mid 2000s: Naked streets
 2007 Manual for Streets
 Late 2000s: Shared Space
 Late 2000s: DIY Streets
 Late 2000s: 20mph zones/areas
 Late 2000s: Link/place proposed
Greater emphasis on place
ENGINEERING SOLUTIONS
infrastructure
 Segregation
– Does it work?
– Side effects
19
ENGINEERING SOLUTIONS
infrastructure
Traffic calming types in the UK
Speed or flat-topped tables Speed humps
ChicanesPinch points
Speed cushion
20
ENGINEERING SOLUTIONS
infrastructure
Traffic calming types in the UK
 Mini roundabout
21
ENGINEERING SOLUTIONS
infrastructure
Traffic calming types in the UK
 Gateway
Narrowings
22
ENGINEERING SOLUTIONS
infrastructure
Traffic calming
 Reduction in speed
– Which speed measure to use
– Fastest speeds?
 Reduction in amount of traffic
– But where to?
 Reduction in accidents
 Though low numbers before and after
 Poorer road positioning
– More difficult to predict driver behaviour
 Increase in delay to emergency vehicles
 Increase in pollution
– Noise
– Vibration
 Poorer bus rides
23
ENGINEERING SOLUTIONS
infrastructure
Shared space
 “Providing less complex and ‘self-explaining’ roads, which have clear signage
and road markings as well as intuitive infrastructure is likely to benefit all road
users, in addition to the older driver” (Box et al., 2010; pg. 43)
Vs.
 Creating a more complex to encourage sharing of space and a levelling of
priorities amongst different users (Engwicht, 1992; Hamiton-Baillie and Jones,
2005).
 This should help reduce speeds of drivers who have to informally negotiate the
space with other road users and the ambiguity of the road scene.
 But we don’t know the tipping point between the two?
– what may create complexity and additional attention amongst a younger driver
may well be very different to that of an older driver who could find a highly
complex environment too difficult to negotiate and actually increase the
likelihood of an accident.
– Further research is needed to examine the interaction between infrastructure
design and the affect on ability and skill of older drivers.
24
ENGINEERING SOLUTIONS
infrastructure
Shared space
 Evidence it works?
 TRL 661
 Reid, S Kocak, N and Hunt, L (2009) DfT Shared
Spaces Project – Stage 1: Appraisal of Shared Space.
MVA Consultancy.
 Hammond, V. and Musselwhite, C B A (2013). The
attitudes, perceptions and concerns of pedestrians and
vulnerable road users to shared space: a case study
from the UK. Journal Of Urban Design 18(1), 78-97.
25
ENGINEERING SOLUTIONS
infrastructure
 Evidence against it
Moody, S. and Melia, S. (2011) Shared space -
implications of recent
research for transport policy. Transport Policy . ISSN
0967-070X
See
http://eprints.uwe.ac.uk/16039/1/Shared%20Space
%20-
%20Implications%20of%20Recent%20Research%2
0for%20Transport%20Policy.pdf
Imrie, R and Kumar, M (2010) ‘Shared Space and
Sight Loss: Policies and Practices in English Local
Authorities’. Thomas Pilkington Trust. January 2010.
Driving tests, learners and safety
 750,000 qualify for car driving licence each year (DfT, 2007)
 Majority of people felt test did not adequately prepare driver for the
road (Christmas, 2007)
 Probably quite justified – first 6 months of driving over represented in
accident statistics (esp. youngsters) (DfT, 2008; Emmerson, 2008)
 Learner drivers have poor conceptualisation of what makes a good
driver (Emmerson, 2008)
 Learning really begins after the test was a view consistently held but
reluctant to take formal training (Christmas, 2007)
– Learning from experience
– Learning from mistakes
– Forming habits and learning norms
EDUCATION
26
 Time for radical review of driving learning and
test (DSA consultation 2008)
 Test requires no formal learning and hasn’t been
radically changes since being introduced in 1935
 DSA propose
– Lifelong learning
– Improving ecological validity
– Cover social aspects of the road
– Formalise learning arrangements
– Group based learning
• Implementation intentions work in localised
conditions (Elliott and Armitage, 2006)
• Thames Valley Speed Course – some effect on
change in attitude and behaviour especially on
30mph residential roads, but not motorways
(McKenna and Poulter, 2008)
Driving tests, learners and safety
EDUCATION
27
EDUCATION
28
EDUCATION
29
Context, theory and interventions
 Despite widespread deployment, little evidence to suggest attitude and
behaviour change (O’Connell, 2002; Thomas et al., 2007)
– Incurable optimism leads people to believe message is not for them (O’Connell,
2002)
– Driver can give drivers an excuse for their behaviour – problem is with other
drivers (Silcock, et al.,1999)
– Fear inducing adverts have very little effect on driver attitudes and behaviour
(Fylan et al., 2006)
 Could be methodological problems as much as campaign themselves
(Dragutinovic and Twisk, 2006)
 Lack of theory cited behind the development of the message
– “Popular psychology” approach
» Vs.
– Theory-led non-reality approach
ROAD SAFETY CAMPAIGNS
EDUCATION
30
Summary
 Changes in attitude and behaviour difficult to monitor and
evaluate effective education and campaigns.
 Ownership of learning/need to change
 Life-long learning
 Group discussion and social context
 In-situ
– Psychological and geographical difference
– Making it feel real
ROAD SAFETY CAMPAIGNS
EDUCATION
31
Context
 Compulsory to fit front seat-belts to new cars from 1967.
 Voluntary use encouraged through clunk-click campaign in 1970s
– Seat-belt use around 40%
 Law to wear seat-belts in front of vehicle from 31st January 1983 (3 year
trial then permanent from 1986)
– Seat belt compliance 90%
 Rear seat-belt use 17% up to 40% in 1991 when made compulsory
– Up to 85% in 2008 (higher for children) with associated campaigns
 However, of 1,432 car occupants killed in 2007, 34% had not belted up
and of these 370 could have survived if properly restrained.
SEAT BELT USE
ENFORCEMENT
32
33
34
High compliance
 Compliance behaviour is clear
and unambiguous
 Legislation was initially heavy
but without fines
 Associated successful
campaigns
SEAT BELT USE
 Behaviour is easy to perform
 Little associated perceived costs
or risk
 Image is positive
SEAT BELT USE
ENFORCEMENT
35
Context
High support and compliance for drink-driving laws
 High support for drink-driving laws (Higginson, 2005)
– Clamp-down on drink-driving is positively perceived (RAC, 2007)
– Support for high penalties – 72% suggest drink-drivers should get a ban of 5 years (DfT, 2008)
– 94% support a more severe penalty
– 85% think limit should be no drinks at all (DfT, 2008)
 Women and those in lower socio-economic groups are more punitive (DfT,2008).
 15-19 year old boys more tolerant than girls about drink-driving (O’Brien et al., 2002) but
is still unacceptable amongst youngsters (Thomas et al., 2007)
 Drink-driving known to be major cause of road accidents (Cauzard, 2003; Fuller et al.,
2008)
 75% thought the public were unable to judge how much they can drink before being over
the drink-drive limit, but felt they were able to themselves!
 Driving on cannabis thought to be more acceptable than drink-driving according to 15-19
year olds (Thomas et al., 2007).
 Substantial number of drivers who still find it acceptable to have at least 2 drinks and drive
(Higginson, 2005)
DRINK DRIVING
ENFORCEMENT
36
Context
But high number still drink-drive
 Serious accidents, (fatalities and serious casualties) involving drink-
driving are falling over past 20 years but slight casualties are increasing.
– Reported casualties: 11,190 (5% of all road accident casualties)
– Fatalities 380 in 2009 (11% of all road accident fatalities)
– Serious injured 1,480
– Slight casualties 10,130
DRINK DRIVINGDRINK DRIVING
ENFORCEMENT
37
Legislation
 44% of population have driven after drinking some alcohol in previous year
 8-9% of population believed they had driven over the limit in last year
 Most likely to be 17-29 year old males (25% admitted to driving over limit in previous
year).
 Also 17-25 year olds over represented in accident stats relating to alcohol.
DRINK DRIVINGDRINK DRIVING
ENFORCEMENT
38
Legislation
Legislation is quite tough
 Around 500,000 breath tests carried out a year of which around 100,000 are
found to be positive.
 Limit in UK is 80mg alcohol per 100ml of blood (most EU countries are
50mg/100ml and Sweden is 20mg/100ml)
 Endorsement for drink-driving remains on licence for 11 years
 Max imprisonment for driving over limit is 6 months and a fine of £5000 and
a minimum ban of 12 months of driving
 Causing death by dangerous driving carries maximum 14 years in prison
and a minimum 2 year driving ban (and requirement to take extended
driving test before being able to drive again)
DRINK DRIVINGDRINK DRIVING
ENFORCEMENT
39
Evaluation
Works quite well
 Tough and harsh penalties
– Random breath tests
 Associated campaigns
– Shock
– Aftermath
 Tackling drink-culture and social
pressure not to drink-drive
More could be done
 Pub bus
 Zero tolerance.
But…
 Ambiguity over limit
 Social pressure?
DRINK DRIVINGDRINK DRIVING
ENFORCEMENT
40
Summary
 Non ambiguous behaviour to comply to law
 Harsh penalties and enforcement
 Associated campaigns
– Shock tactics but also…
– Aftermath – the social consequences for ordinary life.
 Need to tackle social acceptability and the wider social
context within which such behaviours occur
DRINK DRIVING
ENFORCEMENT
41
Speed cameras (1)
ENFORCEMENT
42
Speed Cameras (2)
So they work?
Yes…
 Studies have shown that a reduction in the speed limit to 20mph
in built-up areas causes a 60 per cent fall in accidents
 Evidence from Swindon showed a 30 per cent reduction in the
numbers of people killed or injured since cameras were installed
 At 10 of the sites in Swindon where cameras were introduced, no
road accident deaths have been recorded
No...
 Critics say it's not speed that kills but tiredness and careless
driving. It's this that should be targeted with safer driving
campaigns
 Speed cameras are being used as an easy way for the authorities
to bump up their revenues, antagonising the public
 Cameras are counter-productive in creating a tendency for
drivers to break the speed limit when they are not around
ENFORCEMENT
More on this
43
Road Safety Audit
 The Road Safety Audit is an “evaluation of Highway Improvement
Schemes to identify potential road safety problems that may affect
any users of the highway and to recommend measures to eliminate
or mitigate these problems”. It is now considered by many council
officials as an essential, integral part of town planning and many
private organisations now consider it at least desirable and often
essential.
 The Auditors need to take all road users into account, particularly
vulnerable users such as pedestrians and pedal cyclists.
 Having identified any potential road safety problems, the Auditors
then make recommendations of possible solutions. The client then
reviews the findings of the Road Safety Audit, deciding which
recommendations to accept, and therefore implement within the
scheme design and construction. For those recommendations that
are not accepted, good reason should be given.
44
Road safety Audit
 Road Safety Audits are undertaken at various stages of the highway improvement
scheme and comprise:-
– Stage 1 – Completion of preliminary design
– Stage 2 – Completion of detailed design
– Stage 3 – Completion of construction
– Stage 4 – Monitoring (12 months and 36 months)
 A stage 1 and 2 Road Safety Audit are quite often combined.
 Road Safety Audits can be requested for:
– Major and minor highway improvements
– Traffic management and calming schemes
– Pedestrian and cycling schemes
– New and amended junctions
– Motorway improvements
 Road Safety Audits are undertaken by an Audit Team, which must be independent
to the Design Team.
– The Audit Team comprises of a minimum of two persons with appropriate levels of
training, skills and experience in Road Safety Engineering and/or Accident
Investigation.
– The members of the Audit Team may be drawn from within the Design Organisation
or from another body.
 Site visits are a specific requirement of the Audit and both day time and night time
visits are usually required in the later Audit stages.
45
Conclusion
 Road user safety solutions – the three Es
 Education, educate the driver
 Enforcement, restrict the driver
 Engineering, aid or take over from the driver
 Road safety audit
46

17 hauer web9 lessons learned white paper

  • 1.
    The 3 Esand Road Safety Policy Developing a road safety audit Dr Charles Musselwhite
  • 2.
    Content • Reason foraccidents – Road environment – Skill – Attitudes • Interventions for improving road user safety – Education – Enforcement – Engineering • Policy and Strategies for road user safety – UK policy – Vision Zero • Road safety audit
  • 3.
    Road casualty causation Skill – Experience and development – Training  Attitude – Norms and peer pressure – Education, enforcement  Infrastructure – Engineering ROAD ENVIRONMENT (23%) ATTITUDES SKILLS 3 ROAD USER (95%)
  • 4.
  • 5.
    Worst road. Why? A537 through the Peak District, – known as the Cat and Fiddle, – had severe bends, steep falls from the carriageway and was edged by dry-stone walls or rock face for almost all its length. – Fatal and serious collisions on the route - popular with tourists, goods vehicles and motorcyclists - rose from 15 in the three years to 2005 to 34 between 2006 and 2008. – Single carriageway A road. – Most crashes happened at weekends during the summer in dry, daylight conditions. 5 ROAD ENVIRONMENT
  • 6.
  • 7.
  • 8.
    Roads and deaths •19% of traffic was on motorways, but this accounts for 5% of casualties • 38% of deaths occurred on rural A roads with 62% on all rural roads – but only 40% of the traffic • Nearly 60% of all casualties occur on urban roads 8 ROAD ENVIRONMENT
  • 9.
    Design of streetsand environment Areas of high road user accidents tend to be characterised by: • Large open carriage way for vehicles. • Areas of mixed land-use • Areas where houses have little or no outside areas for recreation. • No segregation of heavy volume traffic from pedestrian and other light traffic. • Housing and streets where pedestrian and other travellers’ safety has not been considered and were often designed pre-motor-vehicle. Hence greater on-road parking and narrow pavements increase road user conflict and increases the potential for accidents (Christie 1995). • Crossing of main roads to get to services increases road user danger – it has been found that children from families with the lowest quarter of income cross 50% more roads than those in families in the highest income quarter (Judge and Benzeval, 1993; White et al., 2000). ROAD ENVIRONMENT 9
  • 10.
    Skill Deprivation  Self-reportedskill  Everyone better than the average driver! – Can this be the case?  Objective studies suggest – Poor hazard prediction – Close focus of gaze – Inability to multi-task – High level of concentration on primary order tasks, leaving little processing for other areas of skill. • Steering • Gear changing SKILLS 10
  • 11.
    Novice driver eyegaze and fixation SKILLS 11
  • 12.
     But doesnot show why there should be differences between male and female road users.  Need to turn to attitudes and other psychosocial variables 12 SKILLS
  • 13.
    The public knowthat driver behaviour is a major contributory factor in the vast majority of road accidents (Cauzard, 2003) but there is a consistent view that others drive in a more risky manner than individuals themselves do (King and Parker, 2008) Not just driving – older children and adolescents think they have good attitude and skills towards road safety but believe that others especially those in their peer group do not (Tolmie. 2006). Self versus others ATTITUDES 13
  • 14.
    Individuals do notbelieve they are dangerous on the roads And Believe others are a danger on the roads  I am not likely to be responsible for an accidents, others are likely to be responsible. Therefore little I can do.  Hence, less likely to need to “plan to avoid them”  Campaigns aimed at dangerous driving are for “other” drivers not themselves.  Such campaigns re-emphasise this difference (2CV, 2008 and Flaming Research, 2008)  The third-person effect (Davison, 1983).  High support for enforcement, engineering solutions and education  But not for themselves - for other people. Self versus others ATTITUDES 14
  • 15.
    Positive attitudes tothe speed limit and dangers of speeding  90% agree “important that people drive within the speed limit” (British Attitudes Survey, 2005 in DfT, 2008)  39% agree it is dangerous to drive over the speed limit at all (Angle et al., 2007)  76% of drivers completely agree that driving too fast for the conditions is dangerous (Angle et al., 2007)  Public support tougher enforcement of speeds especially in residential areas and surrounding schools (Brake, 2004; Higginson, 2005; Holder n-d; Quimby, 2005)  77% support 20mph zones (British Attitude Survey, 2007 in DfT, 2008)  On the whole, the public have good knowledge of the speeding and accident link (Brake, 2004; Fuller, Bates et al., 2008; Higginson, 2005; Holder n-d; RAC, 2007; Quimby, 2005;) But drivers continue to drive over the speed limit  A conservative estimate suggests 49% of drivers continue to drive over the speed limit in 30mph zones and on motorways (DfT, 2009) Norms ATTITUDES 15
  • 16.
    Why?  Driving overthe speed limit is not necessarily “speeding” – Speeding is 1mph over (33%); speeding is 5mph over (33%) (Higginson, 2005) – 10mph over is normal view for speeding (Corbett, 2001)  Driving over the speed limit is not necessarily breaking the law – 94% of drivers consider themselves law abiding (RAC, 2007) – drivers conceptualisation of law abiding does not involve speeding (Moller, 2004). – Laws & rules of driving were judged subjectively not simply followed (Christmas, 2007).  Social comparison/contagion model – – Other people are doing it, more often and faster than me – Almost all drivers believe other drivers speed (c.90%) (Holder et al., u/p; SARTRE, CAuzard, 2003) – More likely to speed if believe others are speeding (Fuller et al., 2008) – Other people drive faster than myself (Fuller et al., 2008) – A view especially held by younger drivers (Yagil, 1998) and faster drivers (Aberg et al., 1997; Haglund and Aberg, 2005) OK to drive over the speed limit – it isn’t speeding, it isn’t breaking the law and others are doing it and are doing it more dangerously than myself. Norms ATTITUDES 16
  • 17.
    Interventions: The 3E’s IMPROVING SAFETY ENGINEERING  Safer car design and engineering – Anti-locking brakes – Traction control – More reliable engine, tyres and components – Air-bags – Side impact bars – AVCSS  Better infrastructure and engineering – Better road surfaces – Better signage – More forgiving – Traffic calming – Shared space EDUCATION •Better education •Hazard perception test •Potential for a requirement for longer, more stringent, reflective learning process •Drink-driving campaigns •Clunk-click with Jimmy Saville ENFORCEMENT •Rules and regulations and enforcement •Seat-belts •Drink-driving •Speed cameras •Mobile phones EDUCATION ENFORCEMENT ENGINEERING SOLUTIONS 17
  • 18.
    Movement and place Greateremphasis on movement  1930s: Super segregation proposed  1950s-1970s: Segregation but hierarchical  1980/90s: Traffic calming  Early 2000s: Home Zones  Mid 2000s: Naked streets  2007 Manual for Streets  Late 2000s: Shared Space  Late 2000s: DIY Streets  Late 2000s: 20mph zones/areas  Late 2000s: Link/place proposed Greater emphasis on place ENGINEERING SOLUTIONS infrastructure
  • 19.
     Segregation – Doesit work? – Side effects 19 ENGINEERING SOLUTIONS infrastructure
  • 20.
    Traffic calming typesin the UK Speed or flat-topped tables Speed humps ChicanesPinch points Speed cushion 20 ENGINEERING SOLUTIONS infrastructure
  • 21.
    Traffic calming typesin the UK  Mini roundabout 21 ENGINEERING SOLUTIONS infrastructure
  • 22.
    Traffic calming typesin the UK  Gateway Narrowings 22 ENGINEERING SOLUTIONS infrastructure
  • 23.
    Traffic calming  Reductionin speed – Which speed measure to use – Fastest speeds?  Reduction in amount of traffic – But where to?  Reduction in accidents  Though low numbers before and after  Poorer road positioning – More difficult to predict driver behaviour  Increase in delay to emergency vehicles  Increase in pollution – Noise – Vibration  Poorer bus rides 23 ENGINEERING SOLUTIONS infrastructure
  • 24.
    Shared space  “Providingless complex and ‘self-explaining’ roads, which have clear signage and road markings as well as intuitive infrastructure is likely to benefit all road users, in addition to the older driver” (Box et al., 2010; pg. 43) Vs.  Creating a more complex to encourage sharing of space and a levelling of priorities amongst different users (Engwicht, 1992; Hamiton-Baillie and Jones, 2005).  This should help reduce speeds of drivers who have to informally negotiate the space with other road users and the ambiguity of the road scene.  But we don’t know the tipping point between the two? – what may create complexity and additional attention amongst a younger driver may well be very different to that of an older driver who could find a highly complex environment too difficult to negotiate and actually increase the likelihood of an accident. – Further research is needed to examine the interaction between infrastructure design and the affect on ability and skill of older drivers. 24 ENGINEERING SOLUTIONS infrastructure
  • 25.
    Shared space  Evidenceit works?  TRL 661  Reid, S Kocak, N and Hunt, L (2009) DfT Shared Spaces Project – Stage 1: Appraisal of Shared Space. MVA Consultancy.  Hammond, V. and Musselwhite, C B A (2013). The attitudes, perceptions and concerns of pedestrians and vulnerable road users to shared space: a case study from the UK. Journal Of Urban Design 18(1), 78-97. 25 ENGINEERING SOLUTIONS infrastructure  Evidence against it Moody, S. and Melia, S. (2011) Shared space - implications of recent research for transport policy. Transport Policy . ISSN 0967-070X See http://eprints.uwe.ac.uk/16039/1/Shared%20Space %20- %20Implications%20of%20Recent%20Research%2 0for%20Transport%20Policy.pdf Imrie, R and Kumar, M (2010) ‘Shared Space and Sight Loss: Policies and Practices in English Local Authorities’. Thomas Pilkington Trust. January 2010.
  • 26.
    Driving tests, learnersand safety  750,000 qualify for car driving licence each year (DfT, 2007)  Majority of people felt test did not adequately prepare driver for the road (Christmas, 2007)  Probably quite justified – first 6 months of driving over represented in accident statistics (esp. youngsters) (DfT, 2008; Emmerson, 2008)  Learner drivers have poor conceptualisation of what makes a good driver (Emmerson, 2008)  Learning really begins after the test was a view consistently held but reluctant to take formal training (Christmas, 2007) – Learning from experience – Learning from mistakes – Forming habits and learning norms EDUCATION 26
  • 27.
     Time forradical review of driving learning and test (DSA consultation 2008)  Test requires no formal learning and hasn’t been radically changes since being introduced in 1935  DSA propose – Lifelong learning – Improving ecological validity – Cover social aspects of the road – Formalise learning arrangements – Group based learning • Implementation intentions work in localised conditions (Elliott and Armitage, 2006) • Thames Valley Speed Course – some effect on change in attitude and behaviour especially on 30mph residential roads, but not motorways (McKenna and Poulter, 2008) Driving tests, learners and safety EDUCATION 27
  • 28.
  • 29.
  • 30.
    Context, theory andinterventions  Despite widespread deployment, little evidence to suggest attitude and behaviour change (O’Connell, 2002; Thomas et al., 2007) – Incurable optimism leads people to believe message is not for them (O’Connell, 2002) – Driver can give drivers an excuse for their behaviour – problem is with other drivers (Silcock, et al.,1999) – Fear inducing adverts have very little effect on driver attitudes and behaviour (Fylan et al., 2006)  Could be methodological problems as much as campaign themselves (Dragutinovic and Twisk, 2006)  Lack of theory cited behind the development of the message – “Popular psychology” approach » Vs. – Theory-led non-reality approach ROAD SAFETY CAMPAIGNS EDUCATION 30
  • 31.
    Summary  Changes inattitude and behaviour difficult to monitor and evaluate effective education and campaigns.  Ownership of learning/need to change  Life-long learning  Group discussion and social context  In-situ – Psychological and geographical difference – Making it feel real ROAD SAFETY CAMPAIGNS EDUCATION 31
  • 32.
    Context  Compulsory tofit front seat-belts to new cars from 1967.  Voluntary use encouraged through clunk-click campaign in 1970s – Seat-belt use around 40%  Law to wear seat-belts in front of vehicle from 31st January 1983 (3 year trial then permanent from 1986) – Seat belt compliance 90%  Rear seat-belt use 17% up to 40% in 1991 when made compulsory – Up to 85% in 2008 (higher for children) with associated campaigns  However, of 1,432 car occupants killed in 2007, 34% had not belted up and of these 370 could have survived if properly restrained. SEAT BELT USE ENFORCEMENT 32
  • 33.
  • 34.
  • 35.
    High compliance  Compliancebehaviour is clear and unambiguous  Legislation was initially heavy but without fines  Associated successful campaigns SEAT BELT USE  Behaviour is easy to perform  Little associated perceived costs or risk  Image is positive SEAT BELT USE ENFORCEMENT 35
  • 36.
    Context High support andcompliance for drink-driving laws  High support for drink-driving laws (Higginson, 2005) – Clamp-down on drink-driving is positively perceived (RAC, 2007) – Support for high penalties – 72% suggest drink-drivers should get a ban of 5 years (DfT, 2008) – 94% support a more severe penalty – 85% think limit should be no drinks at all (DfT, 2008)  Women and those in lower socio-economic groups are more punitive (DfT,2008).  15-19 year old boys more tolerant than girls about drink-driving (O’Brien et al., 2002) but is still unacceptable amongst youngsters (Thomas et al., 2007)  Drink-driving known to be major cause of road accidents (Cauzard, 2003; Fuller et al., 2008)  75% thought the public were unable to judge how much they can drink before being over the drink-drive limit, but felt they were able to themselves!  Driving on cannabis thought to be more acceptable than drink-driving according to 15-19 year olds (Thomas et al., 2007).  Substantial number of drivers who still find it acceptable to have at least 2 drinks and drive (Higginson, 2005) DRINK DRIVING ENFORCEMENT 36
  • 37.
    Context But high numberstill drink-drive  Serious accidents, (fatalities and serious casualties) involving drink- driving are falling over past 20 years but slight casualties are increasing. – Reported casualties: 11,190 (5% of all road accident casualties) – Fatalities 380 in 2009 (11% of all road accident fatalities) – Serious injured 1,480 – Slight casualties 10,130 DRINK DRIVINGDRINK DRIVING ENFORCEMENT 37
  • 38.
    Legislation  44% ofpopulation have driven after drinking some alcohol in previous year  8-9% of population believed they had driven over the limit in last year  Most likely to be 17-29 year old males (25% admitted to driving over limit in previous year).  Also 17-25 year olds over represented in accident stats relating to alcohol. DRINK DRIVINGDRINK DRIVING ENFORCEMENT 38
  • 39.
    Legislation Legislation is quitetough  Around 500,000 breath tests carried out a year of which around 100,000 are found to be positive.  Limit in UK is 80mg alcohol per 100ml of blood (most EU countries are 50mg/100ml and Sweden is 20mg/100ml)  Endorsement for drink-driving remains on licence for 11 years  Max imprisonment for driving over limit is 6 months and a fine of £5000 and a minimum ban of 12 months of driving  Causing death by dangerous driving carries maximum 14 years in prison and a minimum 2 year driving ban (and requirement to take extended driving test before being able to drive again) DRINK DRIVINGDRINK DRIVING ENFORCEMENT 39
  • 40.
    Evaluation Works quite well Tough and harsh penalties – Random breath tests  Associated campaigns – Shock – Aftermath  Tackling drink-culture and social pressure not to drink-drive More could be done  Pub bus  Zero tolerance. But…  Ambiguity over limit  Social pressure? DRINK DRIVINGDRINK DRIVING ENFORCEMENT 40
  • 41.
    Summary  Non ambiguousbehaviour to comply to law  Harsh penalties and enforcement  Associated campaigns – Shock tactics but also… – Aftermath – the social consequences for ordinary life.  Need to tackle social acceptability and the wider social context within which such behaviours occur DRINK DRIVING ENFORCEMENT 41
  • 42.
  • 43.
    Speed Cameras (2) Sothey work? Yes…  Studies have shown that a reduction in the speed limit to 20mph in built-up areas causes a 60 per cent fall in accidents  Evidence from Swindon showed a 30 per cent reduction in the numbers of people killed or injured since cameras were installed  At 10 of the sites in Swindon where cameras were introduced, no road accident deaths have been recorded No...  Critics say it's not speed that kills but tiredness and careless driving. It's this that should be targeted with safer driving campaigns  Speed cameras are being used as an easy way for the authorities to bump up their revenues, antagonising the public  Cameras are counter-productive in creating a tendency for drivers to break the speed limit when they are not around ENFORCEMENT More on this 43
  • 44.
    Road Safety Audit The Road Safety Audit is an “evaluation of Highway Improvement Schemes to identify potential road safety problems that may affect any users of the highway and to recommend measures to eliminate or mitigate these problems”. It is now considered by many council officials as an essential, integral part of town planning and many private organisations now consider it at least desirable and often essential.  The Auditors need to take all road users into account, particularly vulnerable users such as pedestrians and pedal cyclists.  Having identified any potential road safety problems, the Auditors then make recommendations of possible solutions. The client then reviews the findings of the Road Safety Audit, deciding which recommendations to accept, and therefore implement within the scheme design and construction. For those recommendations that are not accepted, good reason should be given. 44
  • 45.
    Road safety Audit Road Safety Audits are undertaken at various stages of the highway improvement scheme and comprise:- – Stage 1 – Completion of preliminary design – Stage 2 – Completion of detailed design – Stage 3 – Completion of construction – Stage 4 – Monitoring (12 months and 36 months)  A stage 1 and 2 Road Safety Audit are quite often combined.  Road Safety Audits can be requested for: – Major and minor highway improvements – Traffic management and calming schemes – Pedestrian and cycling schemes – New and amended junctions – Motorway improvements  Road Safety Audits are undertaken by an Audit Team, which must be independent to the Design Team. – The Audit Team comprises of a minimum of two persons with appropriate levels of training, skills and experience in Road Safety Engineering and/or Accident Investigation. – The members of the Audit Team may be drawn from within the Design Organisation or from another body.  Site visits are a specific requirement of the Audit and both day time and night time visits are usually required in the later Audit stages. 45
  • 46.
    Conclusion  Road usersafety solutions – the three Es  Education, educate the driver  Enforcement, restrict the driver  Engineering, aid or take over from the driver  Road safety audit 46