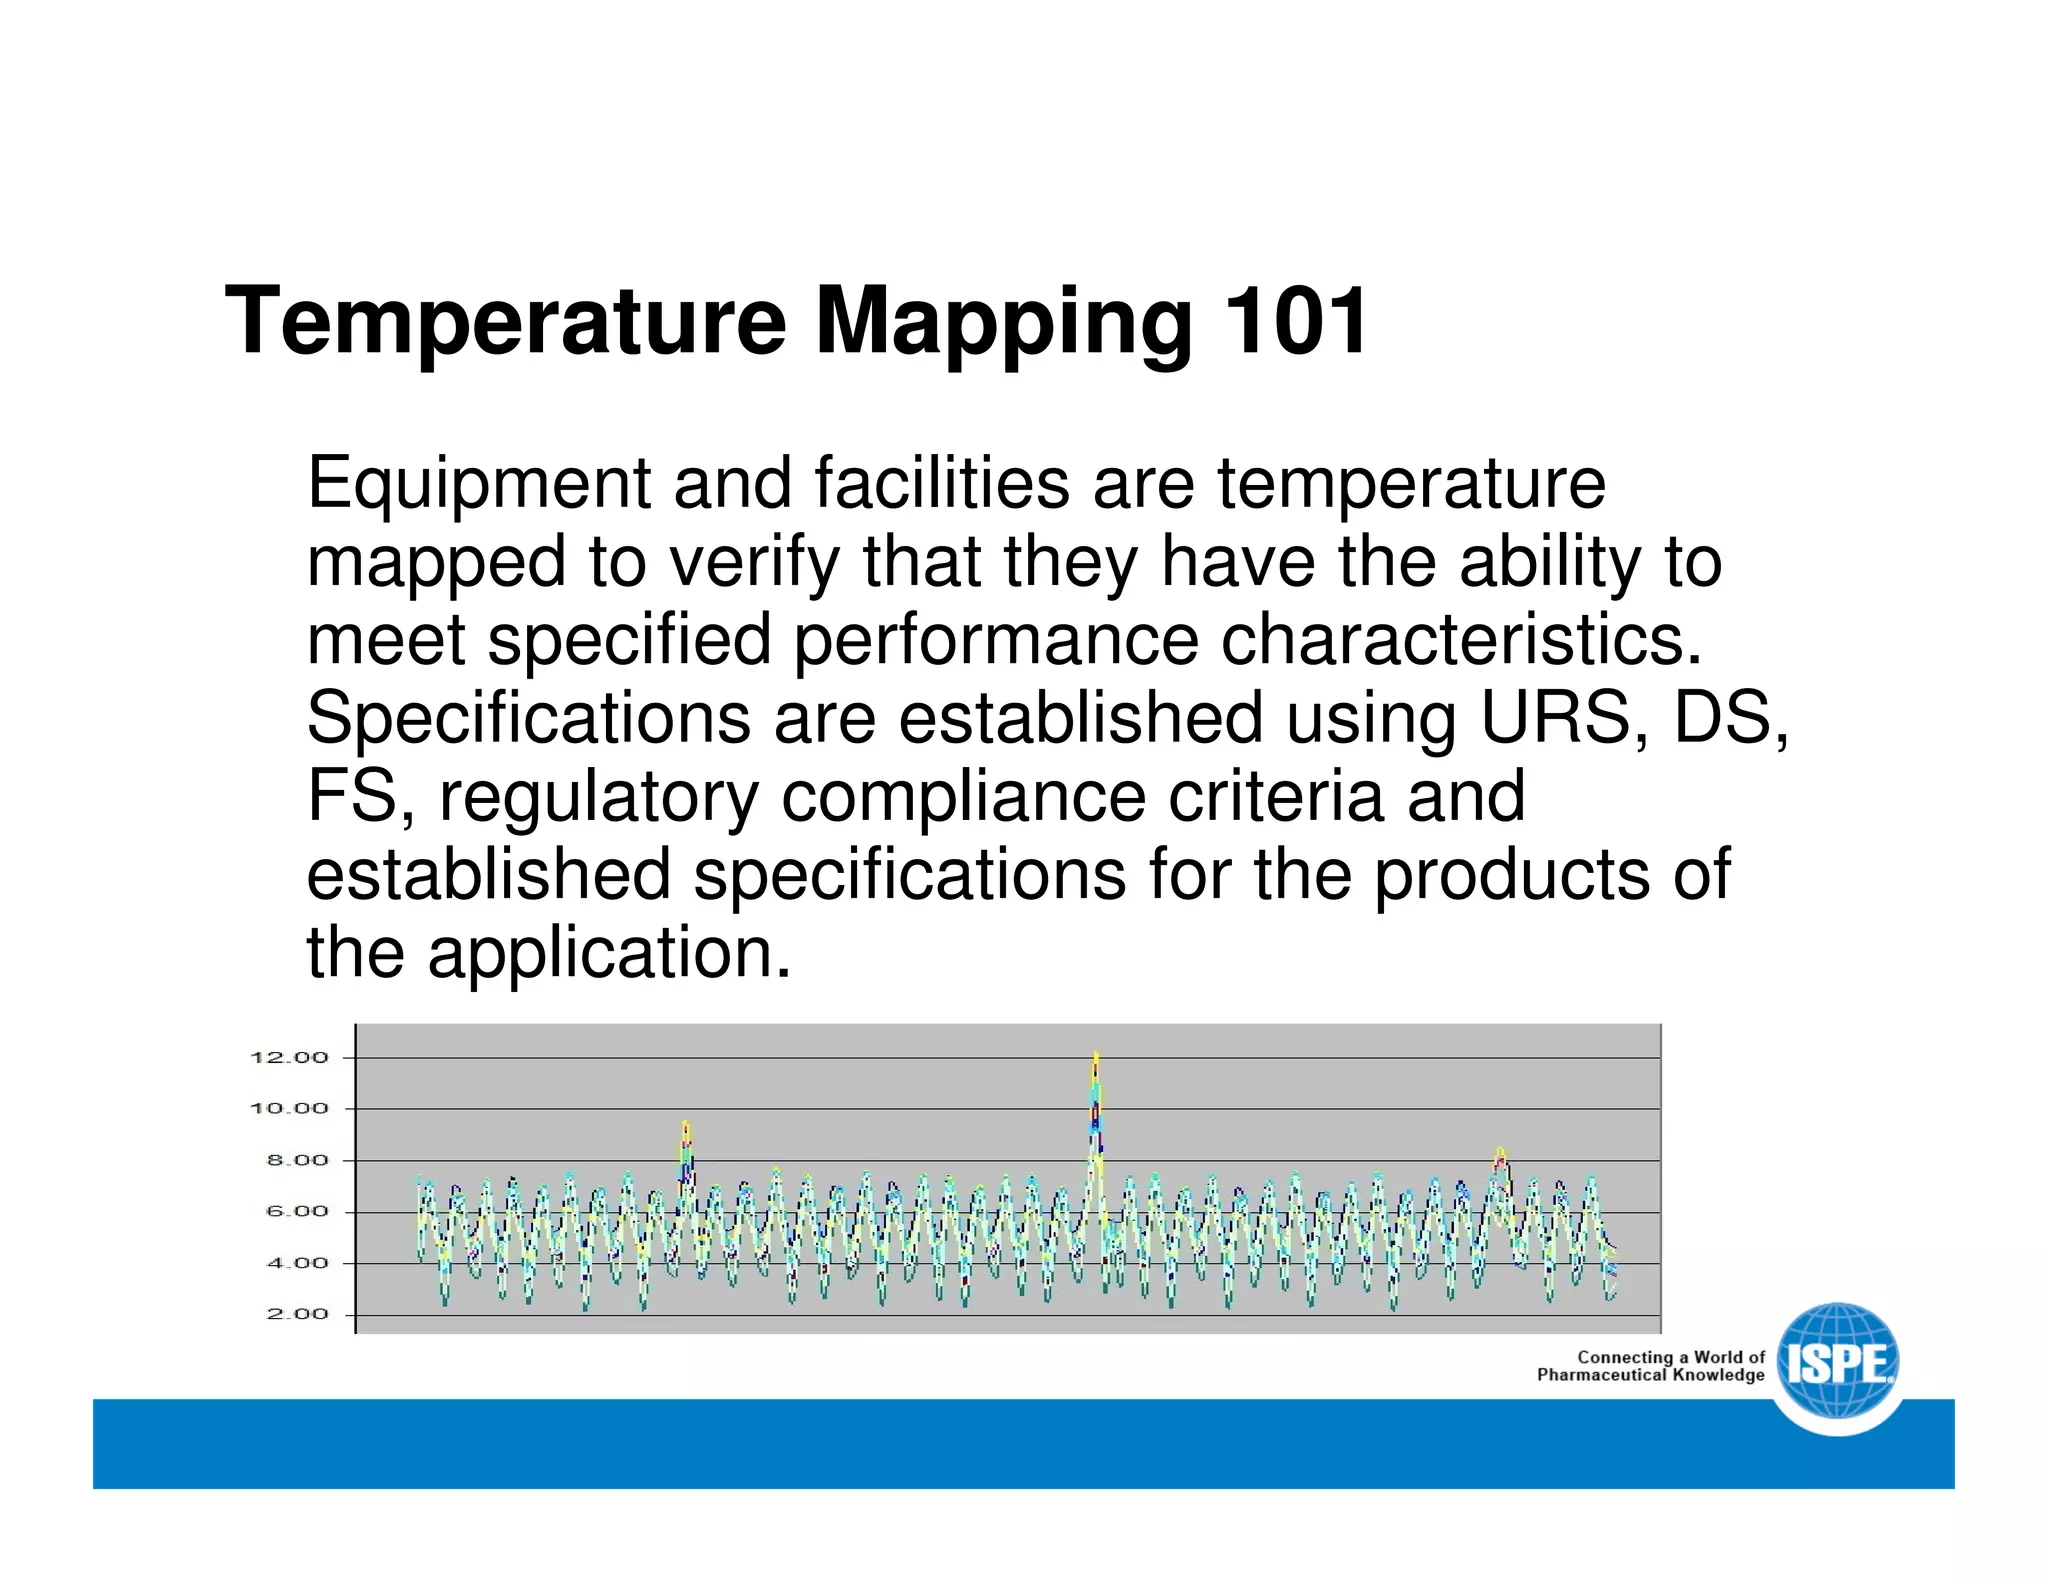
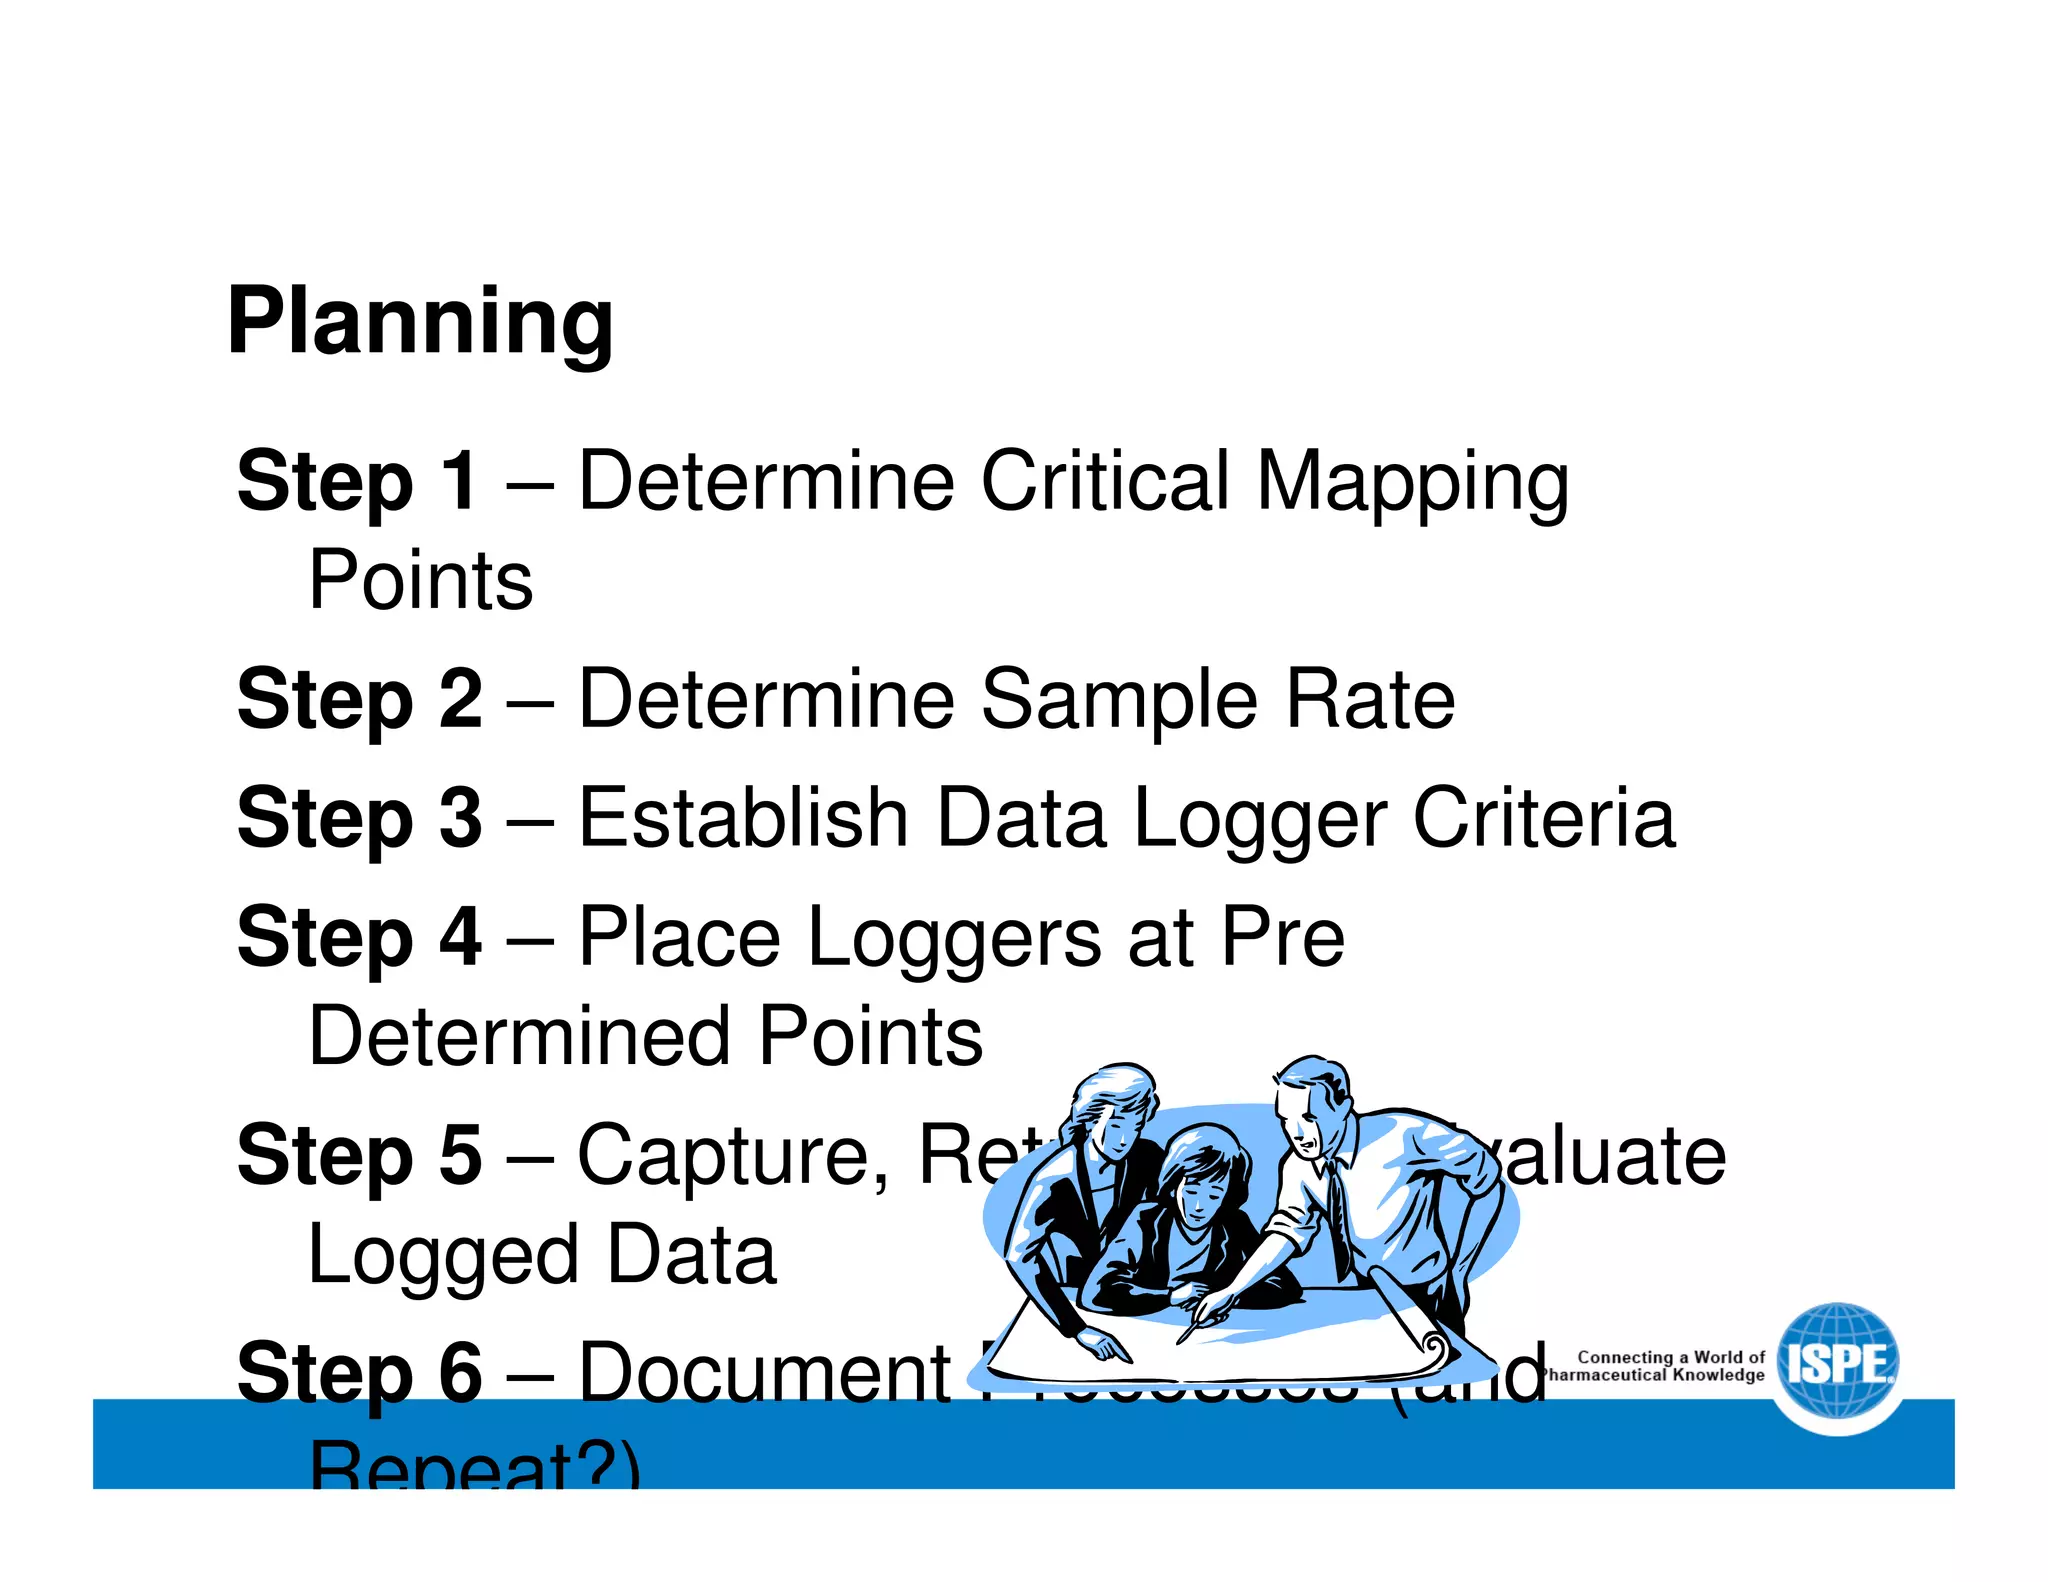
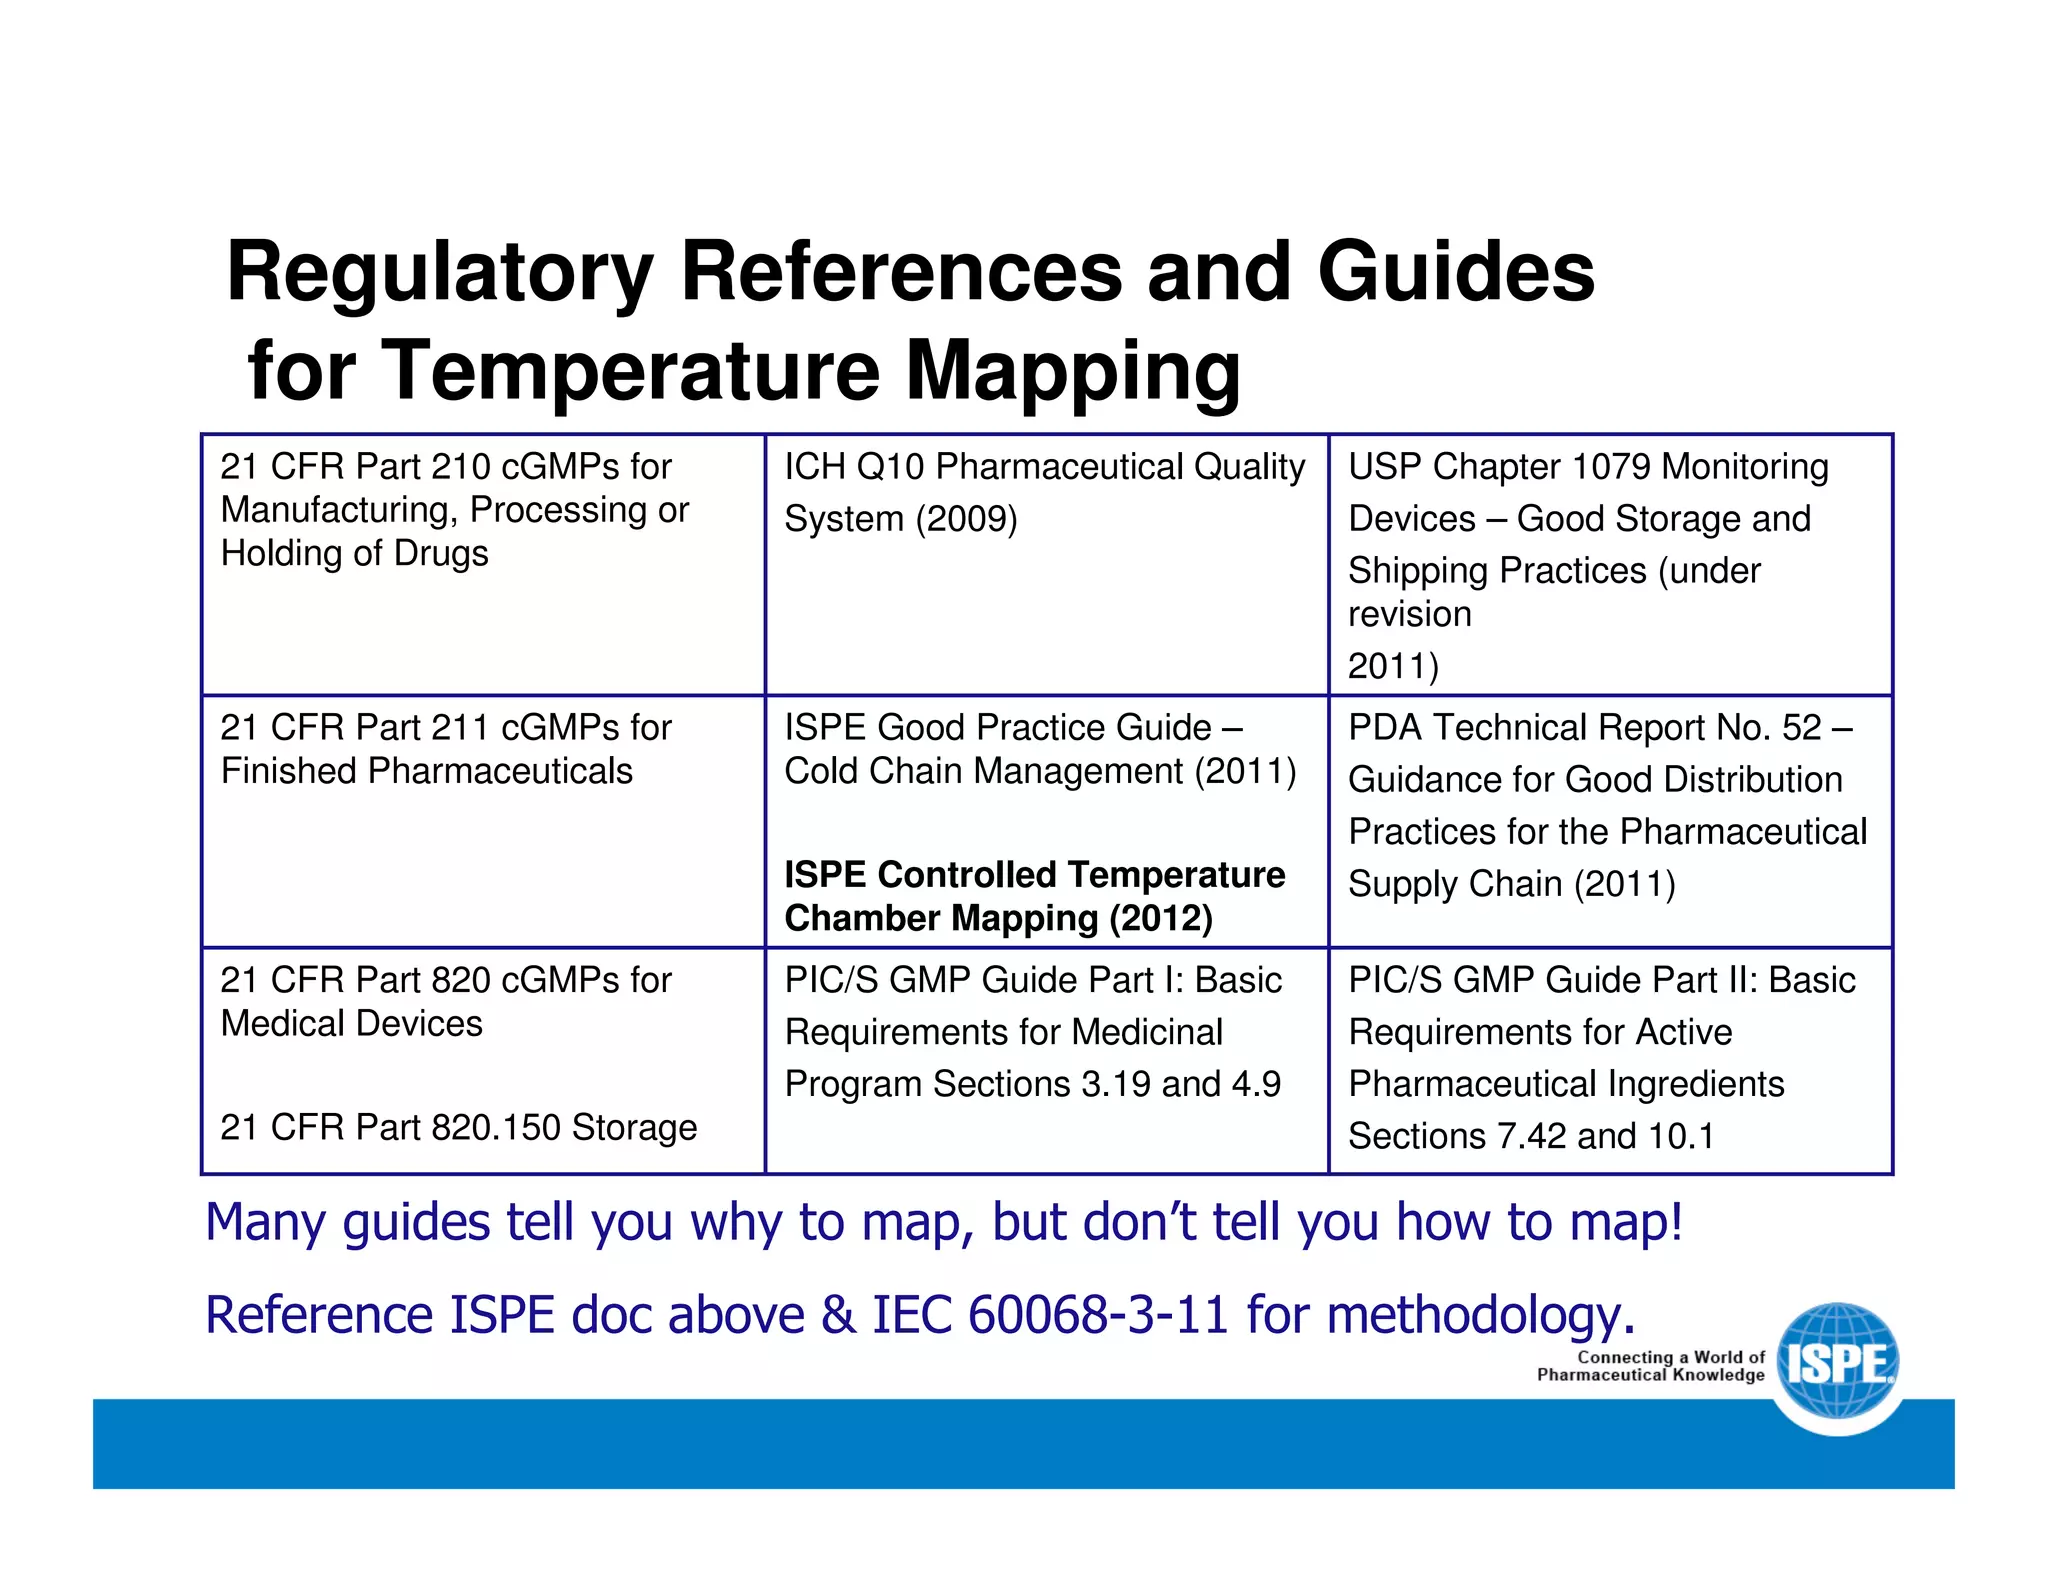
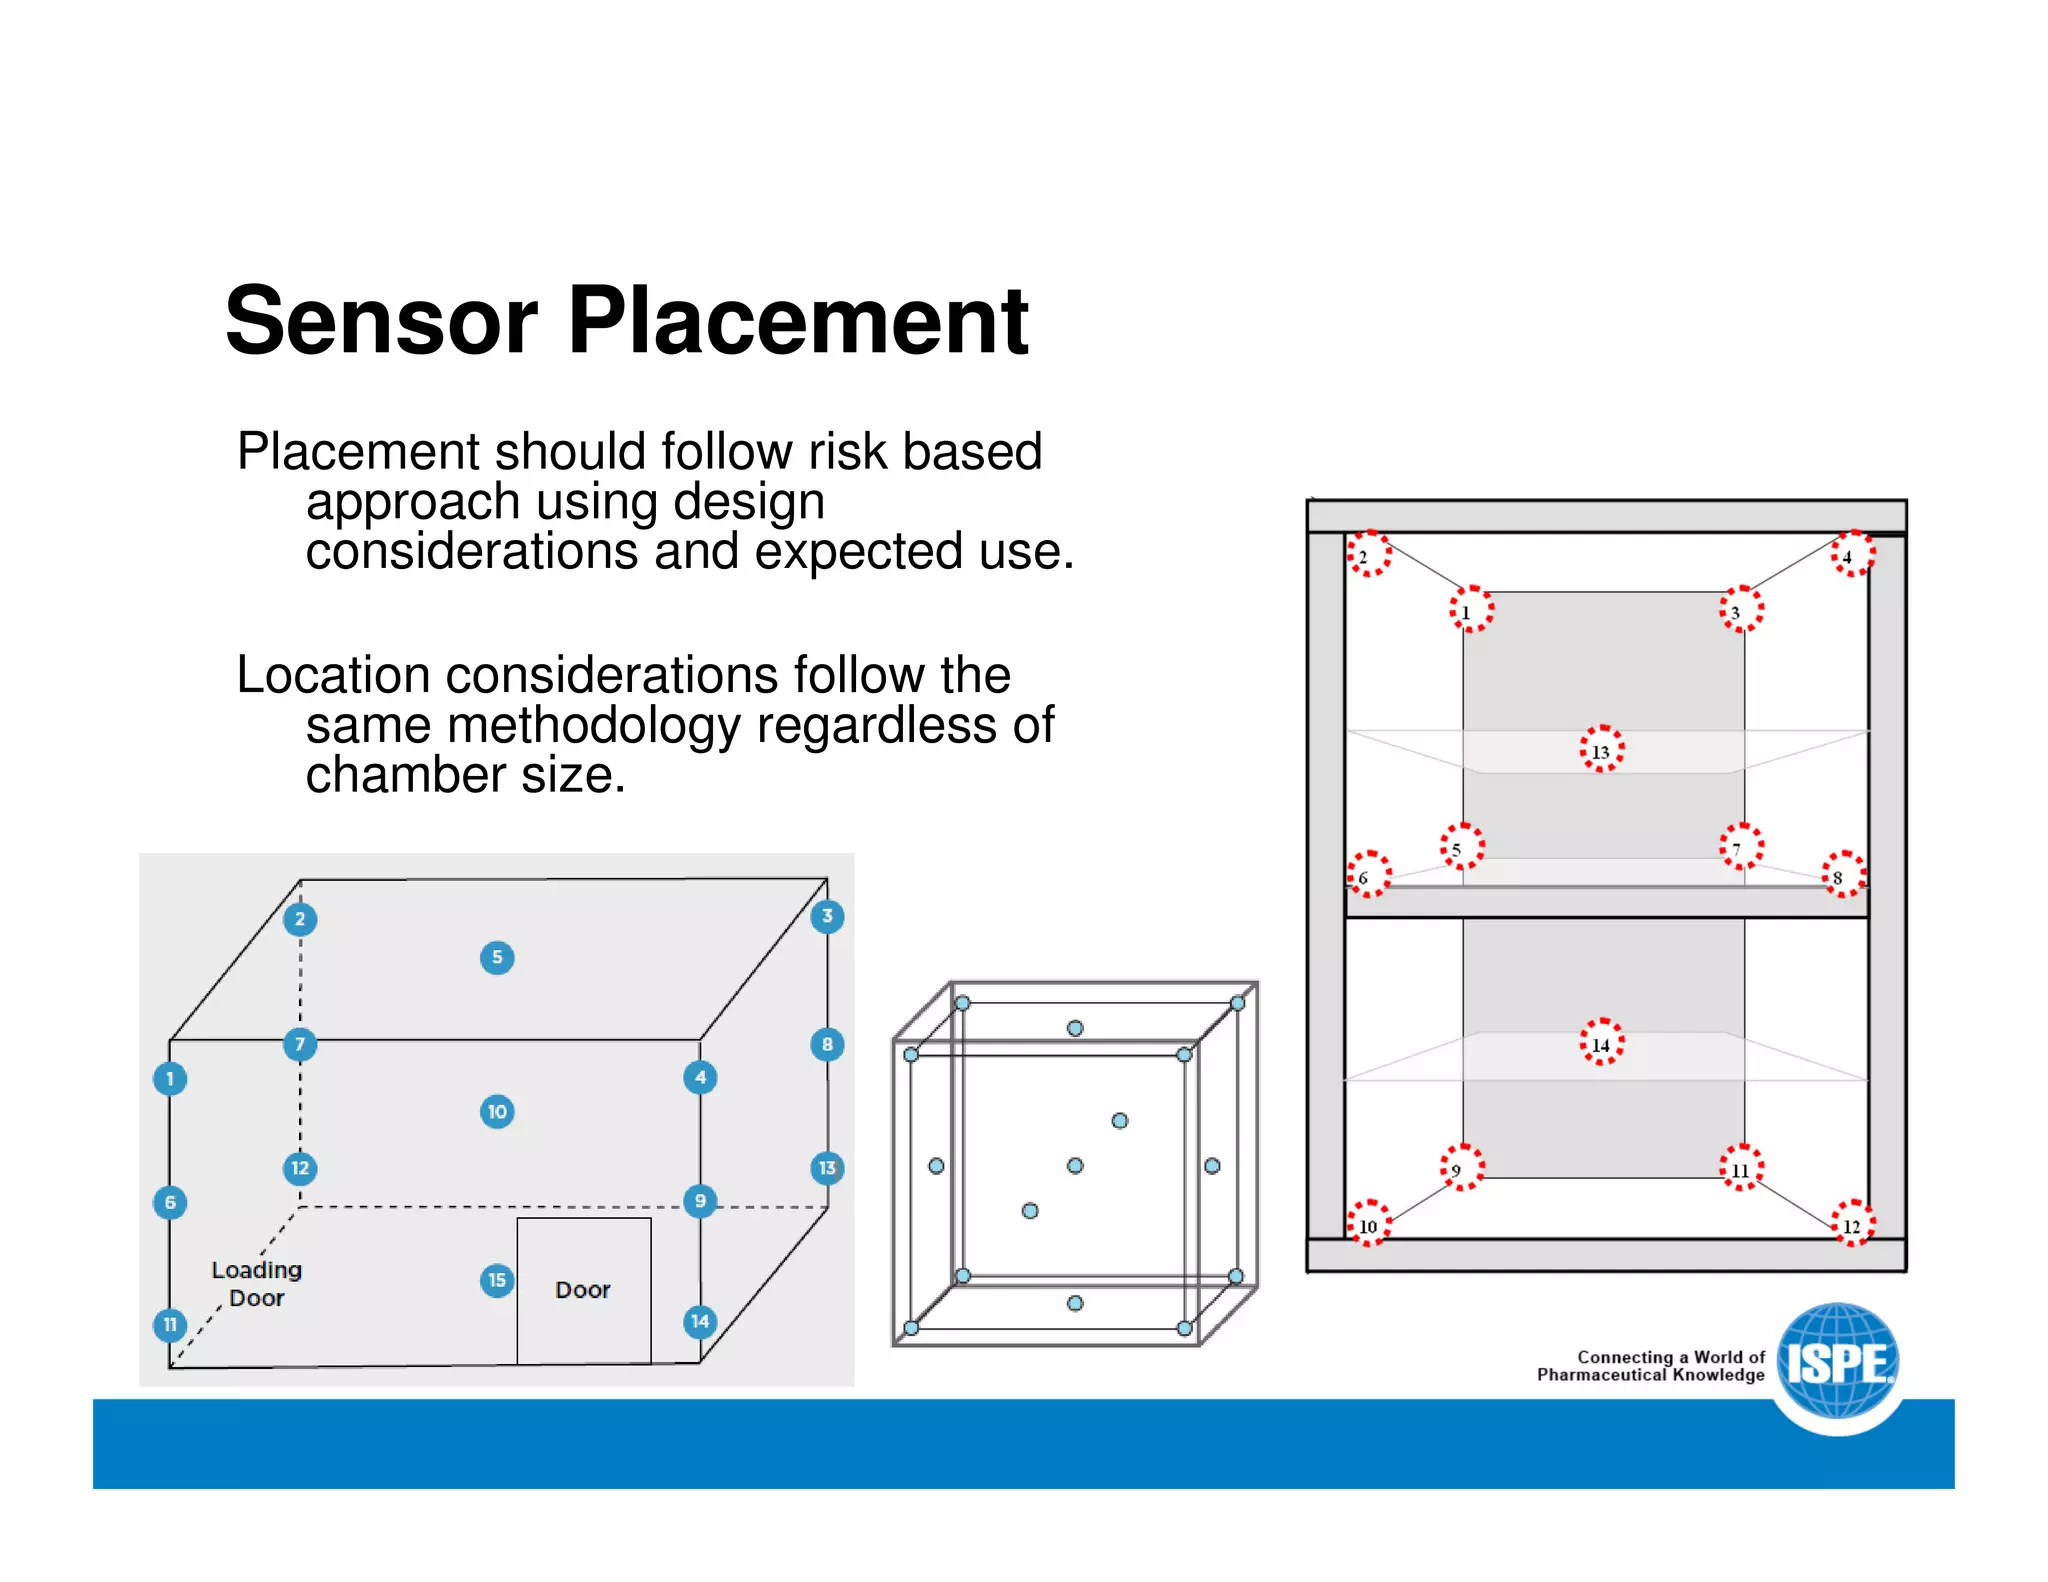
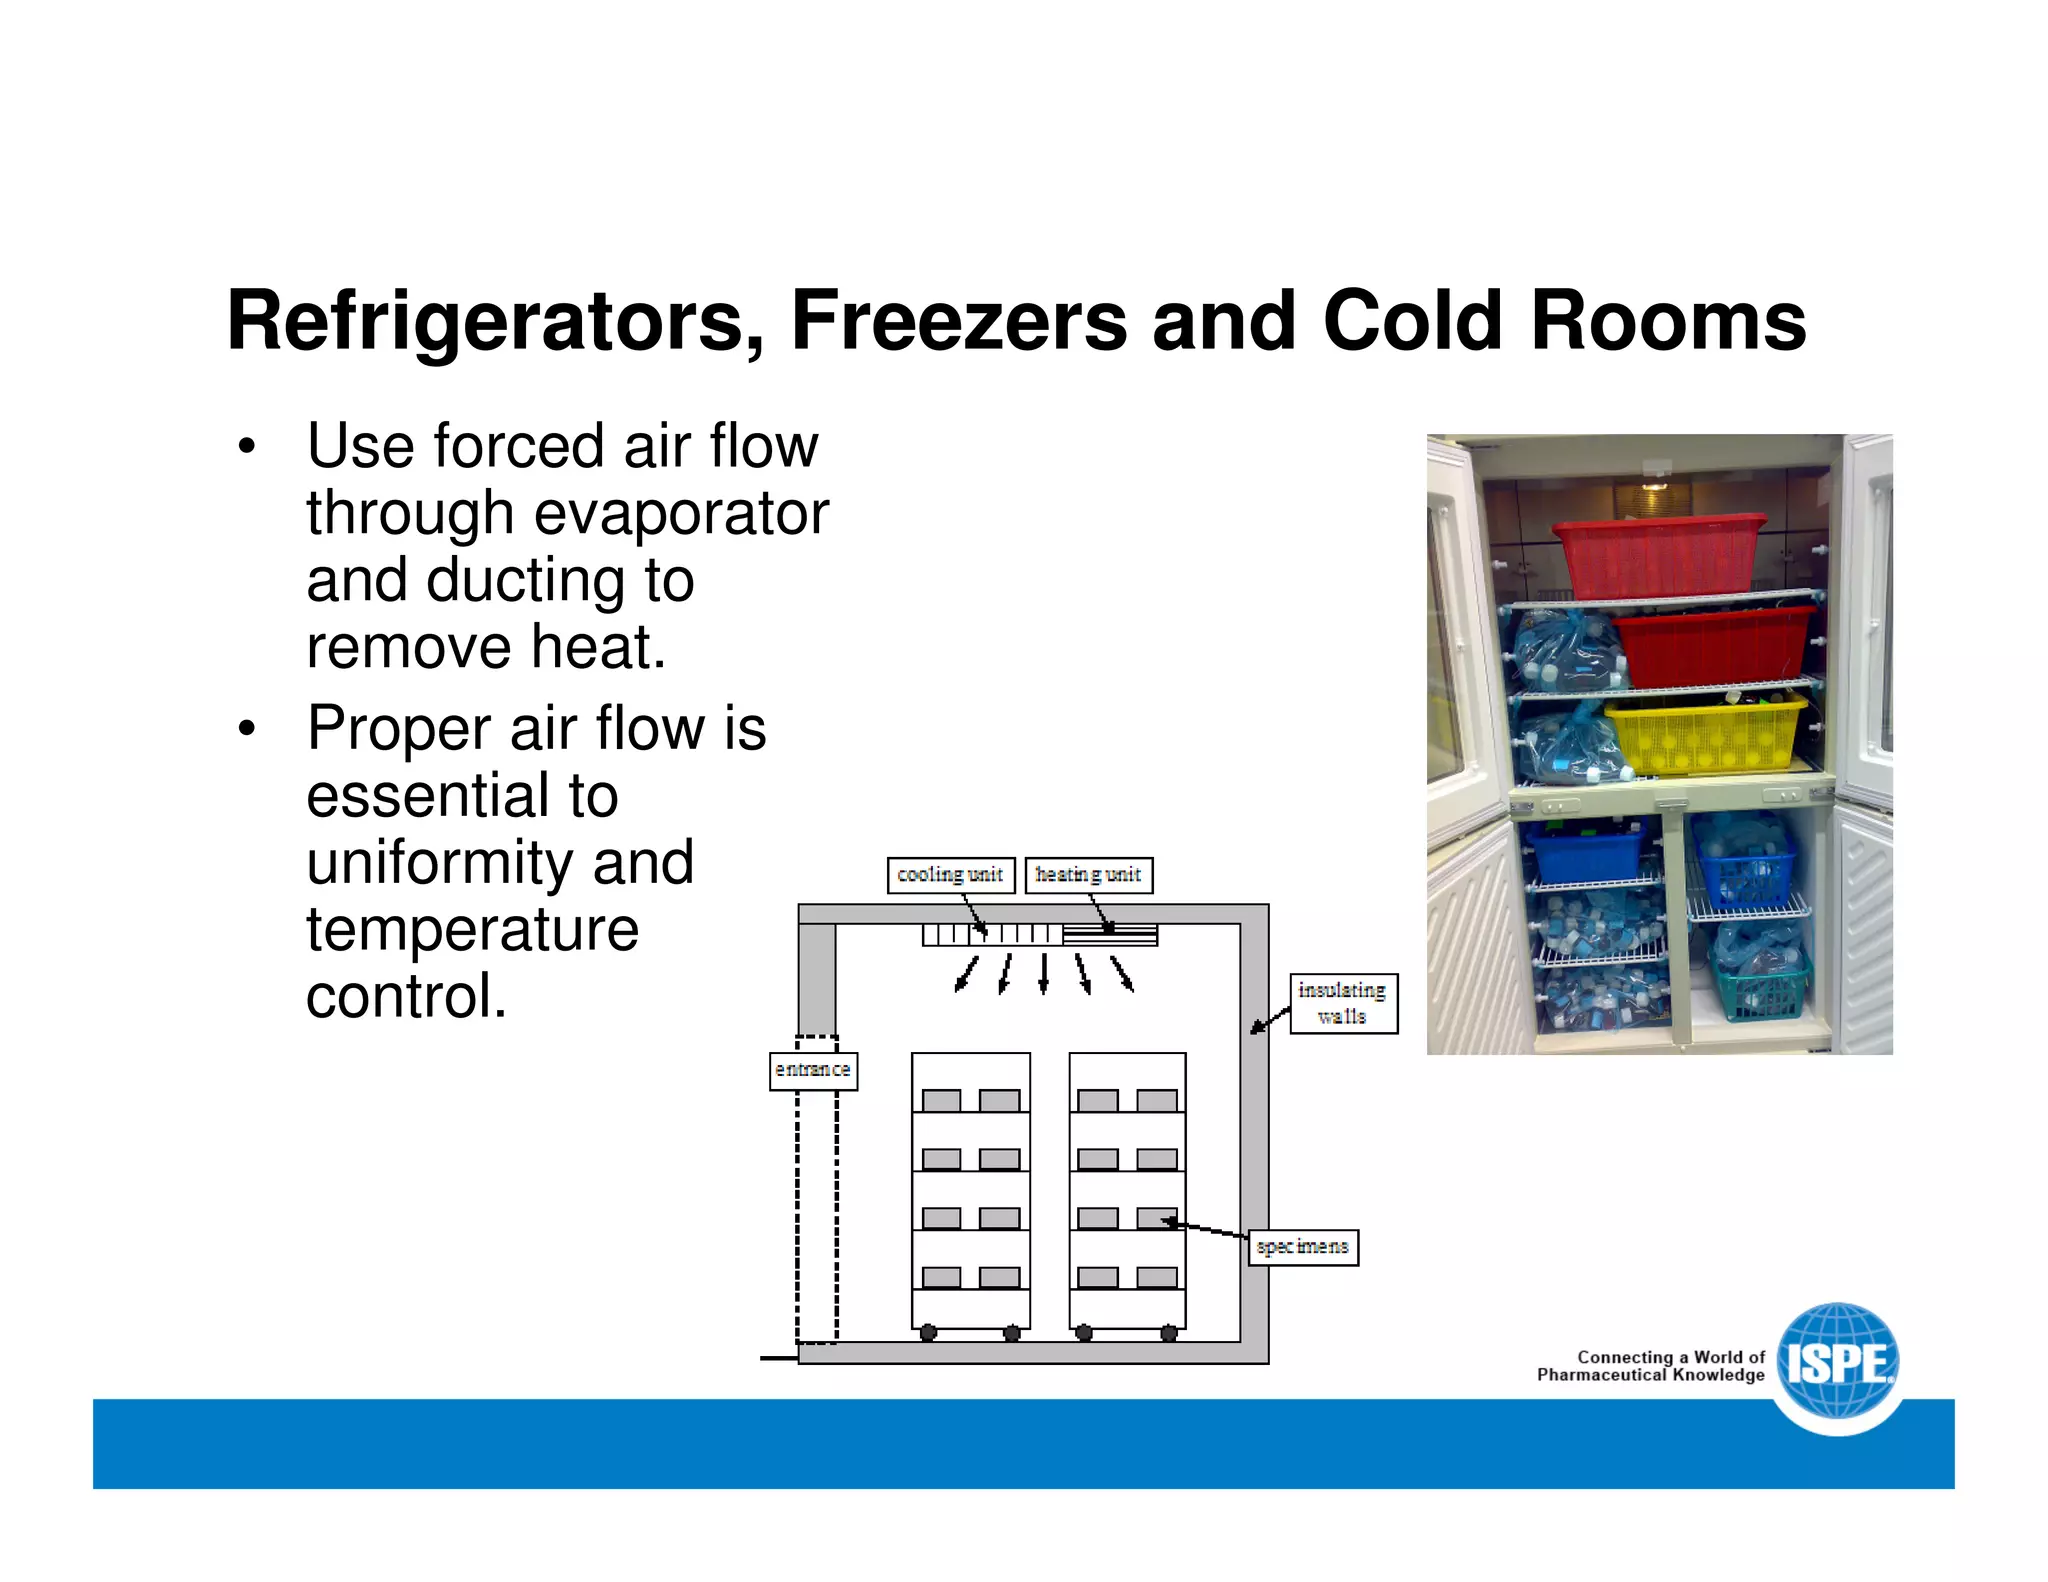
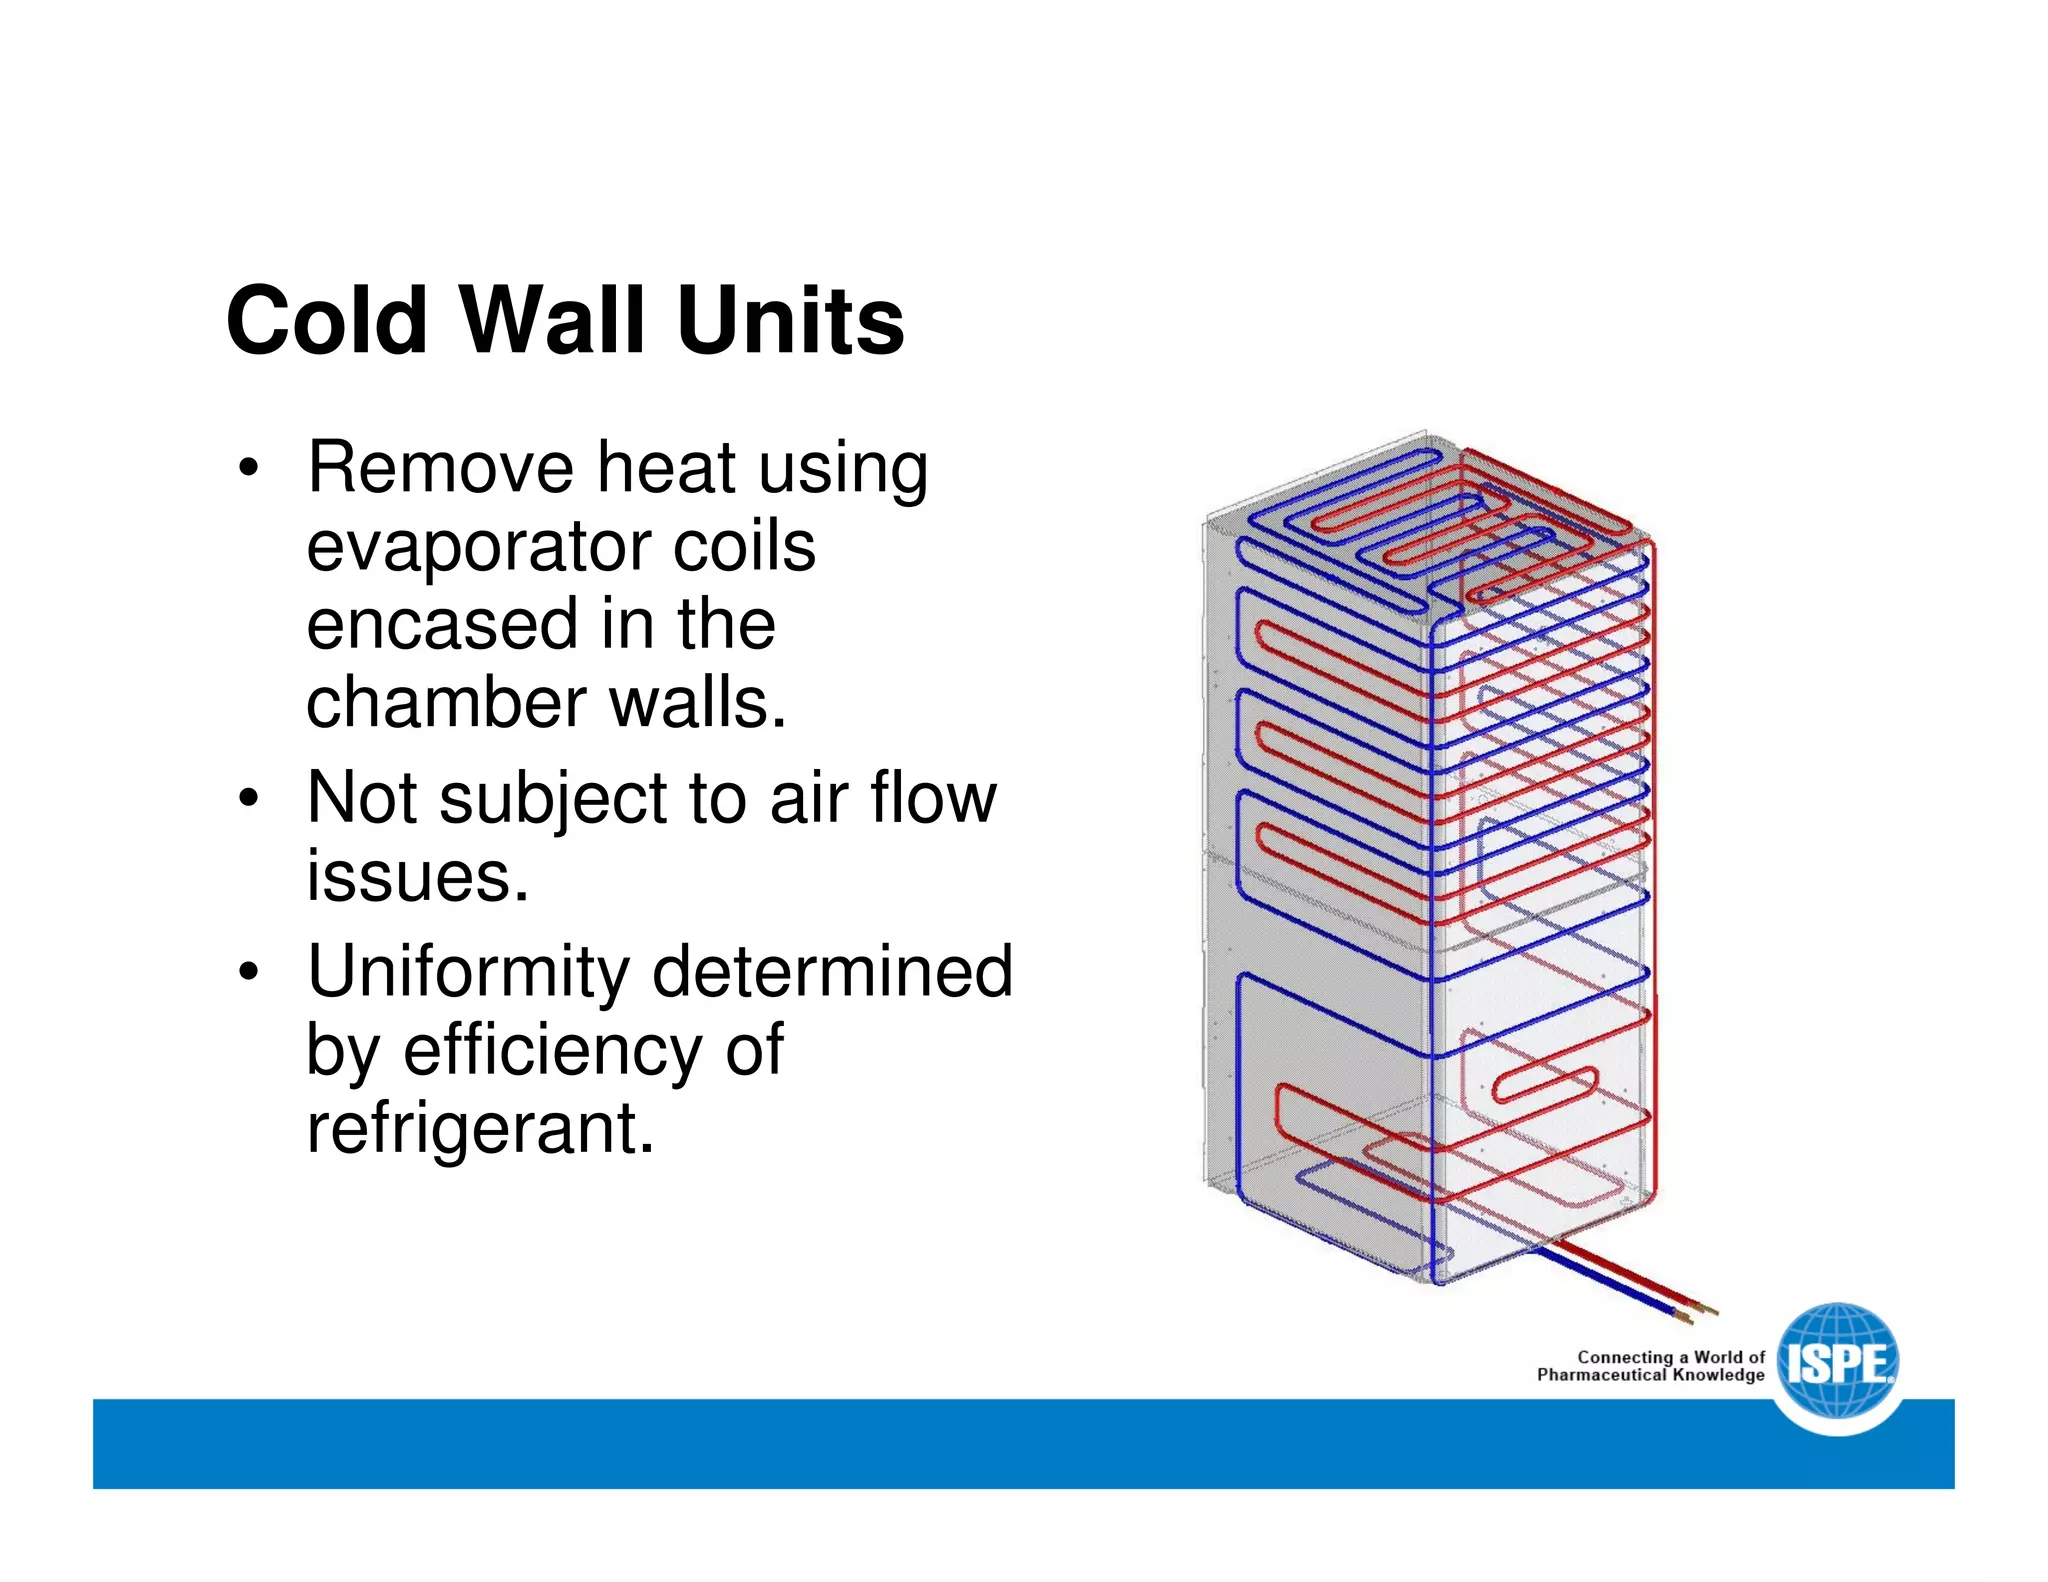
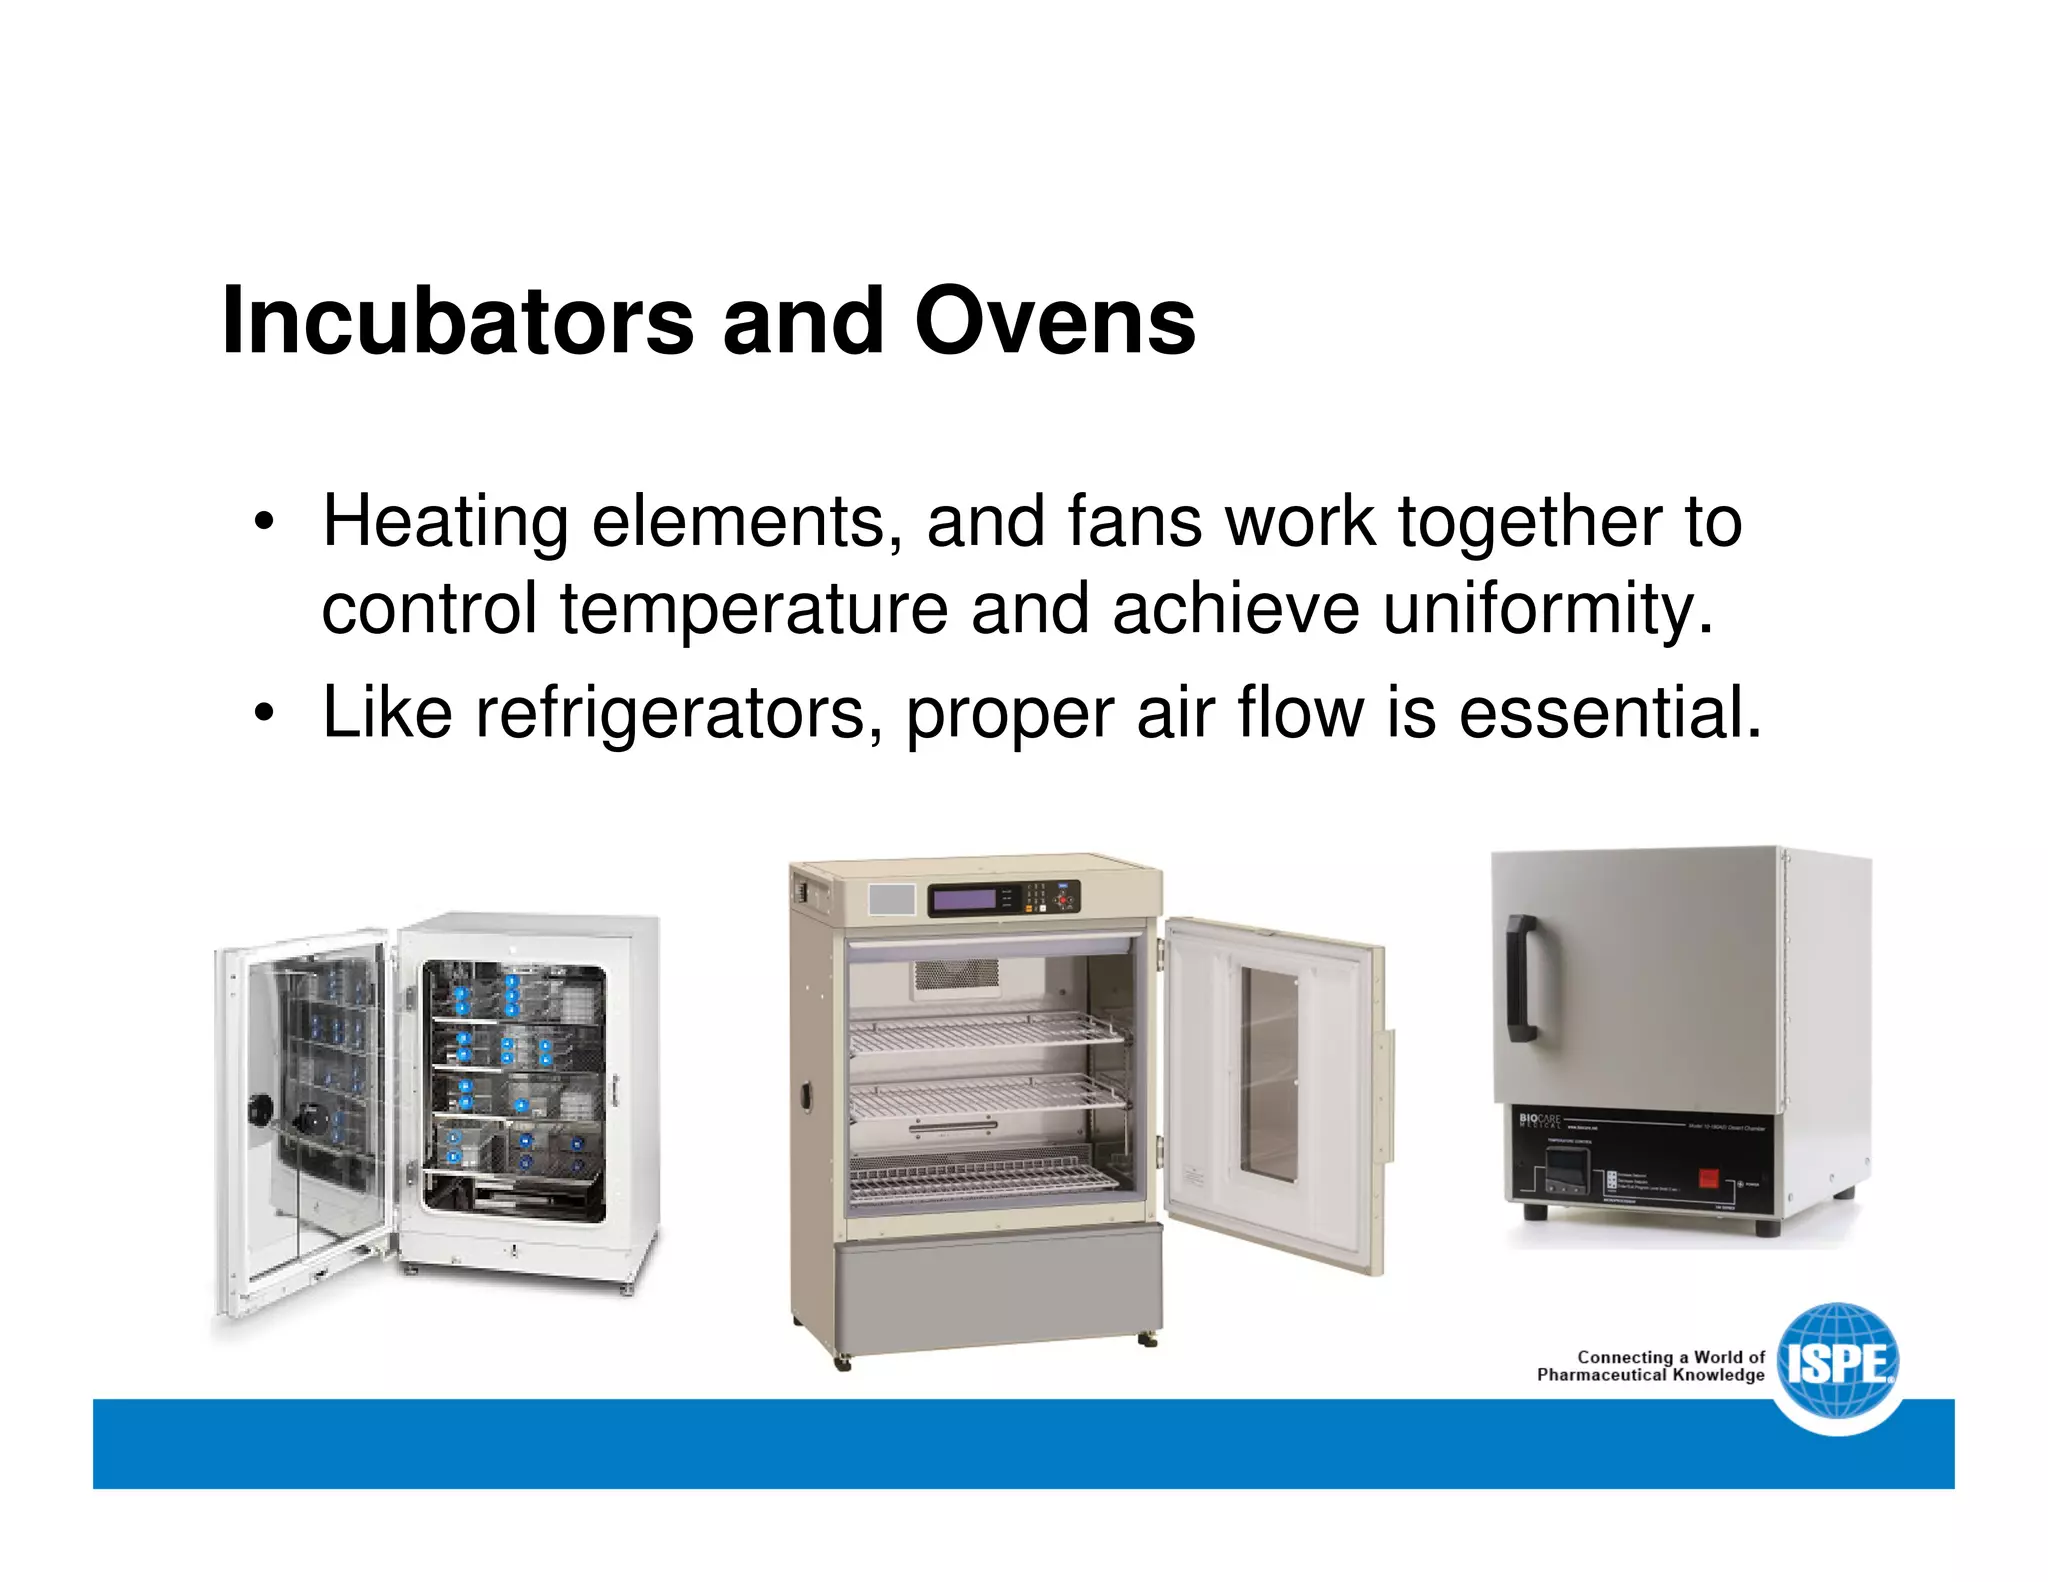
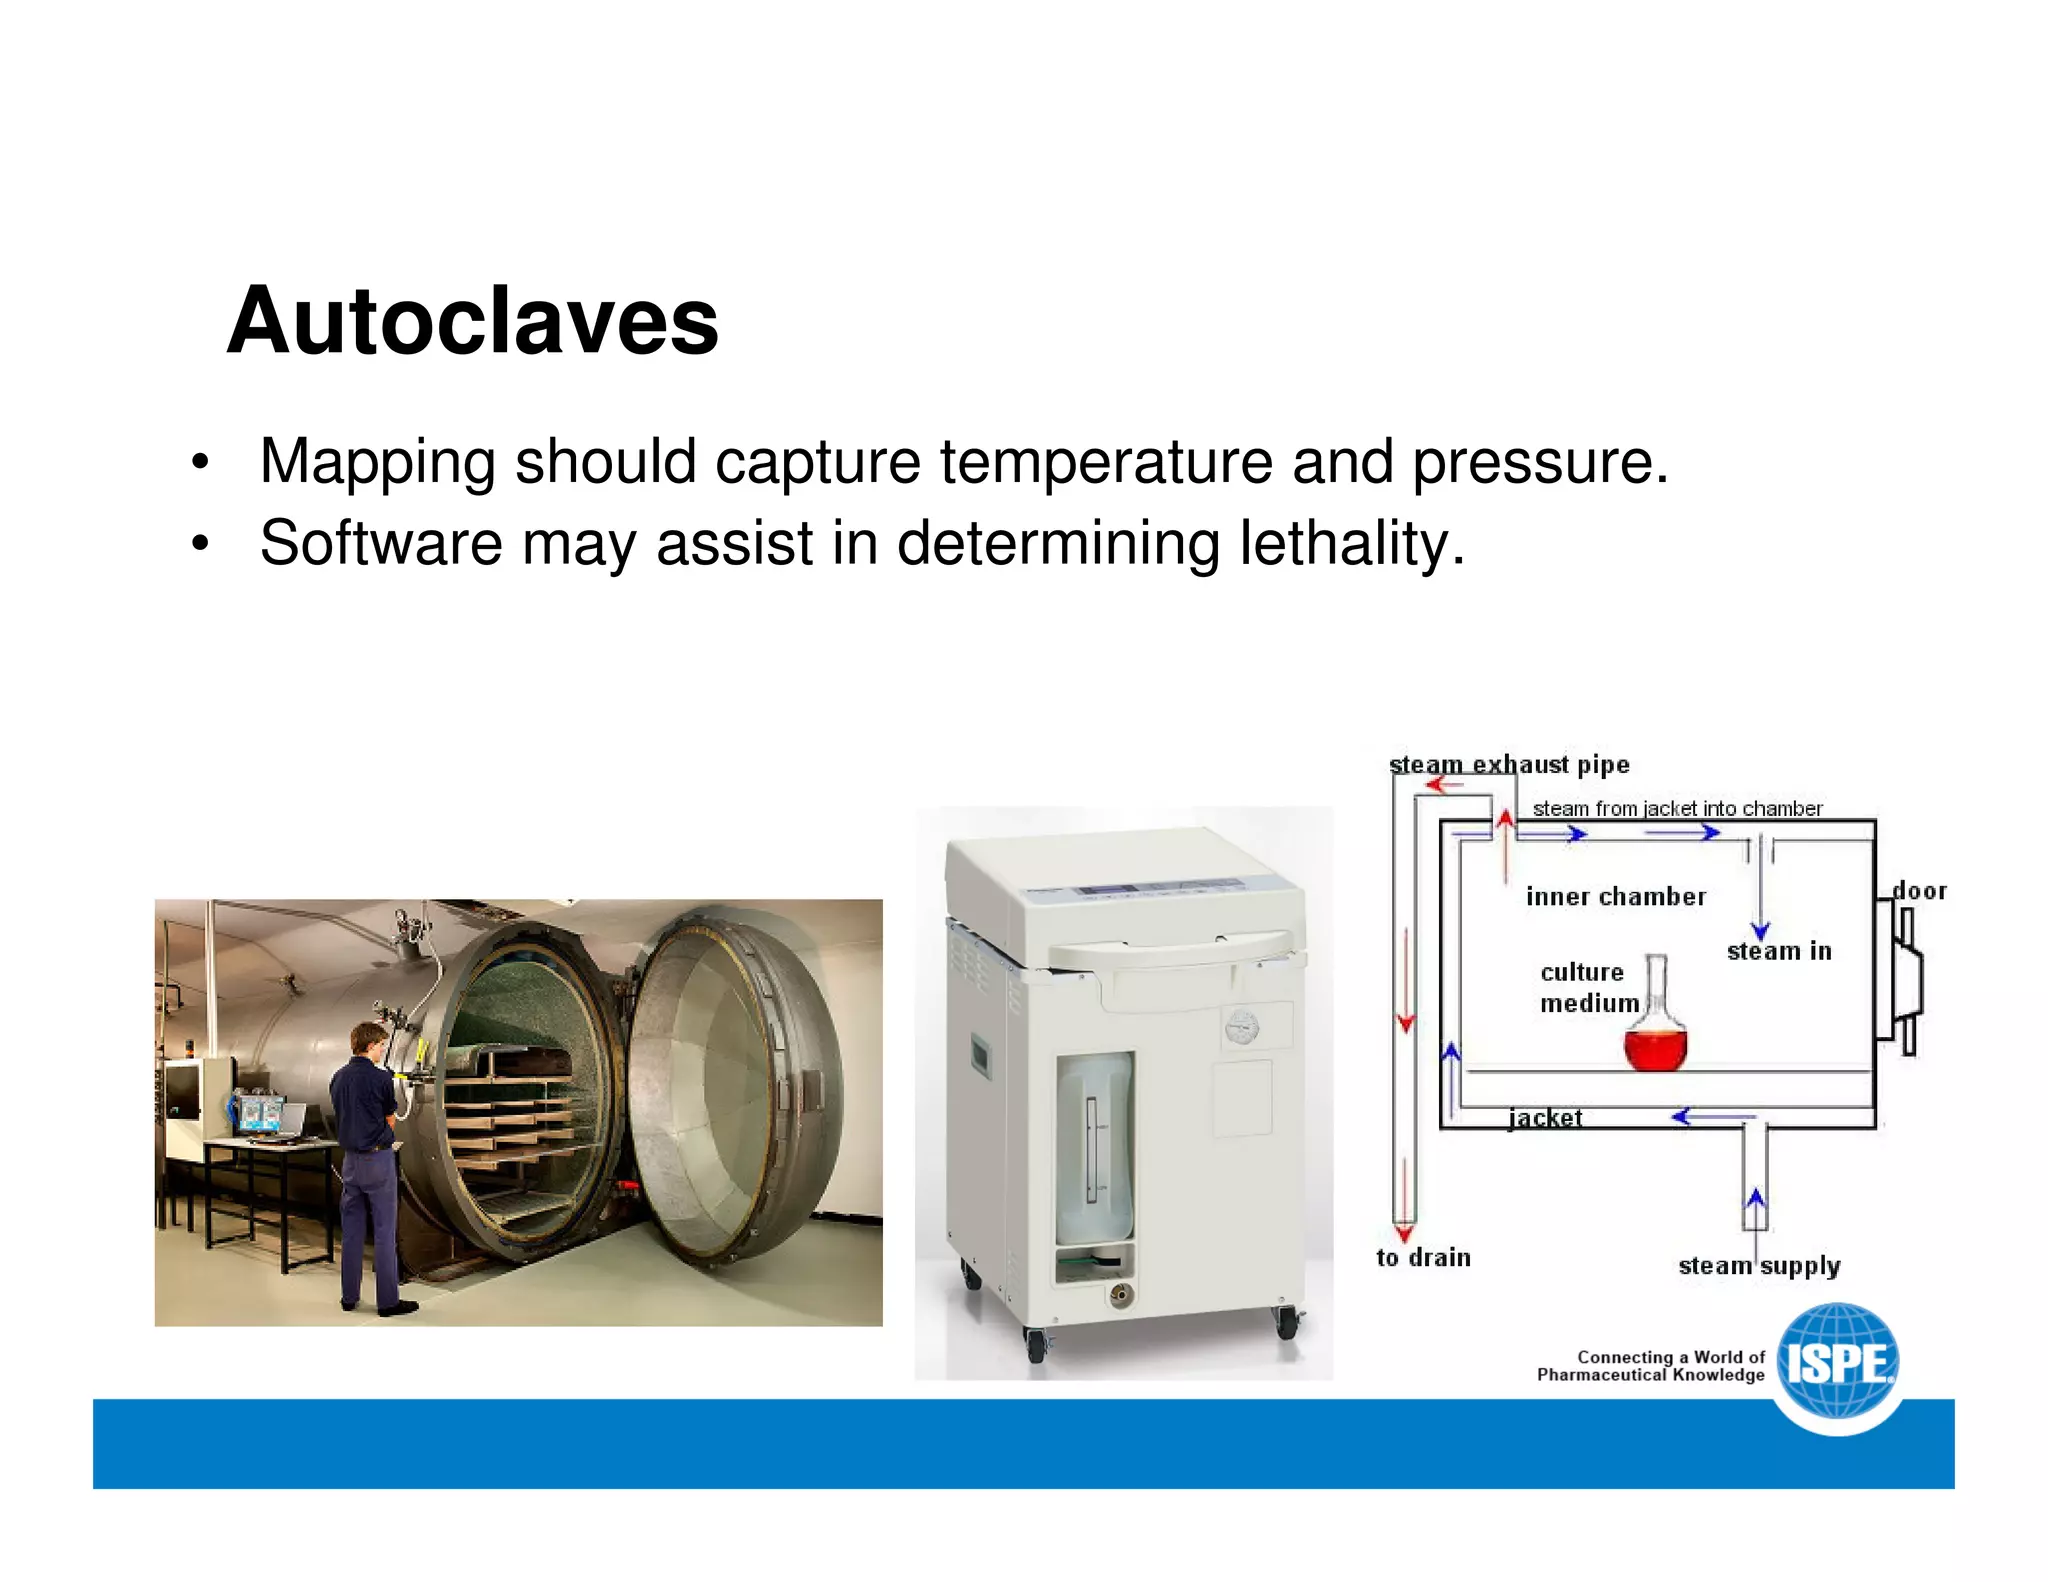
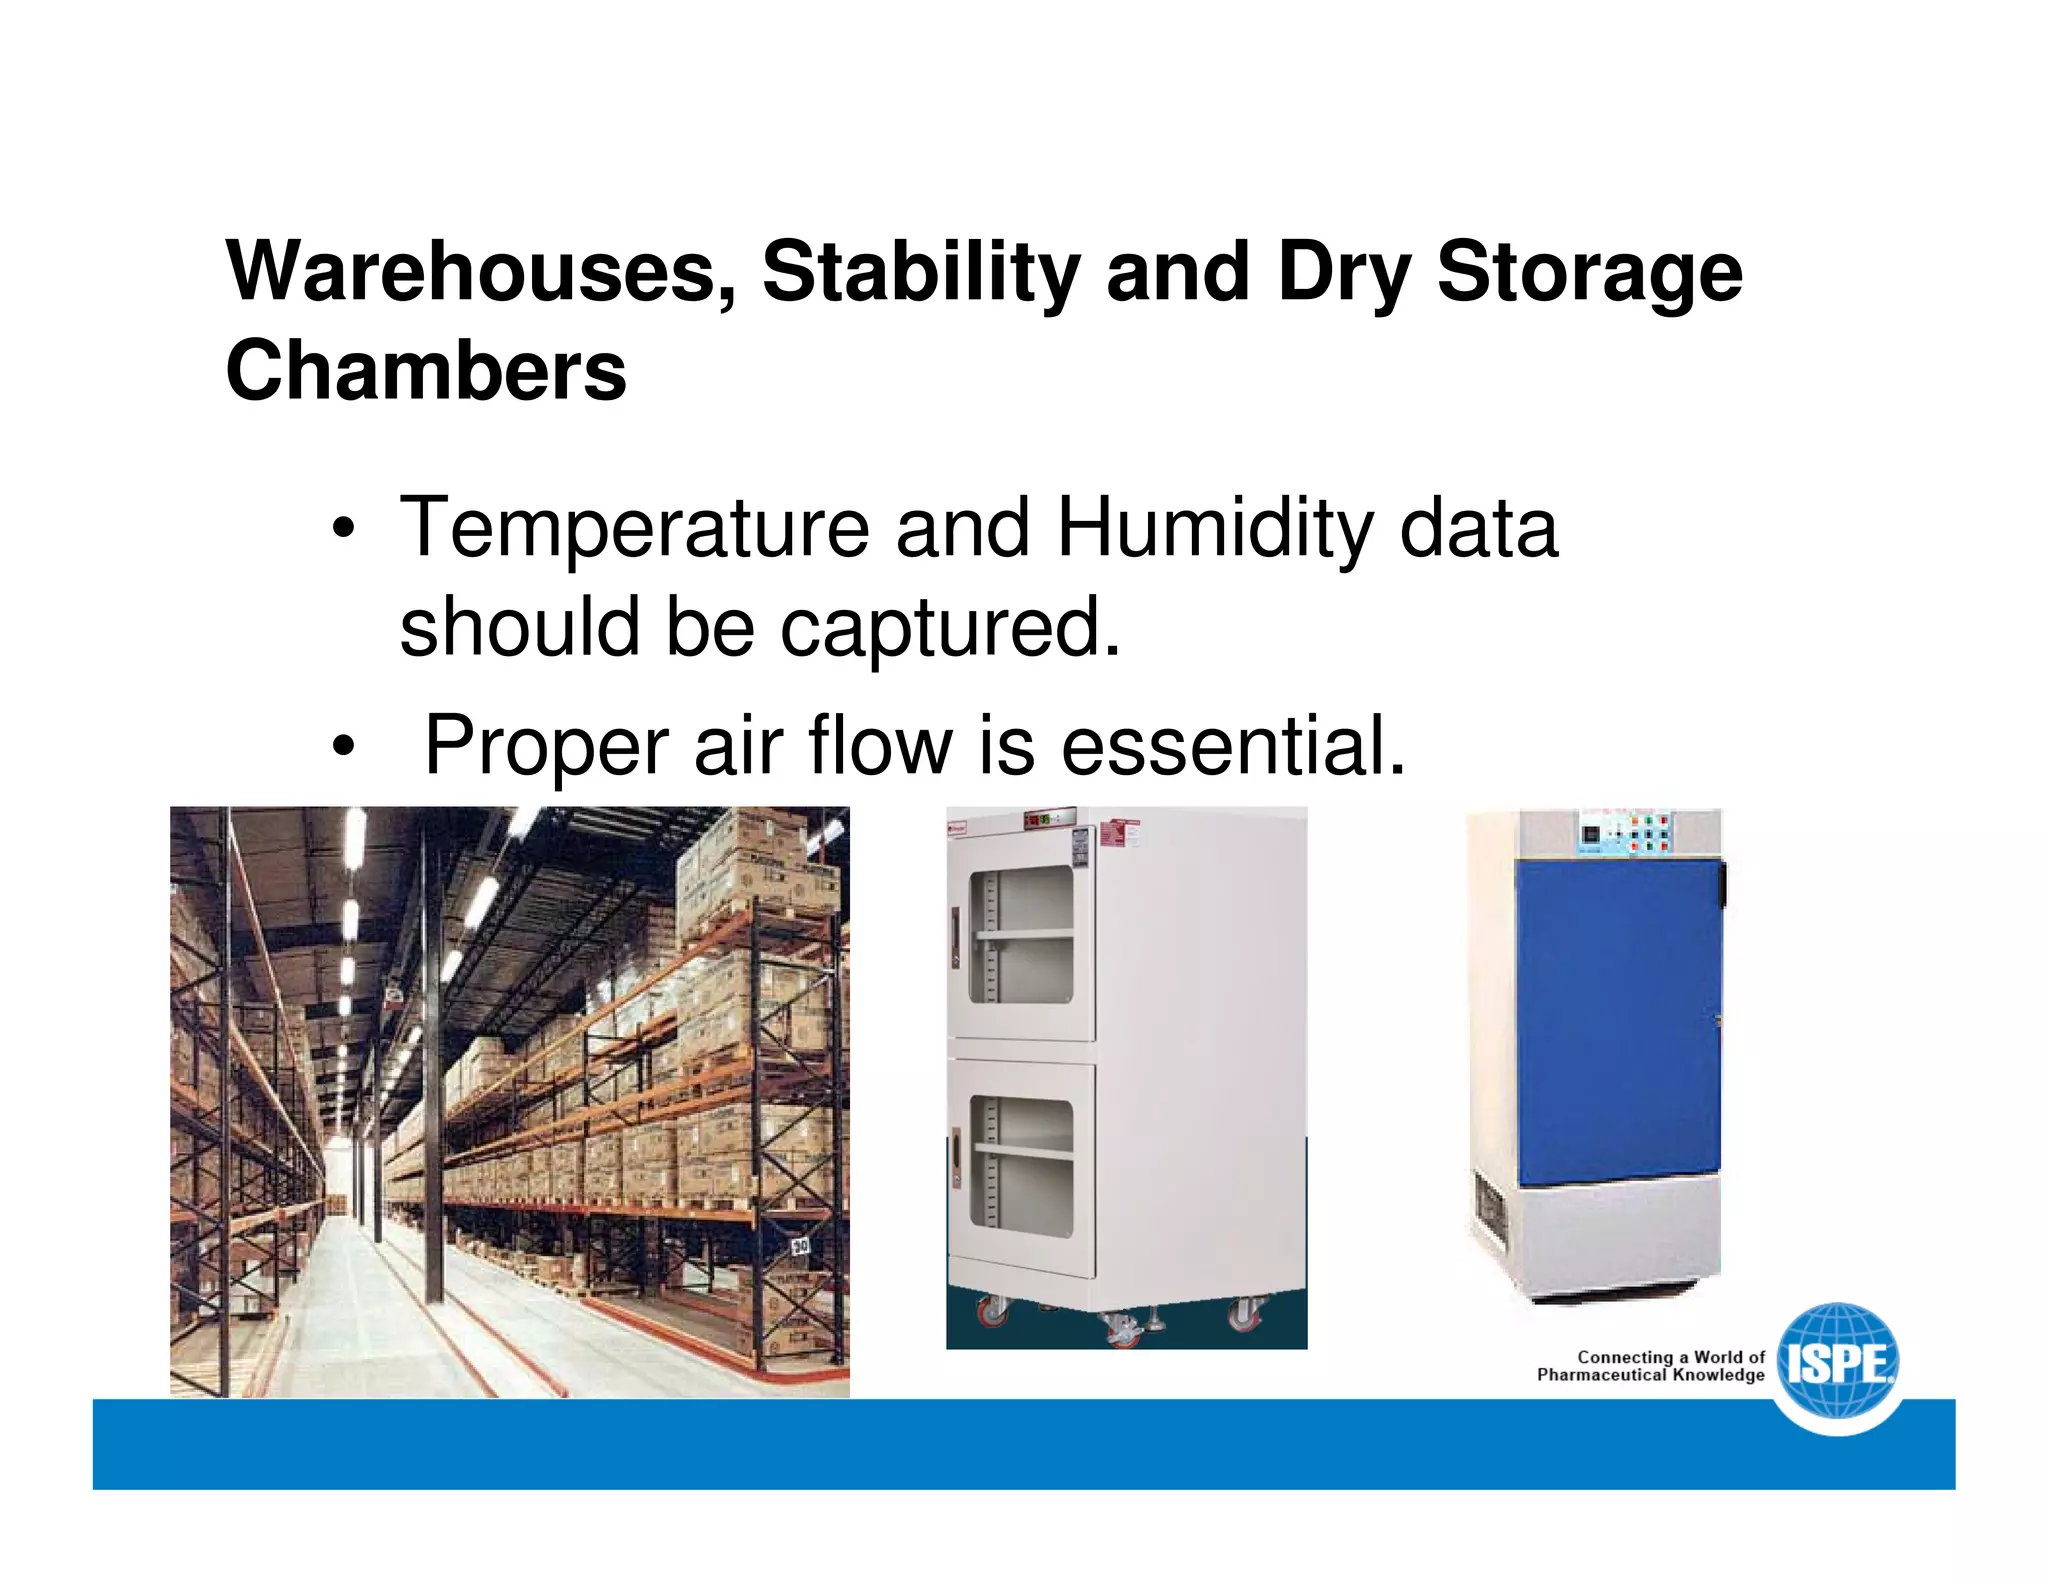
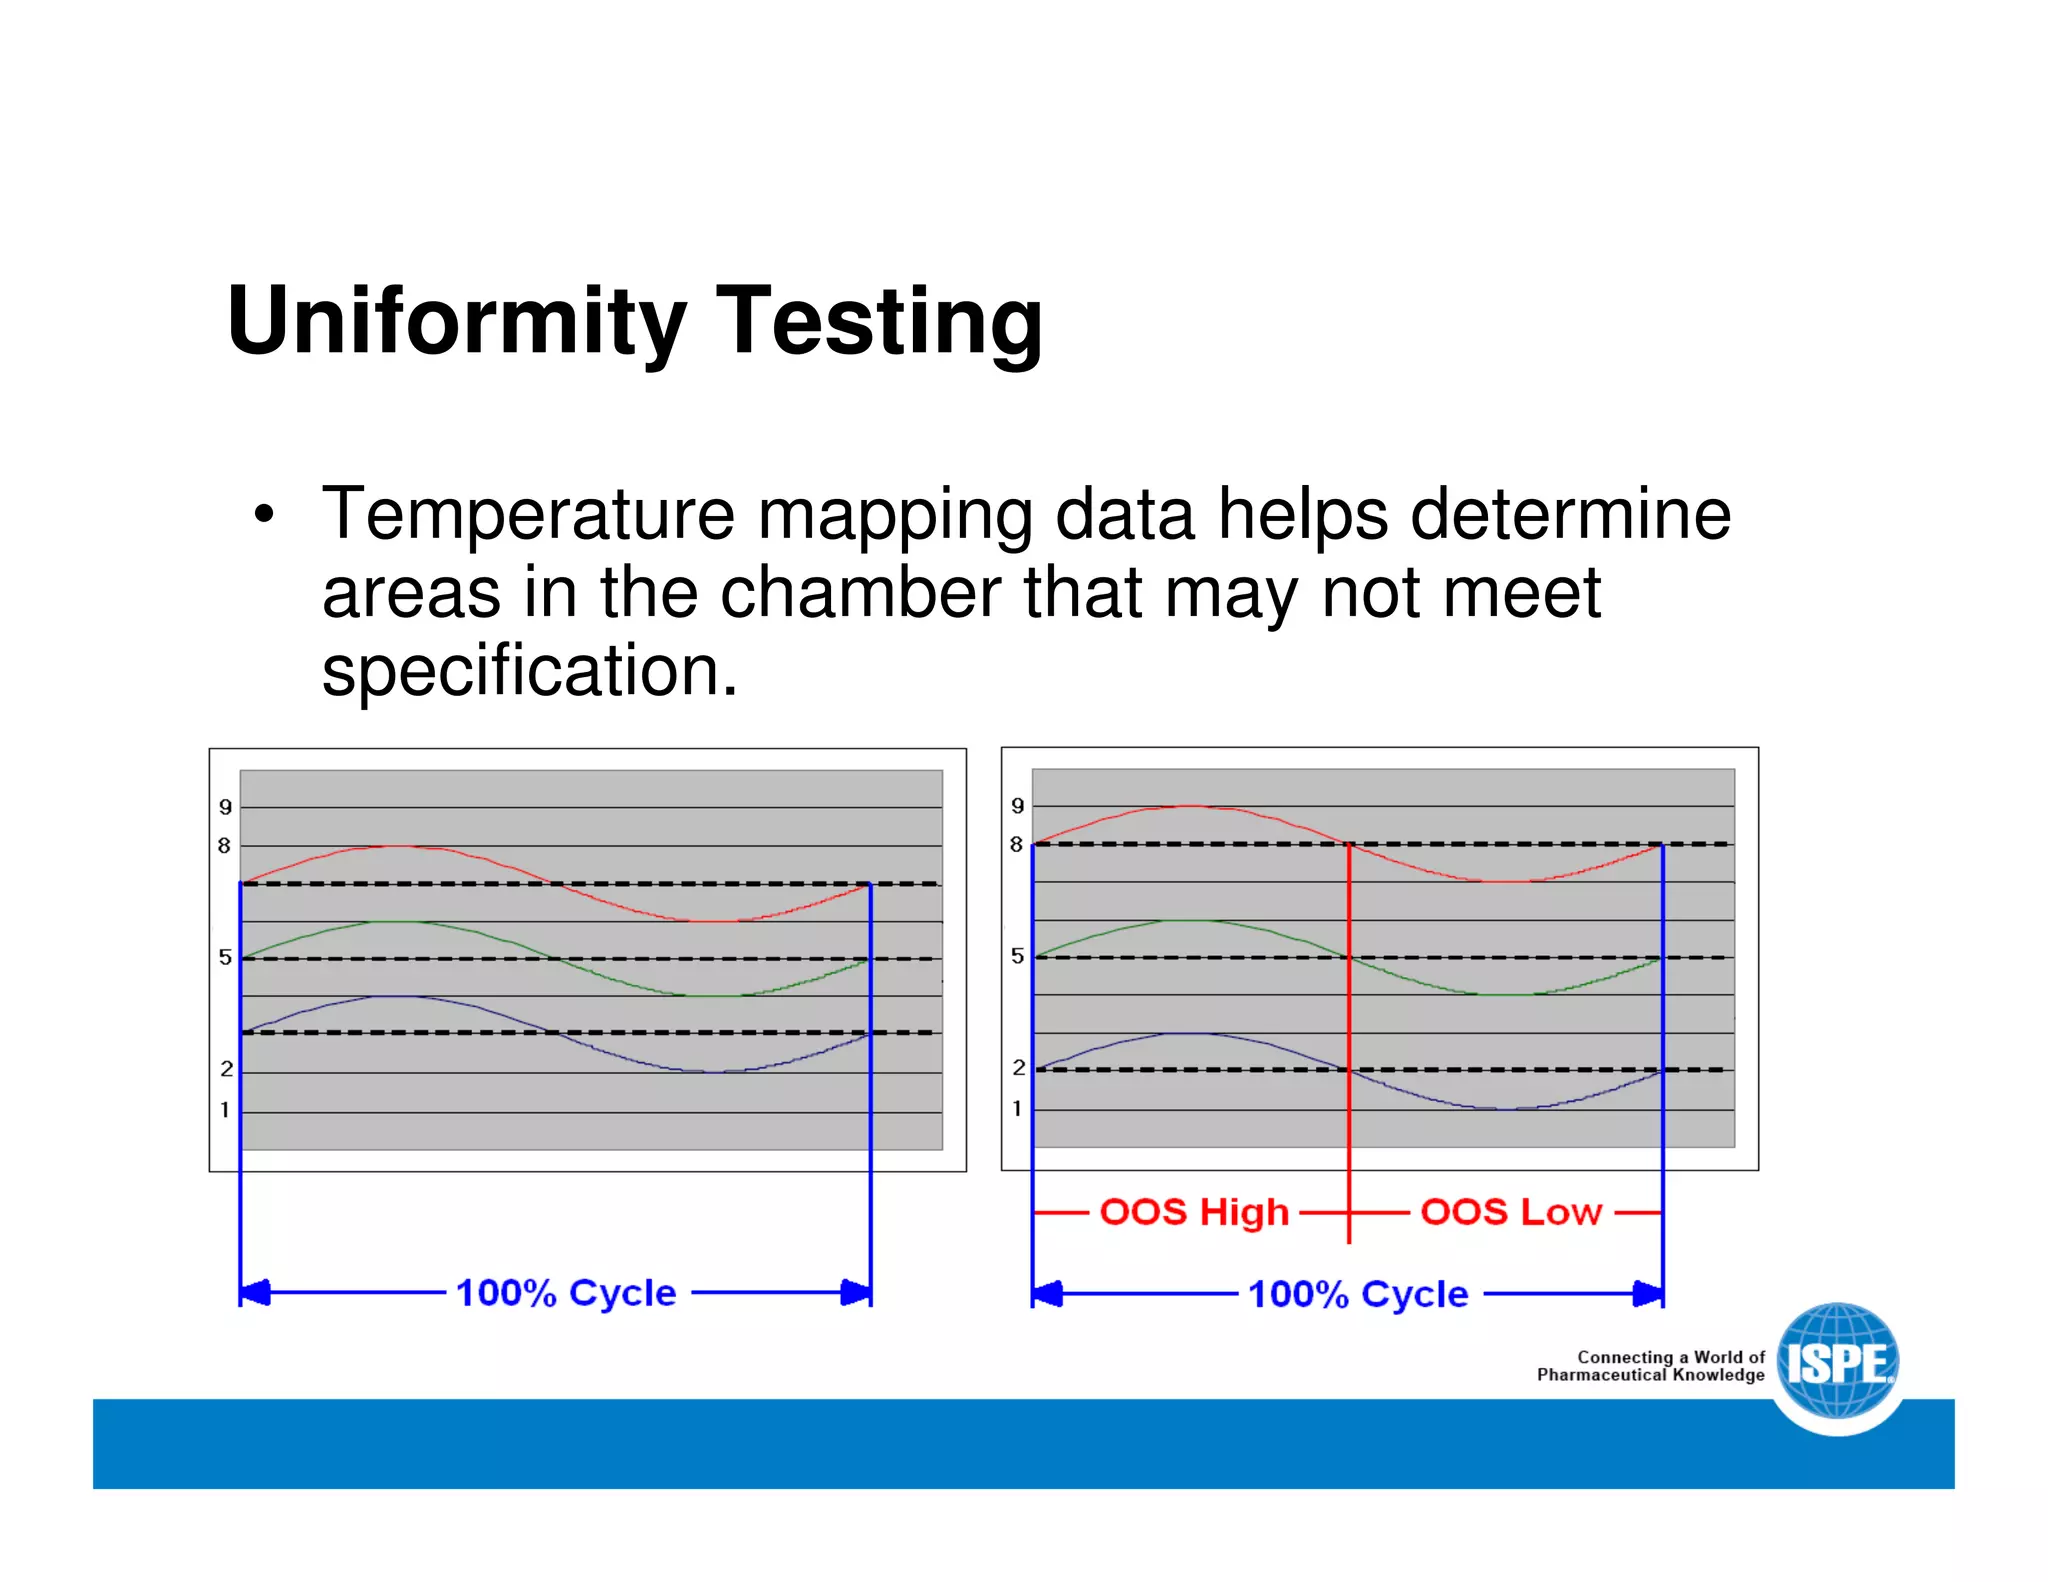
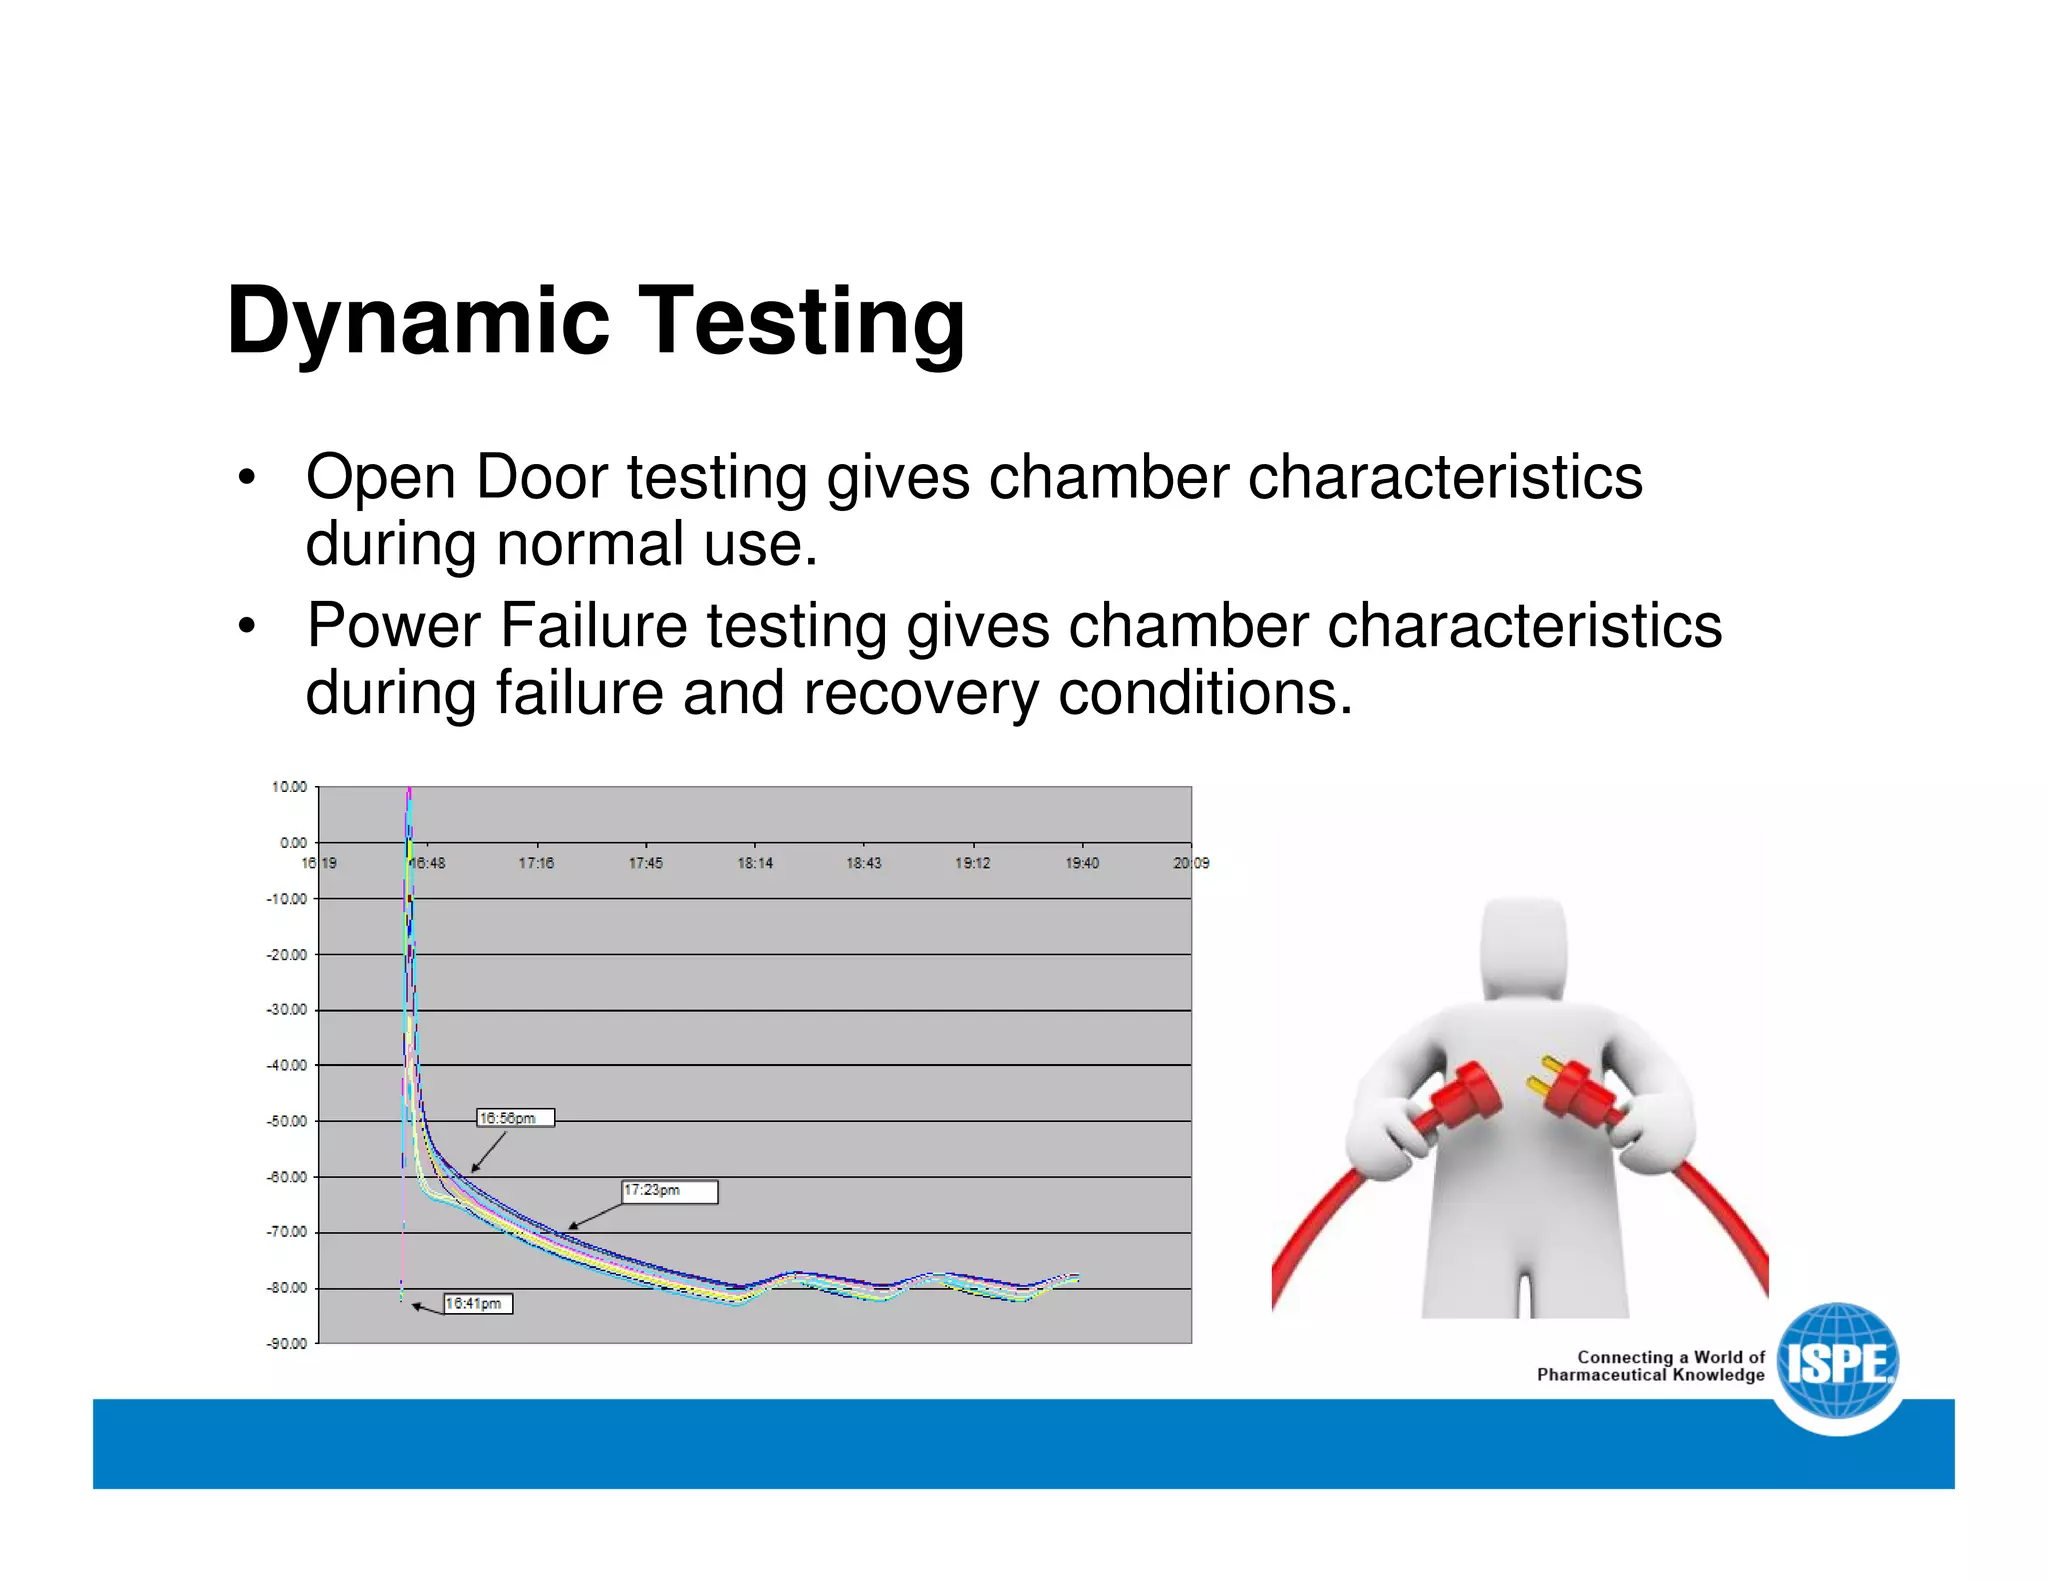
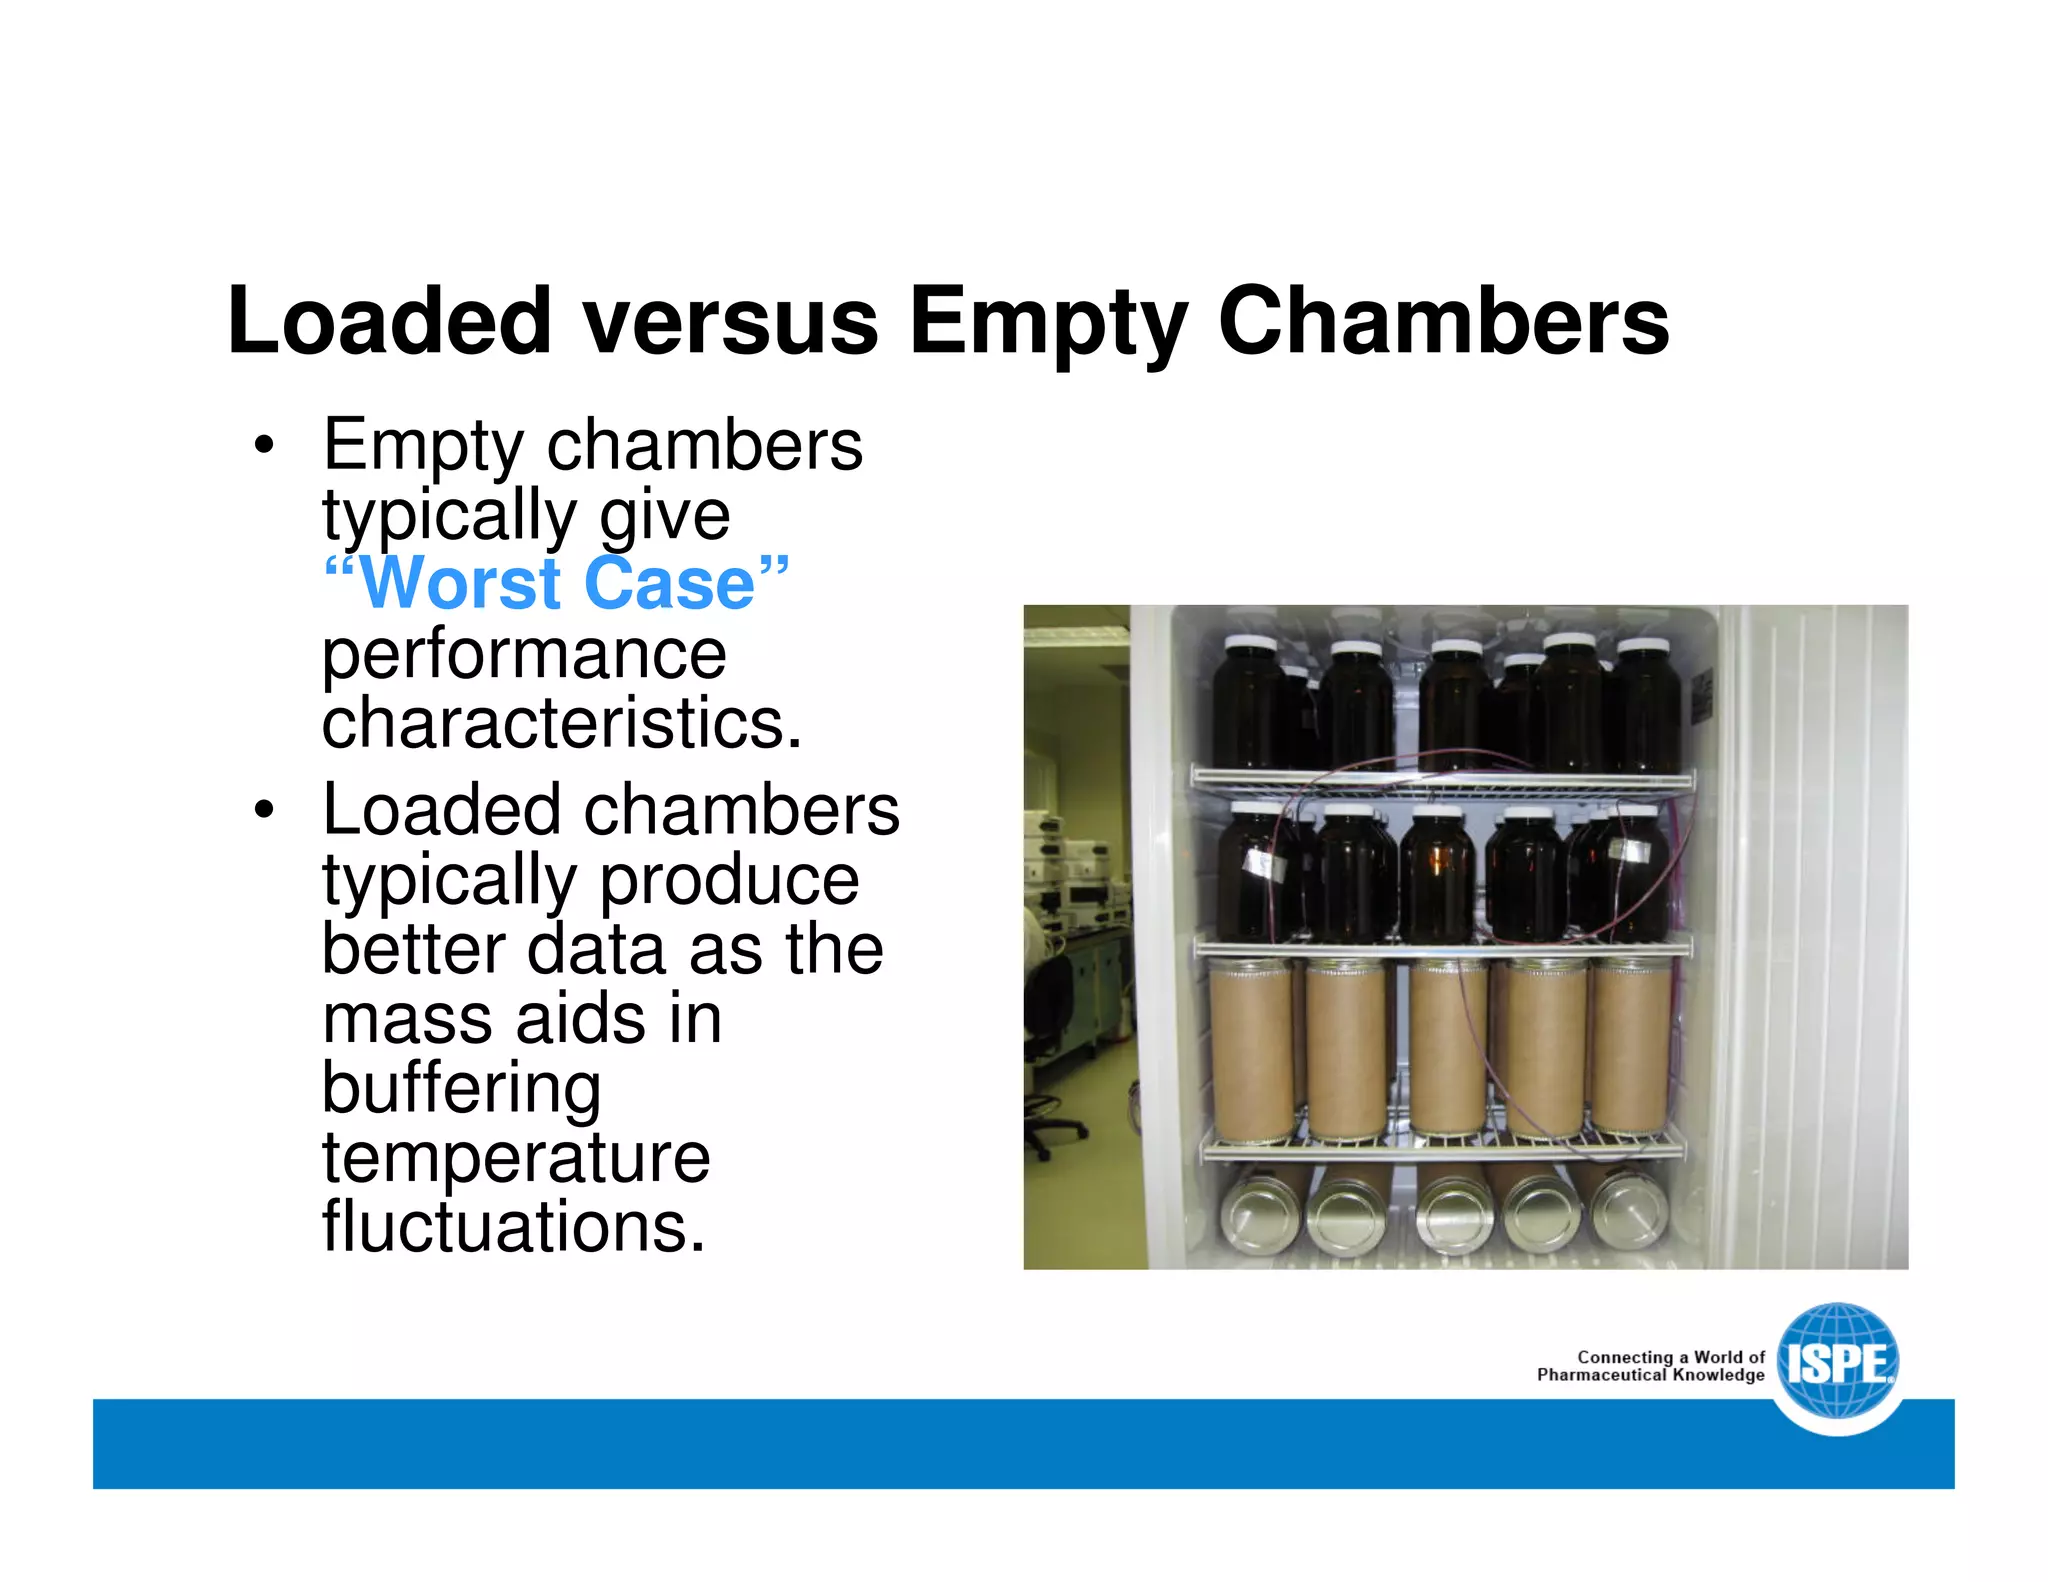
Temperature Mapping
Equipment, Procedures and Compliance
-
Kevin Loomis
Sr Validation Engineer
Panasonic Healthcare Corporation of NA
Temperature Mapping 101
Equipment and facilities are temperature
mapped to verify that they have the ability to
meet specified performance characteristics.
Specifications are established using URS, DS,
FS, regulatory compliance criteria and
established specifications for the products of
the application.
Planning
Step 1 – Determine Critical Mapping
Points
Step 2 – Determine Sample Rate
Step 3 – Establish Data Logger Criteria
Step 4 – Place Loggers at Pre
Determined Points
Step 5 – Capture, Retrieve and Evaluate
Logged Data
Step 6 – Document Processes (and
Repeat?)
Regulatory References and Guides
for Temperature Mapping
PIC/S GMP Guide Part I: Basic
Requirements for Medicinal
Program Sections 3.19 and 4.9
ISPE Good Practice Guide –
Cold Chain Management (2011)
ISPE Controlled Temperature
Chamber Mapping (2012)
ICH Q10 Pharmaceutical Quality
System (2009)
PIC/S GMP Guide Part II: Basic
Requirements for Active
Pharmaceutical Ingredients
Sections 7.42 and 10.1
21 CFR Part 820 cGMPs for
Medical Devices
21 CFR Part 820.150 Storage
PDA Technical Report No. 52 –
Guidance for Good Distribution
Practices for the Pharmaceutical
Supply Chain (2011)
21 CFR Part 211 cGMPs for
Finished Pharmaceuticals
USP Chapter 1079 Monitoring
Devices – Good Storage and
Shipping Practices (under
revision
2011)
21 CFR Part 210 cGMPs for
Manufacturing, Processing or
Holding of Drugs
Many guides tell you why to map, but don’t tell you how to map!
Reference ISPE doc above & IEC 60068-3-11 for methodology.
Temperature Mapping - Basic Equipment
Sensors & Systems
PRTDs, Thermocouples or Thermisters
connected to a recording device.
(NIST/ISO17025 Calibrated)
Software
for Data, Graphs and Analysis
(21 CFR Part 11 Compliant)
Differences in Equipment
• Wired and Wireless
• Loggers and Live
• Sensors
• Software
Equipment Advantages and
Disadvantages
• Wireless “loggers” are easy to set up, but
can’t be monitored live.
• Wireless “transmitters” can be monitored
live, but signal loss is a concern.
• Wired systems are robust, but often create
gaps in chamber seals. Limited to sensor
wire length.
• Integrated software may be easy to use, but
may not be regulatory compliant.
Sensors
Sensor types should be acceptable for the
accuracy and range of the device/system
being mapped.
Good for incubators, refrigerators, and
freezers.
1.0C or 0.75%
1.0C or 1.5%
>0 to 350C
-200 to 0C
T
OK for refrigerators and freezers,
unacceptable for incubators.
2.2C or 0.75%
2.2C or 2.0%
>0 to 1250C
-200 to 0C
K
OK for refrigerators, unacceptable for
incubators and not rated for freezers.
2.2C or 0.75%>0 to 750CJ
ApplicationStandard
Tolerance
Standard
Range
TC
Note: A calibrated mapping system will have increased accuracy to
that of standard.
Sensor Placement
Placement should follow risk based
approach using design
considerations and expected use.
Location considerations follow the
same methodology regardless of
chamber size.
Refrigerators, Freezers and Cold Rooms
• Use forced air flow
through evaporator
and ducting to
remove heat.
• Proper air flow is
essential to
uniformity and
temperature
control.
Cold Wall Units
• Remove heat using
evaporator coils
encased in the
chamber walls.
• Not subject to air flow
issues.
• Uniformity determined
by efficiency of
refrigerant.
Incubators and Ovens
• Heating elements, and fans work together to
control temperature and achieve uniformity.
• Like refrigerators, proper air flow is essential.
Autoclaves
• Mapping should capture temperature and pressure.
• Software may assist in determining lethality.
Warehouses, Stability and Dry Storage
Chambers
• Temperature and Humidity data
should be captured.
• Proper air flow is essential.
Uniformity Testing
• Temperature mapping data helps determine
areas in the chamber that may not meet
specification.
Dynamic Testing
• Open Door testing gives chamber characteristics
during normal use.
• Power Failure testing gives chamber characteristics
during failure and recovery conditions.
Loaded versus Empty Chambers
• Empty chambers
typically give
“Worst Case”
performance
characteristics.
• Loaded chambers
typically produce
better data as the
mass aids in
buffering
temperature
fluctuations.
Temperature Mapping - Kevin Loomis

Temperature Mapping - Kevin Loomis

  • 1.
    Temperature Mapping Equipment, Proceduresand Compliance - Kevin Loomis Sr Validation Engineer Panasonic Healthcare Corporation of NA
  • 2.
    Temperature Mapping 101 Equipmentand facilities are temperature mapped to verify that they have the ability to meet specified performance characteristics. Specifications are established using URS, DS, FS, regulatory compliance criteria and established specifications for the products of the application.
  • 3.
    Planning Step 1 –Determine Critical Mapping Points Step 2 – Determine Sample Rate Step 3 – Establish Data Logger Criteria Step 4 – Place Loggers at Pre Determined Points Step 5 – Capture, Retrieve and Evaluate Logged Data Step 6 – Document Processes (and Repeat?)
  • 4.
    Regulatory References andGuides for Temperature Mapping PIC/S GMP Guide Part I: Basic Requirements for Medicinal Program Sections 3.19 and 4.9 ISPE Good Practice Guide – Cold Chain Management (2011) ISPE Controlled Temperature Chamber Mapping (2012) ICH Q10 Pharmaceutical Quality System (2009) PIC/S GMP Guide Part II: Basic Requirements for Active Pharmaceutical Ingredients Sections 7.42 and 10.1 21 CFR Part 820 cGMPs for Medical Devices 21 CFR Part 820.150 Storage PDA Technical Report No. 52 – Guidance for Good Distribution Practices for the Pharmaceutical Supply Chain (2011) 21 CFR Part 211 cGMPs for Finished Pharmaceuticals USP Chapter 1079 Monitoring Devices – Good Storage and Shipping Practices (under revision 2011) 21 CFR Part 210 cGMPs for Manufacturing, Processing or Holding of Drugs Many guides tell you why to map, but don’t tell you how to map! Reference ISPE doc above & IEC 60068-3-11 for methodology.
  • 5.
    Temperature Mapping -Basic Equipment Sensors & Systems PRTDs, Thermocouples or Thermisters connected to a recording device. (NIST/ISO17025 Calibrated) Software for Data, Graphs and Analysis (21 CFR Part 11 Compliant)
  • 6.
    Differences in Equipment •Wired and Wireless • Loggers and Live • Sensors • Software
  • 7.
    Equipment Advantages and Disadvantages •Wireless “loggers” are easy to set up, but can’t be monitored live. • Wireless “transmitters” can be monitored live, but signal loss is a concern. • Wired systems are robust, but often create gaps in chamber seals. Limited to sensor wire length. • Integrated software may be easy to use, but may not be regulatory compliant.
  • 8.
    Sensors Sensor types shouldbe acceptable for the accuracy and range of the device/system being mapped. Good for incubators, refrigerators, and freezers. 1.0C or 0.75% 1.0C or 1.5% >0 to 350C -200 to 0C T OK for refrigerators and freezers, unacceptable for incubators. 2.2C or 0.75% 2.2C or 2.0% >0 to 1250C -200 to 0C K OK for refrigerators, unacceptable for incubators and not rated for freezers. 2.2C or 0.75%>0 to 750CJ ApplicationStandard Tolerance Standard Range TC Note: A calibrated mapping system will have increased accuracy to that of standard.
  • 9.
    Sensor Placement Placement shouldfollow risk based approach using design considerations and expected use. Location considerations follow the same methodology regardless of chamber size.
  • 10.
    Refrigerators, Freezers andCold Rooms • Use forced air flow through evaporator and ducting to remove heat. • Proper air flow is essential to uniformity and temperature control.
  • 11.
    Cold Wall Units •Remove heat using evaporator coils encased in the chamber walls. • Not subject to air flow issues. • Uniformity determined by efficiency of refrigerant.
  • 12.
    Incubators and Ovens •Heating elements, and fans work together to control temperature and achieve uniformity. • Like refrigerators, proper air flow is essential.
  • 13.
    Autoclaves • Mapping shouldcapture temperature and pressure. • Software may assist in determining lethality.
  • 14.
    Warehouses, Stability andDry Storage Chambers • Temperature and Humidity data should be captured. • Proper air flow is essential.
  • 15.
    Uniformity Testing • Temperaturemapping data helps determine areas in the chamber that may not meet specification.
  • 16.
    Dynamic Testing • OpenDoor testing gives chamber characteristics during normal use. • Power Failure testing gives chamber characteristics during failure and recovery conditions.
  • 17.
    Loaded versus EmptyChambers • Empty chambers typically give “Worst Case” performance characteristics. • Loaded chambers typically produce better data as the mass aids in buffering temperature fluctuations.