Downloaded 728 times

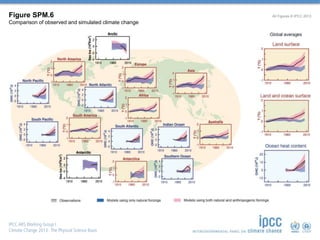

![Observed Changes in the Climate System (2/2)
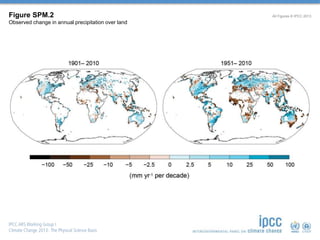
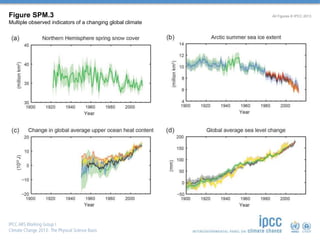
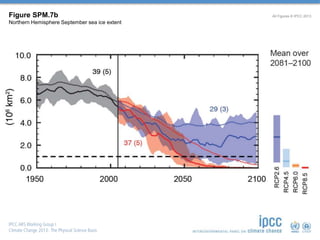
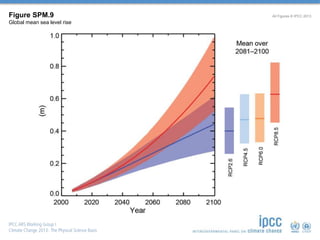
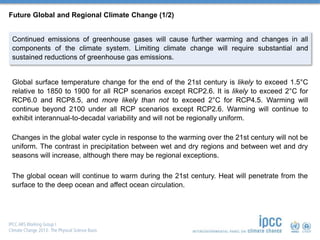
The rate of sea level rise since the mid-19th century has been larger than the mean rate
during the previous two millennia (high confidence). Over the period 1901 to 2010, global
mean sea level rose by 0.19 [0.17 to 0.21] m.
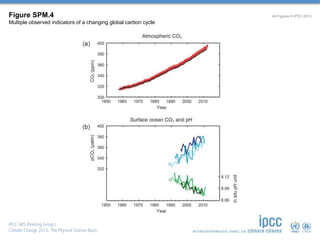
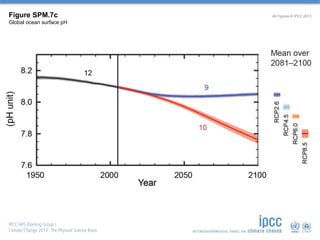
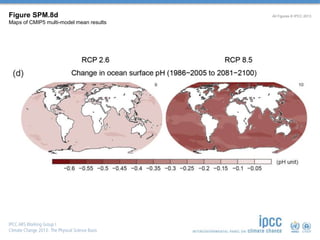
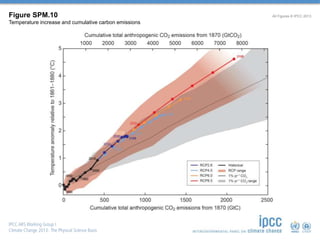
The atmospheric concentrations of carbon dioxide, methane, and nitrous oxide have
increased to levels unprecedented in at least the last 800,000 years. Carbon dioxide
concentrations have increased by 40% since pre-industrial times, primarily from fossil fuel
emissions and secondarily from net land use change emissions. The ocean has absorbed
about 30% of the emitted anthropogenic carbon dioxide, causing ocean acidification.](https://image.slidesharecdn.com/wgiar5presentation-141209074339-conversion-gate01/85/Fifth-Assessment-Report-Working-Group-I-24-320.jpg)

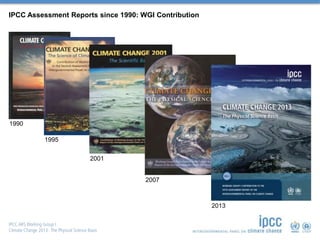
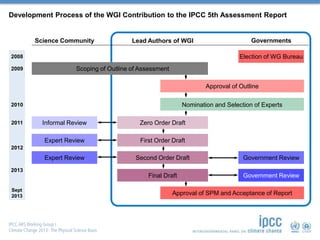
The document summarizes the key findings of the IPCC 5th Assessment Report from the Working Group I contribution on the physical science basis of climate change. It involved 259 authors from 39 countries, underwent extensive review by over 1000 experts, and assessed observed changes in the climate system, drivers of climate change, understanding of the climate system and projections for future climate change. The report found clear evidence that climate change poses a serious risk and is already affecting many natural and human systems across all continents and oceans.


