Pewr point
•Download as PPTX, PDF•
0 likes•64 views

miller indices

Recommended
More Related Content
What's hot
What's hot (18)
Similar to Pewr point
Similar to Pewr point (20)
More from Rai Saheb Bhanwar Singh College Nasrullaganj
Recently uploaded
Recently uploaded (20)
Pewr point
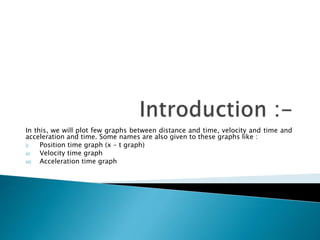
- 1. In this, we will plot few graphs between distance and time, velocity and time and acceleration and time. Some names are also given to these graphs like : i) Position time graph (x – t graph) ii) Velocity time graph iii) Acceleration time graph
- 2. The motion of an object moving in a straight line is studied by the position time graph. For this a graph is plotted by taking the time on x axis and position on y axis. It is called the position time (or x-t graph). The points on the graph corresponding to positions at different instants are joined by a smooth curve (or a straight line). Generally the origin of position and origin of time coincide.
- 4. If the position of an object does not change with time, the object is said to be in the state of rest. In such a case, the position of object remains the same at each instant, i.e., x=x (constant) for such an object, the position – time graph will be a straight line parallel to the time axis. For example, a train standing on a platform, a bus standing on its stoppage etc.
- 5. If the position of a body changes by an equal amount in equal intervals of time (i.e., velocity of body is said to be the uniform motion. For such a motion, the position – time graph is straight line inclined to the time axis. If the straight line makes an acute angle with the time axis, then the displacement increases with time (i.e., the body is moving away from its initial position) and if the straight line makes an obtuse angle with the time axis, then the displacement decreases with the increase in time (i.e., the body is coming back towards its initial position).
- 7. If the velocity of body is variable i.e. there is either acceleration or retardation in motion of body, the position – time graph will be a curve. Figure shows the position – time graph for a uniformly accelerated motion.
- 9. If a graph is plotted by taking the velocity of a moving object along y – axis and time on x – axis, it is called the velocity time graph of that object.
- 10. In a uniform motion, since velocity of object does not change with time, so the velocity – time graph is a straight line parallel to the time axis. Figure represents the velocity time graph for a body moving with a constant velocity.
- 12. In a uniformly accelerated motion, the increase in velocity is some interval of time (i.e., in one dimensional motion, the magnitude of velocity increases at a uniform rate). For such a motion, the velocity – time graph plotted by taking the velocity on y - axis and time on x – axis will be a straight line inclined at an acute angle with the time axis.
- 14. If acceleration of motion in non – uniform i.e., there is unequal change in velocity in same interval of time, the v – t graph will be a curve.
- 15. If a graph is plotted by taking acceleration on y – axis and time on x – axis, the graph is called the acceleration – time graph.
- 16. If an object is at rest or it is moving with the uniform velocity, its acceleration will be zero. In such a case, the acceleration – time graph will be a straight line coinciding with the time axis as shown in figure.
- 18. If the velocity of an object increases at a uniform rate, its acceleration will be uniform (or constant) and positive. For example, if an object is freely released to fall downwards, its velocity will increase by 9.8 m/s in each second. In such a case, the acceleration – time graph will be a straight line parallel to the time axis as shown in figure.
- 20. If the velocity of a body decreases at a uniform rate, the acceleration will be constant and negative. For example, if an object is thrown vertically upwards, its velocity will decrease by 9.8 m/s in each second. In such a case, the acceleration – time graph will be a straight line parallel to the time axis as shown in figure.