2. 2
Introduction
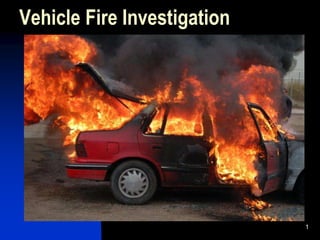
This presentation will address the
trials and tribulations of vehicle fire
investigation
The presenter is Steve Mackaig
from Fire Cause Analysis located
in California. Don’t hold that
against him.
3. 3
How’s the National Vehicle Fire
Loss
Picture?
Approximately 285,000 vehicle fires occur per year,
75% of vehicle fires are motor vehicles.
Vehicle fires result in 330 deaths, 1400 injuries and 692 million in
Damage
83 PERCENT ARE CLASSIFIED AS ACCIDENTIAL
4. 4
Our Topics for Discussion and
Debate
Vehicle fire investigation popularity
How is the vehicle fire cause
determined?
The field formula of vehicle fire cause
Understanding vehicle systems
Indicators of vehicle system failure
Methodology of a physical fire cause
examination
Subrogation
Vehicle arson
10. 10
Private Fire Investigators
Different scope of responsibility
Uses same process of fire cause
determination but long after
extinguishment
Limited power to pursue arson
Suspected arsonist may also be
client of insurance company
More time and resources for
accidental fire causes
11. 11
Determining Fire Cause
You Can Choose:
The wheel of fire origin or
Flip a coin or
You can use burn patterns and fire
behavior indicators in an
organized, safe and scientific
approach.
13. What is the most internationally
excepted Guideline text in Fire
Investigation?
National Fire Protection Association 921
Guide For Fire and Explosion Investigations
2011 Edition Chapter 25 Motor Vehicles
14. Use a Fire Determination Process
that is Considered a Systematic
Approach
The Scientific Method is considered a
reliable contemporary Systematic
Approach
15. 15
Scientific Method
Recognize The Need ( fire occurs)
Define The Problem ( requires fire cause
Investigation)
Collect Data ( facts and indictors)
Analyze Data ( inductive reasoning)
Develop an Hypothesis ( cause opinion)
Test Hypothesis ( what didn’t cause the fire )
Select Final Hypothesis ( Fire Cause Opinion)
16. 16
Burning Modern Vehicles Are
Influenced by
Composites
Unlimited air supply and wind
influence
Preheated components
Fuel and oil sources under
pressure
Large amount of plastics and
rubber
17. 17
The Basic Rule of Thumb in
identifying the Area of Origin
is: The area of origin is identified as the
area of most severe damage and the
lowest level of severe damage.
Accidental fires tend to start and develop
slowly while arson fires are associated to
rapid fire start and spread.
What is it about modern vehicles that
can potentially screw up this basic
theory?
18. 18
Burn patterns and physical
indicators on the vehicle
provides the
clues of fire cause & origin.
Unfortunately, the amount of fire
damage is proportional to the
amount of indicators or clues that
remain after the fire.
20. 20
Fire fighting activities
Salvage activities
Towing activities
Condition of night time
Wet surfaces
Standing water, foam or snow
Factors that effect your
indicators
21. 21
Once You Have Identified The
Area of Fire Origin
Identify all potential ignition
sources
Identify all potential fuel sources
Systematically rule out unrelated
fire causes
Challenge your own opinion
22. 22
Additional Information that can
be valuable in determining the
fire cause:
Events prior to the fire
Vehicle history and use
Mechanical and recall data
research
24. 24
The First Step
Fire typically originates in the area
of most severe damage
Burn patterns on the body reveal
direction of fire travel, fire exposure
and liquid patterns
Heat naturally rises and flammable
liquids flow to the lower areas.
25. 25
Work towards area greatest
damage comparing surfaces
and the various levels of
damage.
26. 26
Consider the probabilities
Where do you think the most
common place for a accidental fire
to occur is?
Where do you think arson is the
most common?
27. 27
Document your investigation as
you proceed
Compare the 5 compartments
between each other
Compare damage within each
compartment
Photograph before and after debris
removal
Recommend using photo
procedure that parallels inspection
29. 29
Systematically rule out
unrelated fire causes
Potentials include fuel, lubrication,
electrical, friction, heat exposure,
smoking materials, open flame
sources
30. 30
Potential follow up issues
Manufactures defects
Recent repairs
Fluid analysis
Component analysis
Dealer survey, mechanic inquiry &
parts department resources
Exemplar vehicle
31. 31
Let’s examine the 3 elements of
fire cause
First is fuel sources
Gasoline
Diesel fuel
Propane
Power steering fluid
Transmission oil
Gear oil
Anti freeze
Air conditioning refrigerant
Wet cell batteries
33. 33
Events
Was vehicle operating
System failure potential after
parking
Pre-fire activities and indicators
Pre-fire conditions such as
weather, road grade, towing,
turning accessory use
34. 34
Fire behaviors
Fuel system failure is typically
rapid flame onset
Lubricating oil on the exhaust
system create lots of white smoke
while the vehicle is moving, but no
flaming combustion why?
Electrical fires typically develop
from a slow, smoldering state
35. 35
Vehicle Component Analysis
To accurately evaluate accidental
fire causes requires a basic
understanding of vehicle systems
It has been my experience that
arson determined fires are typically
countered with accidental causes
so prepare by learning accidental
causes.
36. 36
Carburetors
Common in vehicles up to 1975
Typically in 2 or 4 barrel
configuration
2 to 6 pounds of fuel pressure
FAILURE POTENTIAL-
Gasket & seal leakage, improper
adjustment
Backfires
38. 38
Fuel Injection
Fuel is injected into each cylinder
by use of a mechanical pump, air
pump or electric signal
Because of normal system
pressure, leakage is typically in the
form of a spray at 30-40 pounds
per square inch.
Immediate fire, black smoke, rapid
spread
40. 40
Fuel injection failure potential
Leakage at the rubber seals
Leakage where fuel distribution rail
connects to injectors
Leakage at Schrader valve
Leakage at fuel hose connections
Fuel hose side wall
System pressure spike
Plastic failure from heat, pressure
and vibration
41. 41
Indicators of fuel system
failures
Severe fire damage in the area of origin
Area of origin houses fuel system
components with leakage potential
Origin surfaces are burned cleaned and
brightly discolored
Liquid stains and evidence of fuel wash
Fire start described as immediate
Fire described as explosion
Fire occurs during start up
Engine operation is disrupted as fire is
discovered
42.
43.
44.
45.
46.
47.
48.
49.
50.
51.
52.
53.
54.
55. 55
Lubrication system
This includes systems that
lubricate the engine, transmission
and power steering.
Oil ignites from exposure to
exhaust system surface heat
FAILURE POTENTIAL
Leaks at gaskets, seals and hoses.
56. 56
Indicators of oil leakage related
fire
Area around the origin burned clean with
adjacent areas oil stained
Reported white smoke prior to flame
discovery
Initially reported as fire under vehicle
along with dripping liquid
Fire discovered once vehicle stops
moving or up to approximately 10
minutes after parking
57. 57
Areas with leakage potential
Engine-front and rear seals, valve
covers, oil filter, oil pan, intake
manifold & distributor seal.
Power steering- hoses, crimp
connections, fluid reservoir
Transmission-rear seal, vent tube
and dip stick tube
58.
59.
60.
61.
62.
63.
64.
65.
66. 66
Electrical system
Most types of system failure
protected with fuses, relays, fusible
links.
These devises can activate from a
short circuit or fire caused heat
exposure.
67. 67
Types of failure
Dead short- electrical energy to
ground
Resistance heating-electrical
resistance during current flow at
weak connection or damaged wire
Ground fault-ground system
becomes energized or ungrounded
from poor connection.