Downloaded 4,419 times
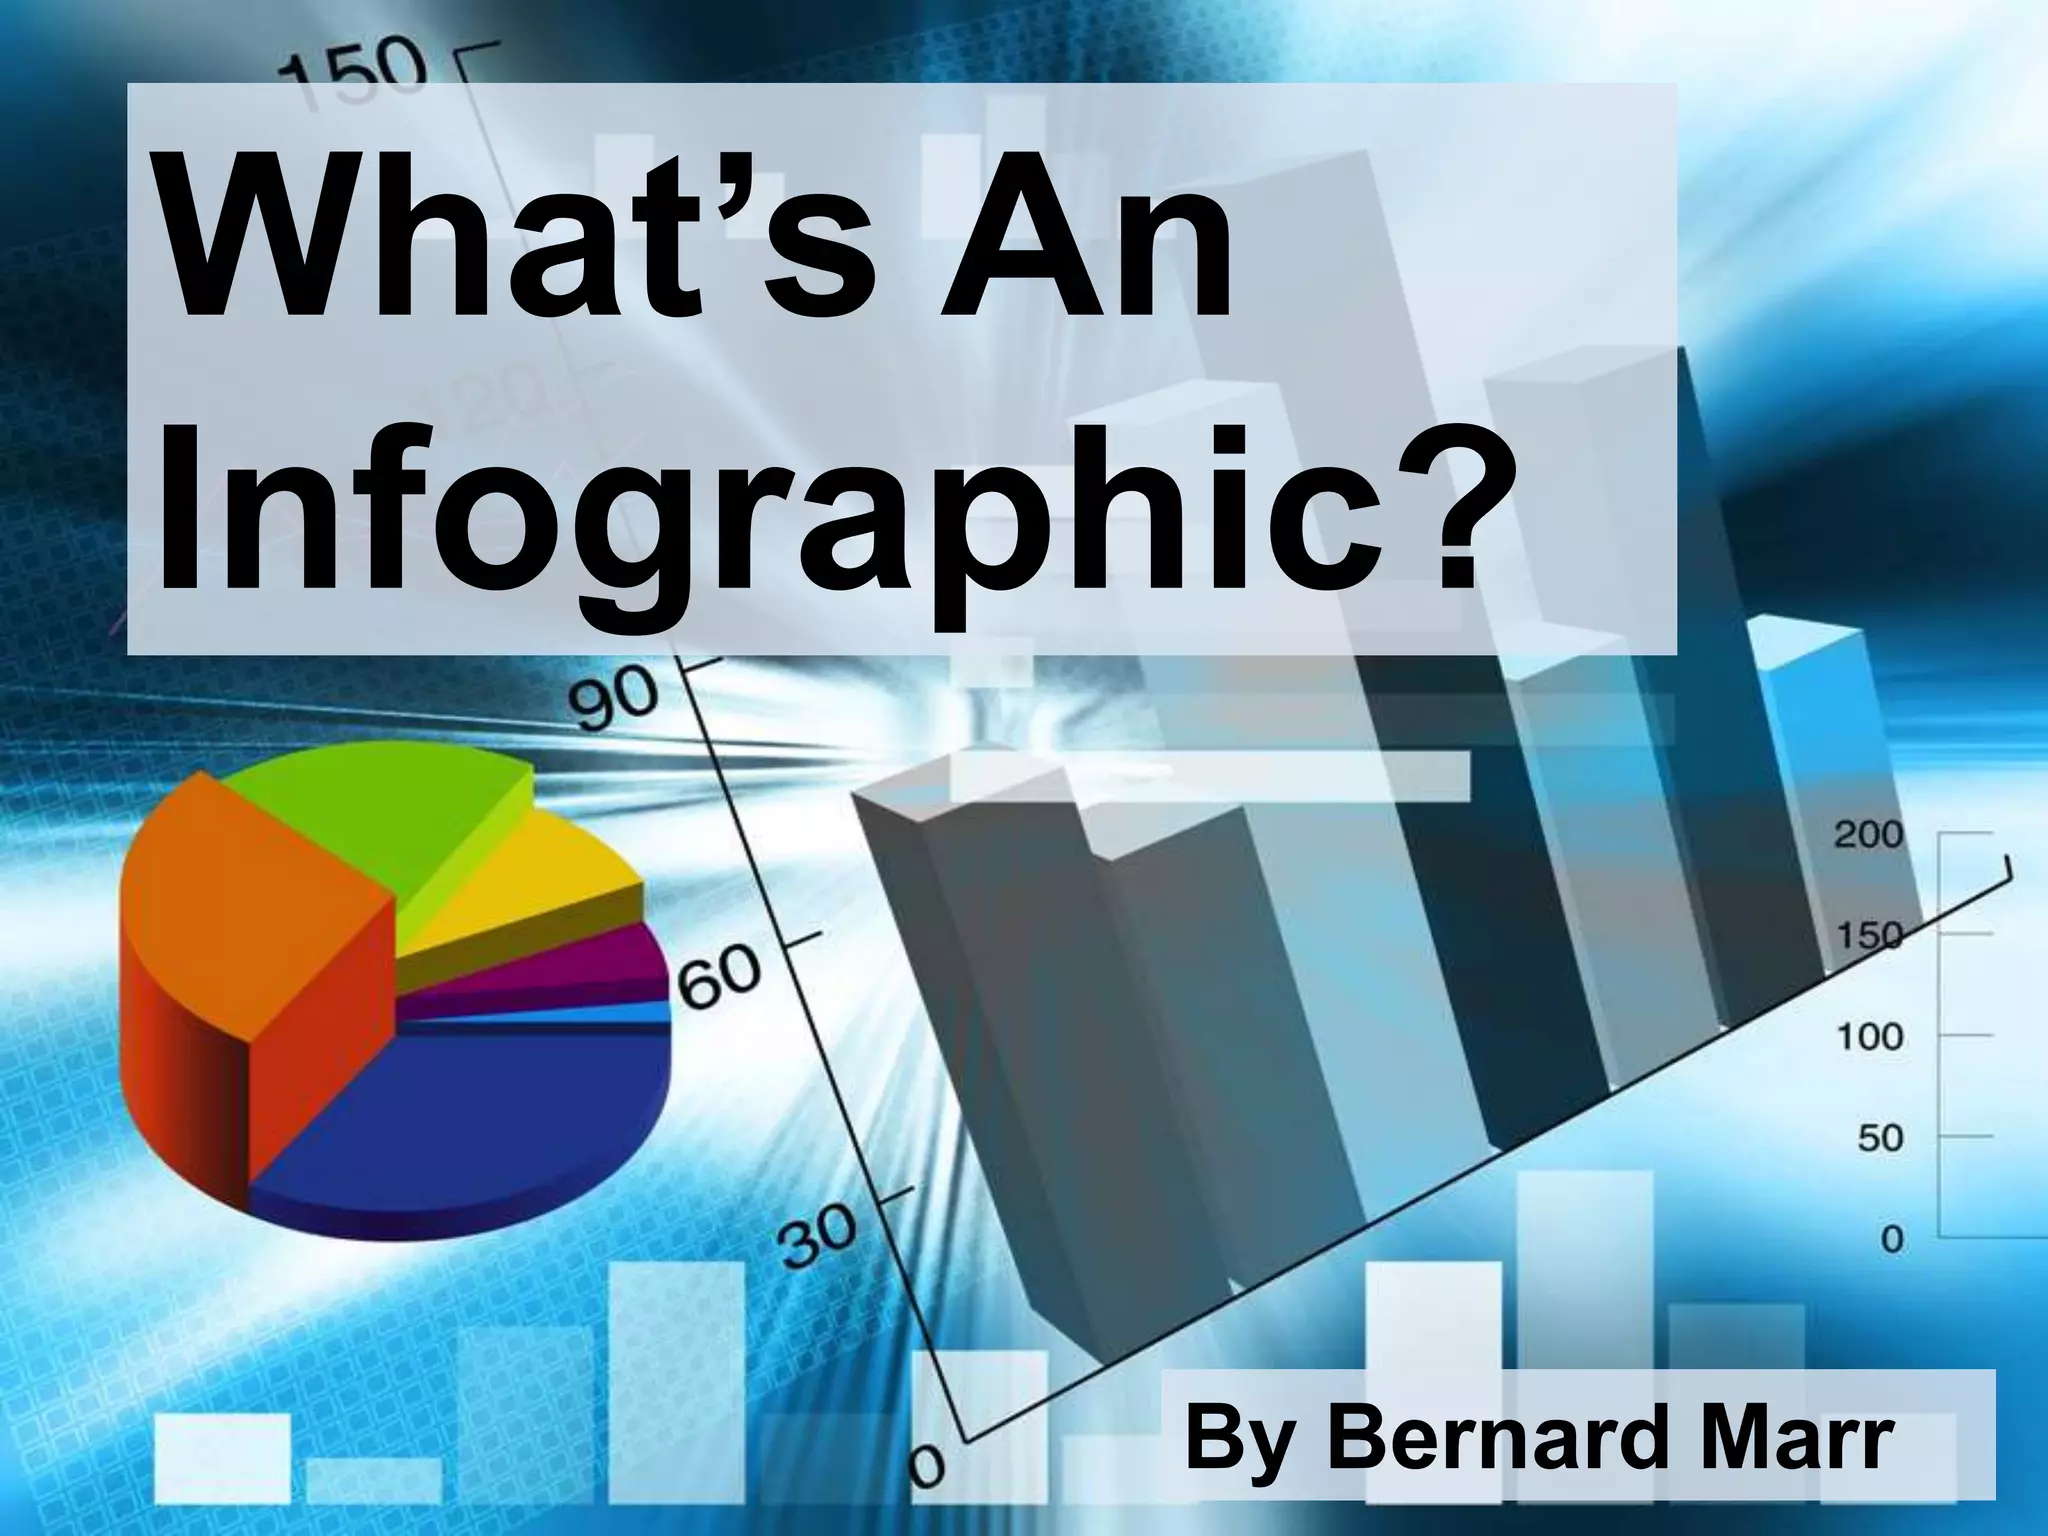
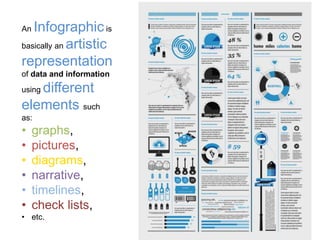

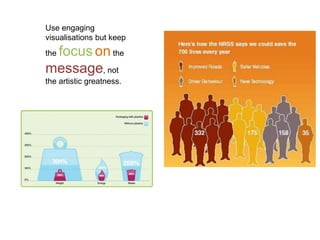
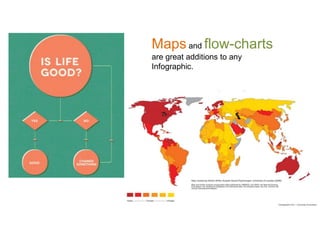
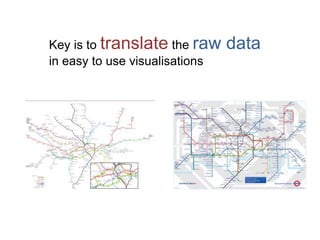
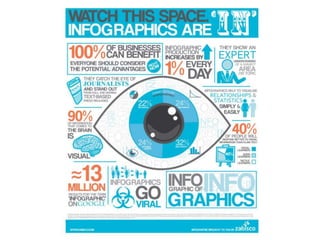
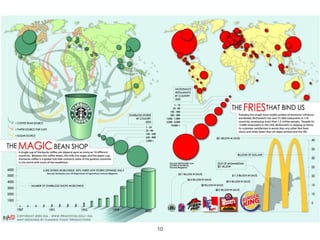
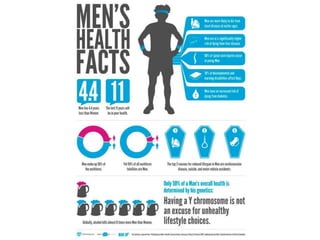
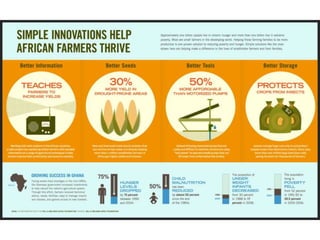
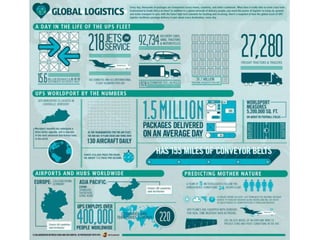
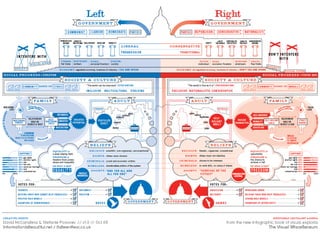
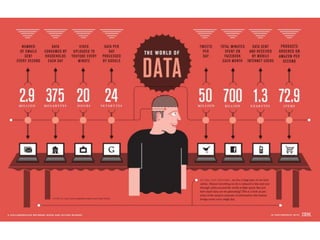
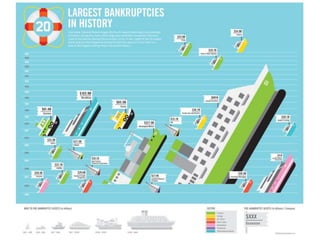


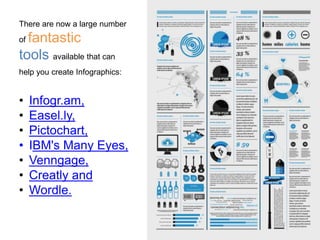


An infographic is an artistic representation of data that combines elements like graphs, pictures, and narratives to communicate insights effectively. They engage audiences more than traditional data presentation methods and can include various visualizations such as timelines and maps. There are many tools available for creating infographics, and the document emphasizes using engaging visuals while maintaining focus on the underlying message.


![SMOKE - The Convenient Truth [1st place Worlds Best Presentation Contest] by ...](https://cdn.slidesharecdn.com/ss_thumbnails/smoke-theconvenienttruth-ep-101028211434-phpapp01-thumbnail.jpg?width=640&height=640&fit=bounds)


![Infographics for Marketing & Communication [White Paper]](https://cdn.slidesharecdn.com/ss_thumbnails/whitepaperinfographics-130904042249--thumbnail.jpg?width=640&height=640&fit=bounds)


