Forecast Performance Analysis
•
0 likes•98 views

having independent financial analysis is a perfromance's advantage!

Recommended
Recommended
More Related Content
What's hot
What's hot (20)
Viewers also liked
Viewers also liked (11)
Similar to Forecast Performance Analysis
Similar to Forecast Performance Analysis (20)
More from Ambrosetti Asset Management SIM S.p.A.
More from Ambrosetti Asset Management SIM S.p.A. (20)
Recently uploaded
Recently uploaded (20)
Forecast Performance Analysis
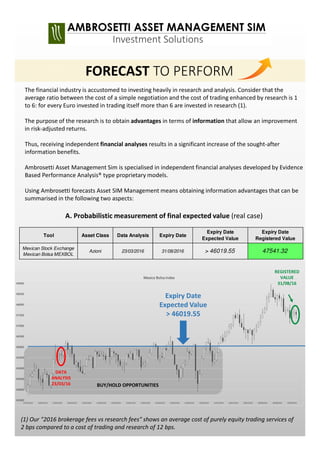
- 1. 1 FORECAST TO PERFORM The financial industry is accustomed to investing heavily in research and analysis. Consider that the average ratio between the cost of a simple negotiation and the cost of trading enhanced by research is 1 to 6: for every Euro invested in trading itself more than 6 are invested in research (1). The purpose of the research is to obtain advantages in terms of information that allow an improvement in risk-adjusted returns. Thus, receiving independent financial analyses results in a significant increase of the sought-after information benefits. Ambrosetti Asset Management Sim is specialised in independent financial analyses developed by Evidence Based Performance Analysis® type proprietary models. Using Ambrosetti forecasts Asset SIM Management means obtaining information advantages that can be summarised in the following two aspects: A. Probabilistic measurement of final expected value (real case) (1) Our "2016 brokerage fees vs research fees" shows an average cost of purely equity trading services of 2 bps compared to a cost of trading and research of 12 bps. Expiry Date Expected Value > 46019.55 DATA ANALYSIS 23/03/16 REGISTERED VALUE 31/08/16 BUY/HOLD OPPORTUNITIES Tool Asset Class Data Analysis Expiry Date Expiry Date Expected Value Expiry Date Registered Value Mexican Stock Exchange Mexican Bolsa MEXBOL Azioni 23/03/2016 31/08/2016 > 46019.55 47541.32 Investment Solutions This document is only for professional investors – Copying and unauthorized distribution is forbidden
- 2. 2 B. Probabilistic calculation of future fluctuation range (real case) The forward-looking approach of Ambrosetti Asset Management SIM is therefore objective in terms of its estimates and measurable results. Having a success rate as far away as possible from 50% (a percentage that represents total randomness) means accumulating information advantages. We show below the results of the analyses published by Ambrosetti Asset Management SIM over time on stocks, bonds, currencies, commodities and mutual funds. . From January 2013... In 2016... In September This data demonstrates the extreme reliability AAM forecasts. Number of analyses 824 Success rate 66% OUTCOME Number of analyses 88 Success rate 78% OUTCOME Number of analyses 15 Success rate 93% OUTCOME This document is only for professional investors – Copying and unauthorized distribution is forbidden
- 3. 3 As can be seen, the average success rate was equal to 47.4%, the same as tossing a coin! In addition, AAM results are ranked among the top positions. The use of research and analysis services on specific investment solutions by our clients have created, from 2003 to 2015, an average annual excess return of about 4.5% (data from certified financial statements). Our clients usually appreciate two different kind of services: 1- SYSTEMATIC DECISION SUPPORT In any case we compare these results with a benchmark represented by the study published by CXO Advisory, a US research firm, which covers more than 6,500 financial forecasts issued by 68 US experts over several years ( http://www.cxoadvisory.com/gurus/). This document is only for professional investors – Copying and unauthorized distribution is forbidden
- 4. 4 AZIONARIEOBBLIGAZIONARIE STRATEGY Perf 2015 Vol 2015 VOLCOR (T) 16.16% 16.14% ALPHA PLUS M (T) 18.39% 20.07% ALPHA PLUS Q (T) 17.95% 19.49% ACTIVE BOND SELECTION OICVM (F) 2.08% 2.75% ACTIVE BOND SELECTION TITOLI (T) 1.48% 1.86% AAGF 0%-25% AZIONI (F) 4.29% 3.84% AAGF 0%-50% AZIONI (F) 7.23% 5.48% AAGF 0%-75% AZIONI (F) 10.54% 7.72% AAGF 0%-100% AZIONI (F) 9.59% 7.95% COMPOSTE STRATEGY Perf 2015 Vol 2015 ALESSIA VOLCOR BETA ZERO (T) 8.68% 7.71% COMPAM ACTIVE BOND PLUS (T) 2.93% 4.03% ARCIPELAGOS GLOBAL PROFESSIONAL (F) 5.43% 6.96% 2- CONSULENZA INTEGRATA Non-binding indicative benchmarks Perf 2015 Vol 2015 MSCI World Local Currency 0,15% 13,45% DJ Eurostoxx50 Net Return 6,42% 23,14% Bloomberg Effas Bond Indices Euro Govt All > 1Yr TR 1,97% 4,77% To follow, some return on our investment’s strategies during 2015. This document is only for professional investors – Copying and unauthorized distribution is forbidden
- 5. 5 we are at your disposal for further information on +39 031 338391 or at the following email address: comunicazioni@ambrosettiam.com. Hoping to help you achieve profitable decisions we wish you good performance results! Ambrosetti Asset Management SIM S.p.A. DISCLAIMER The trademarks: Ebpa®, Morgana Predictor® and Investimenti Consapevoli® are proprietary trademarks registered by Ambrosetti Asset Management SIM. Morgana Predictor© and VolCor© are protected by the laws on copyright. This material is intended solely for professional investors and serves as an informative support solely to the address of the recipient to inform the same on a personal basis. The data, opinions, and, in general, the contents of the documents made available therefore are not an "investment solicitation" pursuant to article 1(1) letter t) of Legislative Decree 58/1998 and nor does it constitute investment advice or recommendations pursuant to article 1(5) letter f) of Legislative Decree 58/1998. The statistics shown are the result of rigorous calculations conducted by AAM using proprietary tools. Past performance is no guarantee of future performance. Riccardo Ambrosetti Alessandro Allegri Massimo Tripodi Chairman CEO Sales Manager 2003-2016 This document is only for professional investors – Copying and unauthorized distribution is forbidden COMPANY INFO AMBROSETTI ASSET MANAGEMENT SIM SPA VIA CONCILIAZIONE, 1 – 22100 COMO (CO) TEL. +39 031 338391 – FAX +39 031 3383999 COMUNICAZIONI@AMBROSETTIAM.COM WWW.AMBROSETTIAM.COM CORPORATION STOCK €200.000,00 I.V. CORPORATION STOCK AT 12/31/15 €200.000,00 ENTRY TO THE PROFESSIONAL REGISTER OF SIM N. 250 RESOLUTION CONSOB N. 16591 OF 08/05/2008 CONFORM TO NATIONAL GUARANTEE FUND REGISTER OF COMPANIES OF COMO 03760520969 REA COMO 298314 C.F. -P.I. (VAT) 03760520969