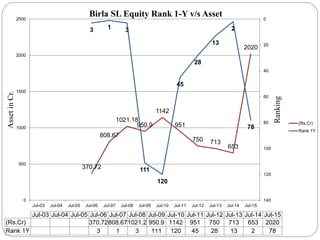
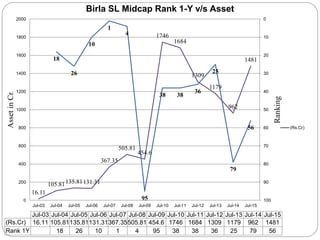
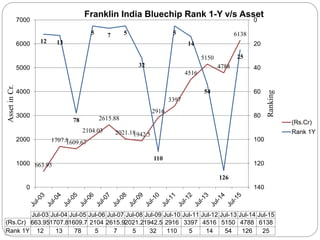
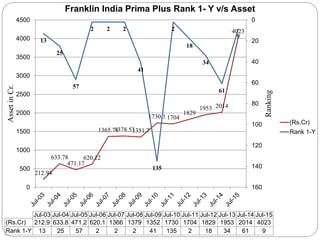
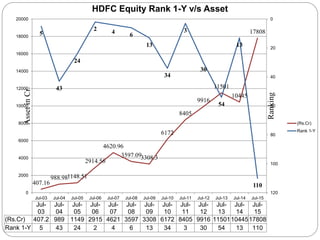
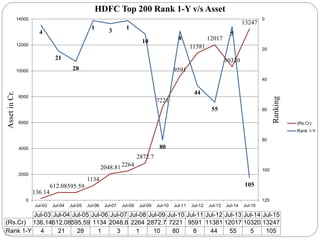
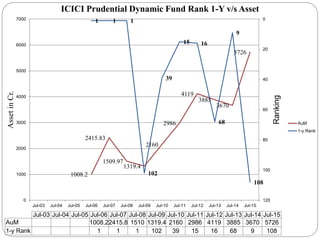
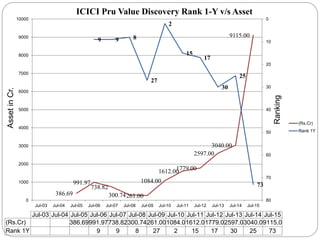
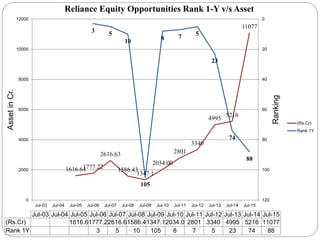
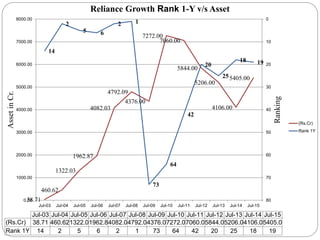
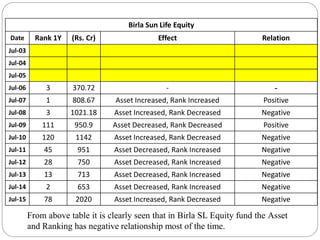
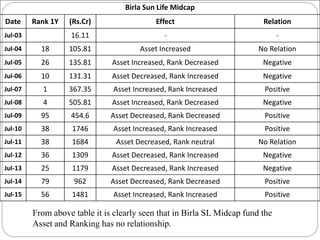
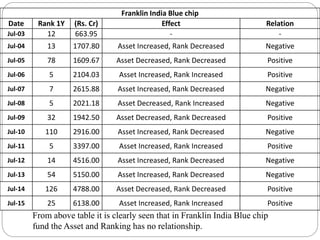
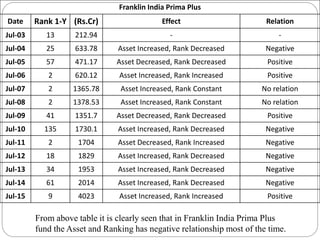
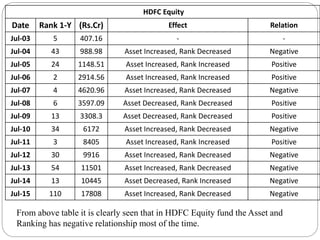
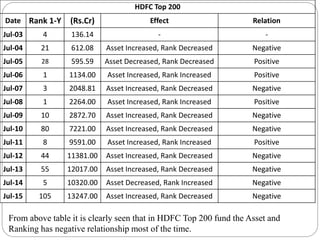
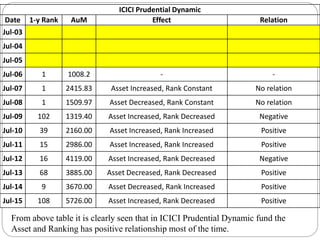
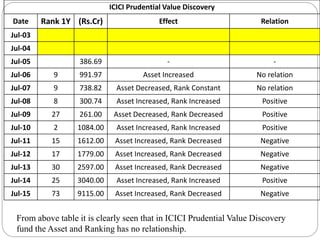
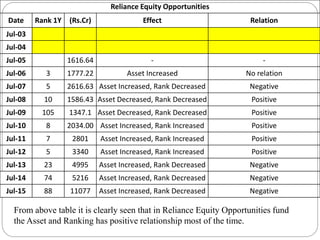
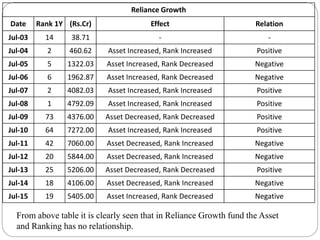
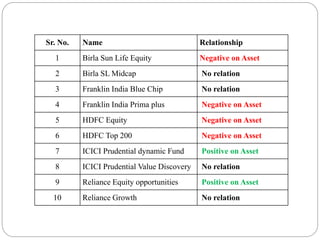
Submitted By
Jay Sukhadia Enrollment No: - 148320592071
Chandani Khubchandani Enrollment No: - 148320592015
A
SUMMER PROJECT PRESENTATION
ON
A STUDY ON SELECTED MUTUAL FUND
SCHEMES’ RANKING IN RELATION WITH
ASSET (AUM)
SUBMITTED TO
(Oakbrook Business School)
GUJARAT TECHNOLOGICAL UNIVERSITY
(MBA PROGRAMME)
Index
 Industry Overview
 Company Overview
 Introduction of the Topic
 Literature Review
 Research Objective
 Research Methodology
 Data analysis
 Findings
 Conclusion
 Bibliography
Industry Overview
 Mutual Fund is the pool of the money, based on the trust who invests
the savings of a number of investors who shares a common financial
goal, like the capital appreciation and dividend earning. The money
thus collect is then invested in capital market instruments such as
shares, debenture, and foreign market. Investors invest money and get
the units as per the unit value which we called as NAV (Net Assets
Value).
 Mutual Fund is the most suitable investment for the common man as it
offers an opportunity to invest in diversified portfolio management,
good research team, professionally managed Indian stock as well as the
foreign market.
Operation of mutual fund
Advantages of Mutual Fund
 Portfolio Diversification
• Professional Management
• Less Risk
• Low Transaction Costs
• Liquidity
• Choice of Schemes
• Transparency
Company Overview
Shalibhadra Master Investment Broker
 Introduction
Company started in1982 and now backed by 33 Years of experience
and competence of providing Investment Services. Now it is one of the
leading Individual Financial Distributor with the help of investors’
continuous support and “Six Sigma of Investing”.
 Business Approach
Company’s Approach is to establish good comfort for investors by
overcoming behavioral investing. According to company, creating
wealth for investors is what best they can give back to society. They
educate investors for decent returns considering Asset
allocation/liquidity/tax efficiency and most important is risk appetite.
Vision & Mission of the
Company
 Vision
“Our Vision is to become market leader in retail segment and create an
environment of open interaction with smallest of the investors. We
visualize creating a dream within them, educating & introducing a long
term financial freedom with discipline investment approach.”
 Mission
“Our mission is to be in heart of the investors as genuine,
understanding and skilled investment services provider by adopting
best ethical business practices to see investors reaching their financial
goals and achieve financial freedom.”
Introduction Of Topic
 The target is to identify the Ranking of various scheme. Because when
retail investors are thinking to invest in Mutual Funds they see the
Ranking and Asset of the schemes. They select those schemes which
have either high Rank or Asset. They assume that the high Ranked
scheme will earn higher return but in reality it may not be possible.
 Research period – 2003-2015
 Source of data – Mutual Fund Insight Magazine’s Scorecard
 Scheme Covered
1. Birla SL Equity
2. Birla SL Midcap
3. Franklin India Blue Chip
4. Franklin India Prima plus
5. HDFC Equity
6. HDFC Top 200
7. ICICI Prudential dynamic Fund
8. ICICI Prudential Value Discovery
9. Reliance Equity opportunities
10.Reliance Growth
During the period we have targeted to collect the data from authentic
source so that the outcome of data is reliable and can be compared with
any other pear group data base.
For the collection of data we have covered 13 different Mutual Fund
Insight book to extract the data.
We have collected data of Rank of one years and Asset of the schemes.
Literature Review
 Performance Ranking (18-08-2014) ET Bureau Aug 18, 2014,
08.00AM IST
 Author - Sanket Dhanorkar
 A quality fund is one that appears in the top quartile or the third quartile
year after year. However, not all funds that come in the top quartile in a
given year or period can do so in the next year or period.
 So which funds figure high on consistency? We have crunched the
numbers for your benefit, based on the data available with Mutual Fund
tracker Value Research. For each category of funds, we have calculated
the annual quartile Rank of all funds for each of the past five years,
starting from 2009. For obvious reasons, we limited our search to funds
that have a minimum five-year track record. The data helped us weed
out flash-in-the-pan funds and identify genuine performers.
 http://articles.economictimes.indiatimes.com/2014-08-
18/news/52941925_1_best-fund-performance-returns
Misleading Mutual Fund Ranking
Author - Nitin Bhatia
 Mutual Fund Ranking is a big business. Many reputed Personal Finance
Advisers and international rating agencies release Mutual Fund Ranking
Periodically. Why it’s a Business because these ratings can make or break
the fortune of any Mutual Fund Scheme.
 Mutual Fund Ranking is predominantly decided based on past performance
of 1 Year, 3 Year or 5 Year. There is no rocket science in this. I can also
publish my own version of Mutual Fund Rating for my readers. As per
SEBI guidelines it is always mentioned for equity linked products that “Past
performance is not an indicator of future outcomes”. It’s a hard fact but true.
I would like to quote example of SBI Magnum Tax Gain scheme. I invested
in this scheme in year 2008 and as per all Mutual Fund Ranking from rating
agencies & personal finance advisers, this scheme was best performing
scheme in ELSS category in 2008.
 http://www.nitinbhatia.in/personal-finance/misleading-mutual-fund-ranking/
5 parameters of selecting best Mutual
Fund scheme
Author - Manikaran Singal (Certified financial planner)
 Jan 21, 2014, 03.30 PM IST | Source: Moneycontrol.com
 Scheme Asset size this parameter is different for debt and equity schemes. In
equity the comfortable Asset size in hundreds of crore, in debt it should be in
thousands of crore as the investment value per investor is higher in debt
funds. 90 percent of total Assets under management (AUM) of the Mutual
Fund industry are invested in debt funds, so your selected scheme Assets
should also have a considerable AUM (ASSET UNDER MANAGEMENT).
Less AUM in any scheme is very risky as you don’t know who the investors
are and what quantum of investments they have in this particular scheme.
 http://www.moneycontrol.com/news/mf-experts/5-parametersselecting-best-
mutual-fund-scheme_945483.html?utm_source=ref_article
Research Objective
 The objective of our research is to study the Ranking of various popular
schemes and its effect on the Asset of those schemes. It will help to the
retail investors who invest in Mutual Funds only by seeing the Ranking
of the schemes and loss their money.
Research Methodology
Research Design
 We used descriptive research Design in our research.
 We have selected 10 Mutual Funds from Indian market. All funds are in
Equity category.
 Data has been collected from Mutual Fund Insight magazine of value
research.
 Collected Ranking and Assets of funds of each July Month for the year
2003 to 2015.
Source of Data
 Here in this research project we have used Secondary source of data.
The data is collected from the magazine of value research called
“Mutual Fund Insight”. The data of various Mutual Fund schemes are
given from which we selected some schemes of popular Mutual Fund
houses.
 Data Collection Method
Here in our research we used quantitative method like charts and
tables
 Scheme Covered
 Birla SL Equity
 Birla SL Midcap
 Franklin India Blue Chip
 Franklin India Prima plus
 HDFC Equity
 HDFC Top 200
 ICICI Prudential dynamic Fund
 ICICI Prudential Value Discovery
 Reliance Equity opportunities
 Reliance Growth
Limitations
 Our Research is based on only 10 Mutual Fund schemes which may not
apply to all other schemes.
Data
Analysis
370.72
808.67
1021.18
950.9
1142
951
750 713
653
2020
3 1 3
111
120
45
28
13
2
78
0
20
40
60
80
100
120
1400
500
1000
1500
2000
2500
Jul-03 Jul-04 Jul-05 Jul-06 Jul-07 Jul-08 Jul-09 Jul-10 Jul-11 Jul-12 Jul-13 Jul-14 Jul-15
Ranking
AssetinCr.
Jul-03 Jul-04 Jul-05 Jul-06 Jul-07 Jul-08 Jul-09 Jul-10 Jul-11 Jul-12 Jul-13 Jul-14 Jul-15
(Rs.Cr) 370.72808.671021.2 950.9 1142 951 750 713 653 2020
Rank 1Y 3 1 3 111 120 45 28 13 2 78
Birla SL Equity Rank 1-Y v/s Asset
(Rs.Cr)
Rank 1Y
16.11
105.81135.81131.31
367.35
505.81
454.6
1746
1684
1309
1179
962
148118
26
10
1
4
95
38 38
36
25
79
56
0
10
20
30
40
50
60
70
80
90
1000
200
400
600
800
1000
1200
1400
1600
1800
2000
Jul-03 Jul-04 Jul-05 Jul-06 Jul-07 Jul-08 Jul-09 Jul-10 Jul-11 Jul-12 Jul-13 Jul-14 Jul-15
Ranking
AssetinCr.
Jul-03 Jul-04 Jul-05 Jul-06 Jul-07 Jul-08 Jul-09 Jul-10 Jul-11 Jul-12 Jul-13 Jul-14 Jul-15
(Rs.Cr) 16.11 105.81135.81131.31367.35505.81 454.6 1746 1684 1309 1179 962 1481
Rank 1Y 18 26 10 1 4 95 38 38 36 25 79 56
Birla SL Midcap Rank 1-Y v/s Asset
(Rs.Cr)
663.95
1707.81609.67
2104.03
2615.88
2021.181942.5
2916
3397
4516
5150
4788
6138
12 13
78
5 7 5
32
110
5
14
54
126
25
0
20
40
60
80
100
120
1400
1000
2000
3000
4000
5000
6000
7000
Ranking
AssetinCr.
Jul-03 Jul-04 Jul-05 Jul-06 Jul-07 Jul-08 Jul-09 Jul-10 Jul-11 Jul-12 Jul-13 Jul-14 Jul-15
(Rs.Cr) 663.951707.81609.7 2104 2615.92021.21942.5 2916 3397 4516 5150 4788 6138
Rank 1Y 12 13 78 5 7 5 32 110 5 14 54 126 25
Franklin India Bluechip Rank 1-Y v/s Asset
(Rs.Cr)
Rank 1Y
212.94
633.78
471.17
620.12
1365.781378.531351.7
1730.1 1704
1829
1953 2014
4023
13
25
57
2 2 2
41
135
2
18
34
61
9
0
20
40
60
80
100
120
140
1600
500
1000
1500
2000
2500
3000
3500
4000
4500
Ranking
AssetinCr.
Jul-03 Jul-04 Jul-05 Jul-06 Jul-07 Jul-08 Jul-09 Jul-10 Jul-11 Jul-12 Jul-13 Jul-14 Jul-15
(Rs.Cr) 212.9 633.8 471.2 620.1 1366 1379 1352 1730 1704 1829 1953 2014 4023
Rank 1-Y 13 25 57 2 2 2 41 135 2 18 34 61 9
Franklin India Prima Plus Rank 1- Y v/s Asset
(Rs.Cr)
Rank 1-Y
407.16
988.981148.51
2914.56
4620.96
3597.093308.3
6172
8405
9916
11501
10445
178085
43
24
2 4 6
13
34
3
30
54
13
110
0
20
40
60
80
100
1200
2000
4000
6000
8000
10000
12000
14000
16000
18000
20000
Jul-03 Jul-04 Jul-05 Jul-06 Jul-07 Jul-08 Jul-09 Jul-10 Jul-11 Jul-12 Jul-13 Jul-14 Jul-15
Ranking
AssetinCr.
Jul-
03
Jul-
04
Jul-
05
Jul-
06
Jul-
07
Jul-
08
Jul-
09
Jul-
10
Jul-
11
Jul-
12
Jul-
13
Jul-
14
Jul-
15
(Rs.Cr) 407.2 989 1149 2915 4621 3597 3308 6172 8405 9916 115011044517808
Rank 1-Y 5 43 24 2 4 6 13 34 3 30 54 13 110
HDFC Equity Rank 1-Y v/s Asset
(Rs.Cr)
Rank 1-Y
136.14
612.08595.59
1134
2048.812264
2872.7
7221
9591
11381
12017
10320
13247
4
21
28
1 3 1
10
80
8
44
55
5
105
0
20
40
60
80
100
1200
2000
4000
6000
8000
10000
12000
14000
Jul-03 Jul-04 Jul-05 Jul-06 Jul-07 Jul-08 Jul-09 Jul-10 Jul-11 Jul-12 Jul-13 Jul-14 Jul-15
Ranking
AssetinCr.
Jul-03 Jul-04 Jul-05 Jul-06 Jul-07 Jul-08 Jul-09 Jul-10 Jul-11 Jul-12 Jul-13 Jul-14 Jul-15
(Rs.Cr) 136.14612.08595.59 1134 2048.8 2264 2872.7 7221 9591 11381 12017 10320 13247
Rank 1-Y 4 21 28 1 3 1 10 80 8 44 55 5 105
HDFC Top 200 Rank 1-Y v/s Asset
(Rs.Cr)
Rank 1-Y
1008.2
2415.83
1509.97
1319.4
2160
2986
4119
3885
3670
5726
1 1 1
102
39
15 16
68
9
108
0
20
40
60
80
100
1200
1000
2000
3000
4000
5000
6000
7000
Jul-03 Jul-04 Jul-05 Jul-06 Jul-07 Jul-08 Jul-09 Jul-10 Jul-11 Jul-12 Jul-13 Jul-14 Jul-15
Ranking
AssetinCr.
Jul-03 Jul-04 Jul-05 Jul-06 Jul-07 Jul-08 Jul-09 Jul-10 Jul-11 Jul-12 Jul-13 Jul-14 Jul-15
AuM 1008.22415.8 1510 1319.4 2160 2986 4119 3885 3670 5726
1-y Rank 1 1 1 102 39 15 16 68 9 108
ICICI Prudential Dynamic Fund Rank 1-Y v/s Asset
AuM
1-y Rank
386.69
991.97
738.82
300.74261.00
1084.00
1612.001779.00
2597.00
3040.00
9115.00
9 9 8
27
2
15
17
30
25
73
0
10
20
30
40
50
60
70
800
1000
2000
3000
4000
5000
6000
7000
8000
9000
10000
Jul-03 Jul-04 Jul-05 Jul-06 Jul-07 Jul-08 Jul-09 Jul-10 Jul-11 Jul-12 Jul-13 Jul-14 Jul-15
Ranking
AssetinCr.
Jul-03 Jul-04 Jul-05 Jul-06 Jul-07 Jul-08 Jul-09 Jul-10 Jul-11 Jul-12 Jul-13 Jul-14 Jul-15
(Rs.Cr) 386.69991.97738.82300.74261.001084.01612.01779.02597.03040.09115.0
Rank 1Y 9 9 8 27 2 15 17 30 25 73
ICICI Pru Value Discovery Rank 1-Y v/s Asset
(Rs.Cr)
Rank 1Y
1616.641777.22
2616.63
1586.43
1347.1
2034.00
2801
3340
4995
5216
11077
3 5
10
105
8 7 5
23
74
88
0
20
40
60
80
100
1200
2000
4000
6000
8000
10000
12000
Jul-03 Jul-04 Jul-05 Jul-06 Jul-07 Jul-08 Jul-09 Jul-10 Jul-11 Jul-12 Jul-13 Jul-14 Jul-15
Ranking
AssetinCr.
Jul-03 Jul-04 Jul-05 Jul-06 Jul-07 Jul-08 Jul-09 Jul-10 Jul-11 Jul-12 Jul-13 Jul-14 Jul-15
(Rs.Cr) 1616.61777.22616.61586.41347.12034.0 2801 3340 4995 5216 11077
Rank 1Y 3 5 10 105 8 7 5 23 74 88
Reliance Equity Opportunities Rank 1-Y v/s Asset
(Rs.Cr)
Rank 1Y
38.71
460.62
1322.03
1962.87
4082.03
4792.09
4376.00
7272.00
7060.00
5844.00
5206.00
4106.00
5405.00
14
2
5 6
2 1
73
64
42
20
25
18 19
0
10
20
30
40
50
60
70
800.00
1000.00
2000.00
3000.00
4000.00
5000.00
6000.00
7000.00
8000.00
Jul-03 Jul-04 Jul-05 Jul-06 Jul-07 Jul-08 Jul-09 Jul-10 Jul-11 Jul-12 Jul-13 Jul-14 Jul-15
Ranking
AssetinCr.
Jul-03 Jul-04 Jul-05 Jul-06 Jul-07 Jul-08 Jul-09 Jul-10 Jul-11 Jul-12 Jul-13 Jul-14 Jul-15
(Rs.Cr) 38.71 460.621322.01962.84082.04792.04376.07272.07060.05844.05206.04106.05405.0
Rank 1Y 14 2 5 6 2 1 73 64 42 20 25 18 19
Reliance Growth Rank 1-Y v/s Asset
(Rs.Cr)
Rank 1Y
Findings
From above table it is clearly seen that in Birla SL Equity fund the Asset
and Ranking has negative relationship most of the time.
Birla Sun Life Equity
Date Rank 1Y (Rs. Cr) Effect Relation
Jul-03
Jul-04
Jul-05
Jul-06 3 370.72 - -
Jul-07 1 808.67 Asset Increased, Rank Increased Positive
Jul-08 3 1021.18 Asset Increased, Rank Decreased Negative
Jul-09 111 950.9 Asset Decreased, Rank Decreased Positive
Jul-10 120 1142 Asset Increased, Rank Decreased Negative
Jul-11 45 951 Asset Decreased, Rank Increased Negative
Jul-12 28 750 Asset Decreased, Rank Increased Negative
Jul-13 13 713 Asset Decreased, Rank Increased Negative
Jul-14 2 653 Asset Decreased, Rank Increased Negative
Jul-15 78 2020 Asset Increased, Rank Decreased Negative
From above table it is clearly seen that in Birla SL Midcap fund the
Asset and Ranking has no relationship.
Birla Sun Life Midcap
Date Rank 1Y (Rs.Cr) Effect Relation
Jul-03 16.11 - -
Jul-04 18 105.81 Asset Increased No Relation
Jul-05 26 135.81 Asset Increased, Rank Decreased Negative
Jul-06 10 131.31 Asset Decreased, Rank Increased Negative
Jul-07 1 367.35 Asset Increased, Rank Increased Positive
Jul-08 4 505.81 Asset Increased, Rank Decreased Negative
Jul-09 95 454.6 Asset Decreased, Rank Decreased Positive
Jul-10 38 1746 Asset Increased, Rank Increased Positive
Jul-11 38 1684 Asset Decreased, Rank neutral No Relation
Jul-12 36 1309 Asset Decreased, Rank Increased Negative
Jul-13 25 1179 Asset Decreased, Rank Increased Negative
Jul-14 79 962 Asset Decreased, Rank Decreased Positive
Jul-15 56 1481 Asset Increased, Rank Increased Positive
From above table it is clearly seen that in Franklin India Blue chip
fund the Asset and Ranking has no relationship.
Franklin India Blue chip
Date Rank 1Y (Rs. Cr) Effect Relation
Jul-03 12 663.95 - -
Jul-04 13 1707.80 Asset Increased, Rank Decreased Negative
Jul-05 78 1609.67 Asset Decreased, Rank Decreased Positive
Jul-06 5 2104.03 Asset Increased, Rank Increased Positive
Jul-07 7 2615.88 Asset Increased, Rank Decreased Negative
Jul-08 5 2021.18 Asset Decreased, Rank Increased Negative
Jul-09 32 1942.50 Asset Decreased, Rank Decreased Positive
Jul-10 110 2916.00 Asset Increased, Rank Decreased Negative
Jul-11 5 3397.00 Asset Increased, Rank Increased Positive
Jul-12 14 4516.00 Asset Increased, Rank Decreased Negative
Jul-13 54 5150.00 Asset Increased, Rank Decreased Negative
Jul-14 126 4788.00 Asset Decreased, Rank Decreased Positive
Jul-15 25 6138.00 Asset Increased, Rank Increased Positive
From above table it is clearly seen that in Franklin India Prima Plus
fund the Asset and Ranking has negative relationship most of the time.
Franklin India Prima Plus
Date Rank 1-Y (Rs.Cr) Effect Relation
Jul-03 13 212.94 - -
Jul-04 25 633.78 Asset Increased, Rank Decreased Negative
Jul-05 57 471.17 Asset Decreased, Rank Decreased Positive
Jul-06 2 620.12 Asset Increased, Rank Increased Positive
Jul-07 2 1365.78 Asset Increased, Rank Constant No relation
Jul-08 2 1378.53 Asset Increased, Rank Constant No relation
Jul-09 41 1351.7 Asset Decreased, Rank Decreased Positive
Jul-10 135 1730.1 Asset Increased, Rank Decreased Negative
Jul-11 2 1704 Asset Decreased, Rank Increased Negative
Jul-12 18 1829 Asset Increased, Rank Decreased Negative
Jul-13 34 1953 Asset Increased, Rank Decreased Negative
Jul-14 61 2014 Asset Increased, Rank Decreased Negative
Jul-15 9 4023 Asset Increased, Rank Increased Positive
HDFC Equity
Date Rank 1-Y (Rs.Cr) Effect Relation
Jul-03 5 407.16 - -
Jul-04 43 988.98 Asset Increased, Rank Decreased Negative
Jul-05 24 1148.51 Asset Increased, Rank Increased Positive
Jul-06 2 2914.56 Asset Increased, Rank Increased Positive
Jul-07 4 4620.96 Asset Increased, Rank Decreased Negative
Jul-08 6 3597.09 Asset Decreased, Rank Decreased Positive
Jul-09 13 3308.3 Asset Decreased, Rank Decreased Positive
Jul-10 34 6172 Asset Increased, Rank Decreased Negative
Jul-11 3 8405 Asset Increased, Rank Increased Positive
Jul-12 30 9916 Asset Increased, Rank Decreased Negative
Jul-13 54 11501 Asset Increased, Rank Decreased Negative
Jul-14 13 10445 Asset Decreased, Rank Increased Negative
Jul-15 110 17808 Asset Increased, Rank Decreased Negative
From above table it is clearly seen that in HDFC Equity fund the Asset and
Ranking has negative relationship most of the time.
HDFC Top 200
Date Rank 1-Y (Rs.Cr) Effect Relation
Jul-03 4 136.14 - -
Jul-04 21 612.08 Asset Increased, Rank Decreased Negative
Jul-05 28 595.59 Asset Decreased, Rank Decreased Positive
Jul-06 1 1134.00 Asset Increased, Rank Increased Positive
Jul-07 3 2048.81 Asset Increased, Rank Decreased Negative
Jul-08 1 2264.00 Asset Increased, Rank Increased Positive
Jul-09 10 2872.70 Asset Increased, Rank Decreased Negative
Jul-10 80 7221.00 Asset Increased, Rank Decreased Negative
Jul-11 8 9591.00 Asset Increased, Rank Increased Positive
Jul-12 44 11381.00 Asset Increased, Rank Decreased Negative
Jul-13 55 12017.00 Asset Increased, Rank Decreased Negative
Jul-14 5 10320.00 Asset Decreased, Rank Increased Negative
Jul-15 105 13247.00 Asset Increased, Rank Decreased Negative
From above table it is clearly seen that in HDFC Top 200 fund the Asset and
Ranking has negative relationship most of the time.
ICICI Prudential Dynamic
Date 1-y Rank AuM Effect Relation
Jul-03
Jul-04
Jul-05
Jul-06 1 1008.2 - -
Jul-07 1 2415.83 Asset Increased, Rank Constant No relation
Jul-08 1 1509.97 Asset Decreased, Rank Constant No relation
Jul-09 102 1319.40 Asset Increased, Rank Decreased Negative
Jul-10 39 2160.00 Asset Increased, Rank Increased Positive
Jul-11 15 2986.00 Asset Increased, Rank Increased Positive
Jul-12 16 4119.00 Asset Increased, Rank Decreased Negative
Jul-13 68 3885.00 Asset Decreased, Rank Decreased Positive
Jul-14 9 3670.00 Asset Decreased, Rank Increased Positive
Jul-15 108 5726.00 Asset Increased, Rank Decreased Positive
From above table it is clearly seen that in ICICI Prudential Dynamic fund the
Asset and Ranking has positive relationship most of the time.
ICICI Prudential Value Discovery
Date Rank 1Y (Rs.Cr) Effect Relation
Jul-03
Jul-04
Jul-05 386.69 - -
Jul-06 9 991.97 Asset Increased No relation
Jul-07 9 738.82 Asset Decreased, Rank Constant No relation
Jul-08 8 300.74 Asset Increased, Rank Increased Positive
Jul-09 27 261.00 Asset Decreased, Rank Decreased Positive
Jul-10 2 1084.00 Asset Increased, Rank Increased Positive
Jul-11 15 1612.00 Asset Increased, Rank Decreased Negative
Jul-12 17 1779.00 Asset Increased, Rank Decreased Negative
Jul-13 30 2597.00 Asset Increased, Rank Decreased Negative
Jul-14 25 3040.00 Asset Increased, Rank Increased Positive
Jul-15 73 9115.00 Asset Increased, Rank Decreased Negative
From above table it is clearly seen that in ICICI Prudential Value Discovery
fund the Asset and Ranking has no relationship.
Reliance Equity Opportunities
Date Rank 1Y (Rs.Cr) Effect Relation
Jul-03
Jul-04
Jul-05 1616.64 - -
Jul-06 3 1777.22 Asset Increased No relation
Jul-07 5 2616.63 Asset Increased, Rank Decreased Negative
Jul-08 10 1586.43 Asset Decreased, Rank Decreased Positive
Jul-09 105 1347.1 Asset Decreased, Rank Decreased Positive
Jul-10 8 2034.00 Asset Increased, Rank Increased Positive
Jul-11 7 2801 Asset Increased, Rank Increased Positive
Jul-12 5 3340 Asset Increased, Rank Increased Positive
Jul-13 23 4995 Asset Increased, Rank Decreased Negative
Jul-14 74 5216 Asset Increased, Rank Decreased Negative
Jul-15 88 11077 Asset Increased, Rank Decreased Negative
From above table it is clearly seen that in Reliance Equity Opportunities fund
the Asset and Ranking has positive relationship most of the time.
Reliance Growth
Date Rank 1Y (Rs.Cr) Effect Relation
Jul-03 14 38.71 - -
Jul-04 2 460.62 Asset Increased, Rank Increased Positive
Jul-05 5 1322.03 Asset Increased, Rank Decreased Negative
Jul-06 6 1962.87 Asset Increased, Rank Decreased Negative
Jul-07 2 4082.03 Asset Increased, Rank Increased Positive
Jul-08 1 4792.09 Asset Increased, Rank Increased Positive
Jul-09 73 4376.00 Asset Decreased, Rank Decreased Positive
Jul-10 64 7272.00 Asset Increased, Rank Increased Positive
Jul-11 42 7060.00 Asset Decreased, Rank Increased Negative
Jul-12 20 5844.00 Asset Decreased, Rank Increased Negative
Jul-13 25 5206.00 Asset Decreased, Rank Decreased Positive
Jul-14 18 4106.00 Asset Decreased, Rank Increased Negative
Jul-15 19 5405.00 Asset Increased, Rank Decreased Negative
From above table it is clearly seen that in Reliance Growth fund the Asset
and Ranking has no relationship.
Recommendation
 We recommend investors to invest in mutual fund schemes after observing
Performance & Ranking, Ratio analysis, Risk and return ratios, total
expense ratio, Fund manager tenure and experience, Scheme asset size,
investor’s risk taking capacity etc.
 These parameters affect Asset of the scheme also. So, these should be
considered at the time of investment.
 If investor observe only one parameter it may mislead the investor for
investing.
Conclusion
 According to our report we conclude by observing the data that the
improvement in Rank of the particular scheme, the retail investors are
attracted to invest in scheme. So, the improvement in Rank will increase the
Asset under management in upcoming year.
 The second reason of increase/decrease in the Asset of the scheme might be
because of market fluctuation. If market will increase then stock price will
increase which also increase assets of the scheme and vice versa.
 And third might be that if the Mutual fund Managers are efficient in
managing funds, despite of increase/decrease in asset the fund manager will
manage fund effectively and it will give good returns to the investors. The
following table clearly indicates the relationship of Rank with Asset of
particular schemes.
Sr. No. Name Relationship
1 Birla Sun Life Equity Negative on Asset
2 Birla SL Midcap No relation
3 Franklin India Blue Chip No relation
4 Franklin India Prima plus Negative on Asset
5 HDFC Equity Negative on Asset
6 HDFC Top 200 Negative on Asset
7 ICICI Prudential dynamic Fund Positive on Asset
8 ICICI Prudential Value Discovery No relation
9 Reliance Equity opportunities Positive on Asset
10 Reliance Growth No relation
Bibliography
 http://articles.economictimes.indiatimes.com/2014-08-
18/news/52941925_1_best-fund-performance-returns
 http://www.nitinbhatia.in/personal-finance/misleading-mutual-fund-
Ranking/
 http://www.moneycontrol.com/news/mf-experts/5-parametersselecting-
best-mutual-fund-scheme_945483.html
 http://www.moneycontrol.com/news/mf-experts/how-to-choose-best-
performing-mutual-funds_1132991.html
Thank you

final Presentation

  • 1.
    Submitted By Jay SukhadiaEnrollment No: - 148320592071 Chandani Khubchandani Enrollment No: - 148320592015 A SUMMER PROJECT PRESENTATION ON A STUDY ON SELECTED MUTUAL FUND SCHEMES’ RANKING IN RELATION WITH ASSET (AUM) SUBMITTED TO (Oakbrook Business School) GUJARAT TECHNOLOGICAL UNIVERSITY (MBA PROGRAMME)
  • 2.
    Index  Industry Overview Company Overview  Introduction of the Topic  Literature Review  Research Objective  Research Methodology  Data analysis  Findings  Conclusion  Bibliography
  • 3.
    Industry Overview  MutualFund is the pool of the money, based on the trust who invests the savings of a number of investors who shares a common financial goal, like the capital appreciation and dividend earning. The money thus collect is then invested in capital market instruments such as shares, debenture, and foreign market. Investors invest money and get the units as per the unit value which we called as NAV (Net Assets Value).  Mutual Fund is the most suitable investment for the common man as it offers an opportunity to invest in diversified portfolio management, good research team, professionally managed Indian stock as well as the foreign market.
  • 4.
  • 5.
    Advantages of MutualFund  Portfolio Diversification • Professional Management • Less Risk • Low Transaction Costs • Liquidity • Choice of Schemes • Transparency
  • 6.
    Company Overview Shalibhadra MasterInvestment Broker  Introduction Company started in1982 and now backed by 33 Years of experience and competence of providing Investment Services. Now it is one of the leading Individual Financial Distributor with the help of investors’ continuous support and “Six Sigma of Investing”.  Business Approach Company’s Approach is to establish good comfort for investors by overcoming behavioral investing. According to company, creating wealth for investors is what best they can give back to society. They educate investors for decent returns considering Asset allocation/liquidity/tax efficiency and most important is risk appetite.
  • 7.
    Vision & Missionof the Company  Vision “Our Vision is to become market leader in retail segment and create an environment of open interaction with smallest of the investors. We visualize creating a dream within them, educating & introducing a long term financial freedom with discipline investment approach.”  Mission “Our mission is to be in heart of the investors as genuine, understanding and skilled investment services provider by adopting best ethical business practices to see investors reaching their financial goals and achieve financial freedom.”
  • 8.
    Introduction Of Topic The target is to identify the Ranking of various scheme. Because when retail investors are thinking to invest in Mutual Funds they see the Ranking and Asset of the schemes. They select those schemes which have either high Rank or Asset. They assume that the high Ranked scheme will earn higher return but in reality it may not be possible.  Research period – 2003-2015  Source of data – Mutual Fund Insight Magazine’s Scorecard
  • 9.
     Scheme Covered 1.Birla SL Equity 2. Birla SL Midcap 3. Franklin India Blue Chip 4. Franklin India Prima plus 5. HDFC Equity 6. HDFC Top 200 7. ICICI Prudential dynamic Fund 8. ICICI Prudential Value Discovery 9. Reliance Equity opportunities 10.Reliance Growth
  • 10.
    During the periodwe have targeted to collect the data from authentic source so that the outcome of data is reliable and can be compared with any other pear group data base. For the collection of data we have covered 13 different Mutual Fund Insight book to extract the data. We have collected data of Rank of one years and Asset of the schemes.
  • 11.
    Literature Review  PerformanceRanking (18-08-2014) ET Bureau Aug 18, 2014, 08.00AM IST  Author - Sanket Dhanorkar  A quality fund is one that appears in the top quartile or the third quartile year after year. However, not all funds that come in the top quartile in a given year or period can do so in the next year or period.  So which funds figure high on consistency? We have crunched the numbers for your benefit, based on the data available with Mutual Fund tracker Value Research. For each category of funds, we have calculated the annual quartile Rank of all funds for each of the past five years, starting from 2009. For obvious reasons, we limited our search to funds that have a minimum five-year track record. The data helped us weed out flash-in-the-pan funds and identify genuine performers.  http://articles.economictimes.indiatimes.com/2014-08- 18/news/52941925_1_best-fund-performance-returns
  • 12.
    Misleading Mutual FundRanking Author - Nitin Bhatia  Mutual Fund Ranking is a big business. Many reputed Personal Finance Advisers and international rating agencies release Mutual Fund Ranking Periodically. Why it’s a Business because these ratings can make or break the fortune of any Mutual Fund Scheme.  Mutual Fund Ranking is predominantly decided based on past performance of 1 Year, 3 Year or 5 Year. There is no rocket science in this. I can also publish my own version of Mutual Fund Rating for my readers. As per SEBI guidelines it is always mentioned for equity linked products that “Past performance is not an indicator of future outcomes”. It’s a hard fact but true. I would like to quote example of SBI Magnum Tax Gain scheme. I invested in this scheme in year 2008 and as per all Mutual Fund Ranking from rating agencies & personal finance advisers, this scheme was best performing scheme in ELSS category in 2008.  http://www.nitinbhatia.in/personal-finance/misleading-mutual-fund-ranking/
  • 13.
    5 parameters ofselecting best Mutual Fund scheme Author - Manikaran Singal (Certified financial planner)  Jan 21, 2014, 03.30 PM IST | Source: Moneycontrol.com  Scheme Asset size this parameter is different for debt and equity schemes. In equity the comfortable Asset size in hundreds of crore, in debt it should be in thousands of crore as the investment value per investor is higher in debt funds. 90 percent of total Assets under management (AUM) of the Mutual Fund industry are invested in debt funds, so your selected scheme Assets should also have a considerable AUM (ASSET UNDER MANAGEMENT). Less AUM in any scheme is very risky as you don’t know who the investors are and what quantum of investments they have in this particular scheme.  http://www.moneycontrol.com/news/mf-experts/5-parametersselecting-best- mutual-fund-scheme_945483.html?utm_source=ref_article
  • 14.
    Research Objective  Theobjective of our research is to study the Ranking of various popular schemes and its effect on the Asset of those schemes. It will help to the retail investors who invest in Mutual Funds only by seeing the Ranking of the schemes and loss their money.
  • 15.
    Research Methodology Research Design We used descriptive research Design in our research.  We have selected 10 Mutual Funds from Indian market. All funds are in Equity category.  Data has been collected from Mutual Fund Insight magazine of value research.  Collected Ranking and Assets of funds of each July Month for the year 2003 to 2015. Source of Data  Here in this research project we have used Secondary source of data. The data is collected from the magazine of value research called “Mutual Fund Insight”. The data of various Mutual Fund schemes are given from which we selected some schemes of popular Mutual Fund houses.
  • 16.
     Data CollectionMethod Here in our research we used quantitative method like charts and tables  Scheme Covered  Birla SL Equity  Birla SL Midcap  Franklin India Blue Chip  Franklin India Prima plus  HDFC Equity  HDFC Top 200  ICICI Prudential dynamic Fund  ICICI Prudential Value Discovery  Reliance Equity opportunities  Reliance Growth
  • 17.
    Limitations  Our Researchis based on only 10 Mutual Fund schemes which may not apply to all other schemes.
  • 18.
  • 19.
    370.72 808.67 1021.18 950.9 1142 951 750 713 653 2020 3 13 111 120 45 28 13 2 78 0 20 40 60 80 100 120 1400 500 1000 1500 2000 2500 Jul-03 Jul-04 Jul-05 Jul-06 Jul-07 Jul-08 Jul-09 Jul-10 Jul-11 Jul-12 Jul-13 Jul-14 Jul-15 Ranking AssetinCr. Jul-03 Jul-04 Jul-05 Jul-06 Jul-07 Jul-08 Jul-09 Jul-10 Jul-11 Jul-12 Jul-13 Jul-14 Jul-15 (Rs.Cr) 370.72808.671021.2 950.9 1142 951 750 713 653 2020 Rank 1Y 3 1 3 111 120 45 28 13 2 78 Birla SL Equity Rank 1-Y v/s Asset (Rs.Cr) Rank 1Y
  • 20.
    16.11 105.81135.81131.31 367.35 505.81 454.6 1746 1684 1309 1179 962 148118 26 10 1 4 95 38 38 36 25 79 56 0 10 20 30 40 50 60 70 80 90 1000 200 400 600 800 1000 1200 1400 1600 1800 2000 Jul-03 Jul-04Jul-05 Jul-06 Jul-07 Jul-08 Jul-09 Jul-10 Jul-11 Jul-12 Jul-13 Jul-14 Jul-15 Ranking AssetinCr. Jul-03 Jul-04 Jul-05 Jul-06 Jul-07 Jul-08 Jul-09 Jul-10 Jul-11 Jul-12 Jul-13 Jul-14 Jul-15 (Rs.Cr) 16.11 105.81135.81131.31367.35505.81 454.6 1746 1684 1309 1179 962 1481 Rank 1Y 18 26 10 1 4 95 38 38 36 25 79 56 Birla SL Midcap Rank 1-Y v/s Asset (Rs.Cr)
  • 21.
    663.95 1707.81609.67 2104.03 2615.88 2021.181942.5 2916 3397 4516 5150 4788 6138 12 13 78 5 75 32 110 5 14 54 126 25 0 20 40 60 80 100 120 1400 1000 2000 3000 4000 5000 6000 7000 Ranking AssetinCr. Jul-03 Jul-04 Jul-05 Jul-06 Jul-07 Jul-08 Jul-09 Jul-10 Jul-11 Jul-12 Jul-13 Jul-14 Jul-15 (Rs.Cr) 663.951707.81609.7 2104 2615.92021.21942.5 2916 3397 4516 5150 4788 6138 Rank 1Y 12 13 78 5 7 5 32 110 5 14 54 126 25 Franklin India Bluechip Rank 1-Y v/s Asset (Rs.Cr) Rank 1Y
  • 22.
    212.94 633.78 471.17 620.12 1365.781378.531351.7 1730.1 1704 1829 1953 2014 4023 13 25 57 22 2 41 135 2 18 34 61 9 0 20 40 60 80 100 120 140 1600 500 1000 1500 2000 2500 3000 3500 4000 4500 Ranking AssetinCr. Jul-03 Jul-04 Jul-05 Jul-06 Jul-07 Jul-08 Jul-09 Jul-10 Jul-11 Jul-12 Jul-13 Jul-14 Jul-15 (Rs.Cr) 212.9 633.8 471.2 620.1 1366 1379 1352 1730 1704 1829 1953 2014 4023 Rank 1-Y 13 25 57 2 2 2 41 135 2 18 34 61 9 Franklin India Prima Plus Rank 1- Y v/s Asset (Rs.Cr) Rank 1-Y
  • 23.
    407.16 988.981148.51 2914.56 4620.96 3597.093308.3 6172 8405 9916 11501 10445 178085 43 24 2 4 6 13 34 3 30 54 13 110 0 20 40 60 80 100 1200 2000 4000 6000 8000 10000 12000 14000 16000 18000 20000 Jul-03Jul-04 Jul-05 Jul-06 Jul-07 Jul-08 Jul-09 Jul-10 Jul-11 Jul-12 Jul-13 Jul-14 Jul-15 Ranking AssetinCr. Jul- 03 Jul- 04 Jul- 05 Jul- 06 Jul- 07 Jul- 08 Jul- 09 Jul- 10 Jul- 11 Jul- 12 Jul- 13 Jul- 14 Jul- 15 (Rs.Cr) 407.2 989 1149 2915 4621 3597 3308 6172 8405 9916 115011044517808 Rank 1-Y 5 43 24 2 4 6 13 34 3 30 54 13 110 HDFC Equity Rank 1-Y v/s Asset (Rs.Cr) Rank 1-Y
  • 24.
    136.14 612.08595.59 1134 2048.812264 2872.7 7221 9591 11381 12017 10320 13247 4 21 28 1 3 1 10 80 8 44 55 5 105 0 20 40 60 80 100 1200 2000 4000 6000 8000 10000 12000 14000 Jul-03Jul-04 Jul-05 Jul-06 Jul-07 Jul-08 Jul-09 Jul-10 Jul-11 Jul-12 Jul-13 Jul-14 Jul-15 Ranking AssetinCr. Jul-03 Jul-04 Jul-05 Jul-06 Jul-07 Jul-08 Jul-09 Jul-10 Jul-11 Jul-12 Jul-13 Jul-14 Jul-15 (Rs.Cr) 136.14612.08595.59 1134 2048.8 2264 2872.7 7221 9591 11381 12017 10320 13247 Rank 1-Y 4 21 28 1 3 1 10 80 8 44 55 5 105 HDFC Top 200 Rank 1-Y v/s Asset (Rs.Cr) Rank 1-Y
  • 25.
    1008.2 2415.83 1509.97 1319.4 2160 2986 4119 3885 3670 5726 1 1 1 102 39 1516 68 9 108 0 20 40 60 80 100 1200 1000 2000 3000 4000 5000 6000 7000 Jul-03 Jul-04 Jul-05 Jul-06 Jul-07 Jul-08 Jul-09 Jul-10 Jul-11 Jul-12 Jul-13 Jul-14 Jul-15 Ranking AssetinCr. Jul-03 Jul-04 Jul-05 Jul-06 Jul-07 Jul-08 Jul-09 Jul-10 Jul-11 Jul-12 Jul-13 Jul-14 Jul-15 AuM 1008.22415.8 1510 1319.4 2160 2986 4119 3885 3670 5726 1-y Rank 1 1 1 102 39 15 16 68 9 108 ICICI Prudential Dynamic Fund Rank 1-Y v/s Asset AuM 1-y Rank
  • 26.
    386.69 991.97 738.82 300.74261.00 1084.00 1612.001779.00 2597.00 3040.00 9115.00 9 9 8 27 2 15 17 30 25 73 0 10 20 30 40 50 60 70 800 1000 2000 3000 4000 5000 6000 7000 8000 9000 10000 Jul-03Jul-04 Jul-05 Jul-06 Jul-07 Jul-08 Jul-09 Jul-10 Jul-11 Jul-12 Jul-13 Jul-14 Jul-15 Ranking AssetinCr. Jul-03 Jul-04 Jul-05 Jul-06 Jul-07 Jul-08 Jul-09 Jul-10 Jul-11 Jul-12 Jul-13 Jul-14 Jul-15 (Rs.Cr) 386.69991.97738.82300.74261.001084.01612.01779.02597.03040.09115.0 Rank 1Y 9 9 8 27 2 15 17 30 25 73 ICICI Pru Value Discovery Rank 1-Y v/s Asset (Rs.Cr) Rank 1Y
  • 27.
    1616.641777.22 2616.63 1586.43 1347.1 2034.00 2801 3340 4995 5216 11077 3 5 10 105 8 75 23 74 88 0 20 40 60 80 100 1200 2000 4000 6000 8000 10000 12000 Jul-03 Jul-04 Jul-05 Jul-06 Jul-07 Jul-08 Jul-09 Jul-10 Jul-11 Jul-12 Jul-13 Jul-14 Jul-15 Ranking AssetinCr. Jul-03 Jul-04 Jul-05 Jul-06 Jul-07 Jul-08 Jul-09 Jul-10 Jul-11 Jul-12 Jul-13 Jul-14 Jul-15 (Rs.Cr) 1616.61777.22616.61586.41347.12034.0 2801 3340 4995 5216 11077 Rank 1Y 3 5 10 105 8 7 5 23 74 88 Reliance Equity Opportunities Rank 1-Y v/s Asset (Rs.Cr) Rank 1Y
  • 28.
    38.71 460.62 1322.03 1962.87 4082.03 4792.09 4376.00 7272.00 7060.00 5844.00 5206.00 4106.00 5405.00 14 2 5 6 2 1 73 64 42 20 25 1819 0 10 20 30 40 50 60 70 800.00 1000.00 2000.00 3000.00 4000.00 5000.00 6000.00 7000.00 8000.00 Jul-03 Jul-04 Jul-05 Jul-06 Jul-07 Jul-08 Jul-09 Jul-10 Jul-11 Jul-12 Jul-13 Jul-14 Jul-15 Ranking AssetinCr. Jul-03 Jul-04 Jul-05 Jul-06 Jul-07 Jul-08 Jul-09 Jul-10 Jul-11 Jul-12 Jul-13 Jul-14 Jul-15 (Rs.Cr) 38.71 460.621322.01962.84082.04792.04376.07272.07060.05844.05206.04106.05405.0 Rank 1Y 14 2 5 6 2 1 73 64 42 20 25 18 19 Reliance Growth Rank 1-Y v/s Asset (Rs.Cr) Rank 1Y
  • 29.
  • 30.
    From above tableit is clearly seen that in Birla SL Equity fund the Asset and Ranking has negative relationship most of the time. Birla Sun Life Equity Date Rank 1Y (Rs. Cr) Effect Relation Jul-03 Jul-04 Jul-05 Jul-06 3 370.72 - - Jul-07 1 808.67 Asset Increased, Rank Increased Positive Jul-08 3 1021.18 Asset Increased, Rank Decreased Negative Jul-09 111 950.9 Asset Decreased, Rank Decreased Positive Jul-10 120 1142 Asset Increased, Rank Decreased Negative Jul-11 45 951 Asset Decreased, Rank Increased Negative Jul-12 28 750 Asset Decreased, Rank Increased Negative Jul-13 13 713 Asset Decreased, Rank Increased Negative Jul-14 2 653 Asset Decreased, Rank Increased Negative Jul-15 78 2020 Asset Increased, Rank Decreased Negative
  • 31.
    From above tableit is clearly seen that in Birla SL Midcap fund the Asset and Ranking has no relationship. Birla Sun Life Midcap Date Rank 1Y (Rs.Cr) Effect Relation Jul-03 16.11 - - Jul-04 18 105.81 Asset Increased No Relation Jul-05 26 135.81 Asset Increased, Rank Decreased Negative Jul-06 10 131.31 Asset Decreased, Rank Increased Negative Jul-07 1 367.35 Asset Increased, Rank Increased Positive Jul-08 4 505.81 Asset Increased, Rank Decreased Negative Jul-09 95 454.6 Asset Decreased, Rank Decreased Positive Jul-10 38 1746 Asset Increased, Rank Increased Positive Jul-11 38 1684 Asset Decreased, Rank neutral No Relation Jul-12 36 1309 Asset Decreased, Rank Increased Negative Jul-13 25 1179 Asset Decreased, Rank Increased Negative Jul-14 79 962 Asset Decreased, Rank Decreased Positive Jul-15 56 1481 Asset Increased, Rank Increased Positive
  • 32.
    From above tableit is clearly seen that in Franklin India Blue chip fund the Asset and Ranking has no relationship. Franklin India Blue chip Date Rank 1Y (Rs. Cr) Effect Relation Jul-03 12 663.95 - - Jul-04 13 1707.80 Asset Increased, Rank Decreased Negative Jul-05 78 1609.67 Asset Decreased, Rank Decreased Positive Jul-06 5 2104.03 Asset Increased, Rank Increased Positive Jul-07 7 2615.88 Asset Increased, Rank Decreased Negative Jul-08 5 2021.18 Asset Decreased, Rank Increased Negative Jul-09 32 1942.50 Asset Decreased, Rank Decreased Positive Jul-10 110 2916.00 Asset Increased, Rank Decreased Negative Jul-11 5 3397.00 Asset Increased, Rank Increased Positive Jul-12 14 4516.00 Asset Increased, Rank Decreased Negative Jul-13 54 5150.00 Asset Increased, Rank Decreased Negative Jul-14 126 4788.00 Asset Decreased, Rank Decreased Positive Jul-15 25 6138.00 Asset Increased, Rank Increased Positive
  • 33.
    From above tableit is clearly seen that in Franklin India Prima Plus fund the Asset and Ranking has negative relationship most of the time. Franklin India Prima Plus Date Rank 1-Y (Rs.Cr) Effect Relation Jul-03 13 212.94 - - Jul-04 25 633.78 Asset Increased, Rank Decreased Negative Jul-05 57 471.17 Asset Decreased, Rank Decreased Positive Jul-06 2 620.12 Asset Increased, Rank Increased Positive Jul-07 2 1365.78 Asset Increased, Rank Constant No relation Jul-08 2 1378.53 Asset Increased, Rank Constant No relation Jul-09 41 1351.7 Asset Decreased, Rank Decreased Positive Jul-10 135 1730.1 Asset Increased, Rank Decreased Negative Jul-11 2 1704 Asset Decreased, Rank Increased Negative Jul-12 18 1829 Asset Increased, Rank Decreased Negative Jul-13 34 1953 Asset Increased, Rank Decreased Negative Jul-14 61 2014 Asset Increased, Rank Decreased Negative Jul-15 9 4023 Asset Increased, Rank Increased Positive
  • 34.
    HDFC Equity Date Rank1-Y (Rs.Cr) Effect Relation Jul-03 5 407.16 - - Jul-04 43 988.98 Asset Increased, Rank Decreased Negative Jul-05 24 1148.51 Asset Increased, Rank Increased Positive Jul-06 2 2914.56 Asset Increased, Rank Increased Positive Jul-07 4 4620.96 Asset Increased, Rank Decreased Negative Jul-08 6 3597.09 Asset Decreased, Rank Decreased Positive Jul-09 13 3308.3 Asset Decreased, Rank Decreased Positive Jul-10 34 6172 Asset Increased, Rank Decreased Negative Jul-11 3 8405 Asset Increased, Rank Increased Positive Jul-12 30 9916 Asset Increased, Rank Decreased Negative Jul-13 54 11501 Asset Increased, Rank Decreased Negative Jul-14 13 10445 Asset Decreased, Rank Increased Negative Jul-15 110 17808 Asset Increased, Rank Decreased Negative From above table it is clearly seen that in HDFC Equity fund the Asset and Ranking has negative relationship most of the time.
  • 35.
    HDFC Top 200 DateRank 1-Y (Rs.Cr) Effect Relation Jul-03 4 136.14 - - Jul-04 21 612.08 Asset Increased, Rank Decreased Negative Jul-05 28 595.59 Asset Decreased, Rank Decreased Positive Jul-06 1 1134.00 Asset Increased, Rank Increased Positive Jul-07 3 2048.81 Asset Increased, Rank Decreased Negative Jul-08 1 2264.00 Asset Increased, Rank Increased Positive Jul-09 10 2872.70 Asset Increased, Rank Decreased Negative Jul-10 80 7221.00 Asset Increased, Rank Decreased Negative Jul-11 8 9591.00 Asset Increased, Rank Increased Positive Jul-12 44 11381.00 Asset Increased, Rank Decreased Negative Jul-13 55 12017.00 Asset Increased, Rank Decreased Negative Jul-14 5 10320.00 Asset Decreased, Rank Increased Negative Jul-15 105 13247.00 Asset Increased, Rank Decreased Negative From above table it is clearly seen that in HDFC Top 200 fund the Asset and Ranking has negative relationship most of the time.
  • 36.
    ICICI Prudential Dynamic Date1-y Rank AuM Effect Relation Jul-03 Jul-04 Jul-05 Jul-06 1 1008.2 - - Jul-07 1 2415.83 Asset Increased, Rank Constant No relation Jul-08 1 1509.97 Asset Decreased, Rank Constant No relation Jul-09 102 1319.40 Asset Increased, Rank Decreased Negative Jul-10 39 2160.00 Asset Increased, Rank Increased Positive Jul-11 15 2986.00 Asset Increased, Rank Increased Positive Jul-12 16 4119.00 Asset Increased, Rank Decreased Negative Jul-13 68 3885.00 Asset Decreased, Rank Decreased Positive Jul-14 9 3670.00 Asset Decreased, Rank Increased Positive Jul-15 108 5726.00 Asset Increased, Rank Decreased Positive From above table it is clearly seen that in ICICI Prudential Dynamic fund the Asset and Ranking has positive relationship most of the time.
  • 37.
    ICICI Prudential ValueDiscovery Date Rank 1Y (Rs.Cr) Effect Relation Jul-03 Jul-04 Jul-05 386.69 - - Jul-06 9 991.97 Asset Increased No relation Jul-07 9 738.82 Asset Decreased, Rank Constant No relation Jul-08 8 300.74 Asset Increased, Rank Increased Positive Jul-09 27 261.00 Asset Decreased, Rank Decreased Positive Jul-10 2 1084.00 Asset Increased, Rank Increased Positive Jul-11 15 1612.00 Asset Increased, Rank Decreased Negative Jul-12 17 1779.00 Asset Increased, Rank Decreased Negative Jul-13 30 2597.00 Asset Increased, Rank Decreased Negative Jul-14 25 3040.00 Asset Increased, Rank Increased Positive Jul-15 73 9115.00 Asset Increased, Rank Decreased Negative From above table it is clearly seen that in ICICI Prudential Value Discovery fund the Asset and Ranking has no relationship.
  • 38.
    Reliance Equity Opportunities DateRank 1Y (Rs.Cr) Effect Relation Jul-03 Jul-04 Jul-05 1616.64 - - Jul-06 3 1777.22 Asset Increased No relation Jul-07 5 2616.63 Asset Increased, Rank Decreased Negative Jul-08 10 1586.43 Asset Decreased, Rank Decreased Positive Jul-09 105 1347.1 Asset Decreased, Rank Decreased Positive Jul-10 8 2034.00 Asset Increased, Rank Increased Positive Jul-11 7 2801 Asset Increased, Rank Increased Positive Jul-12 5 3340 Asset Increased, Rank Increased Positive Jul-13 23 4995 Asset Increased, Rank Decreased Negative Jul-14 74 5216 Asset Increased, Rank Decreased Negative Jul-15 88 11077 Asset Increased, Rank Decreased Negative From above table it is clearly seen that in Reliance Equity Opportunities fund the Asset and Ranking has positive relationship most of the time.
  • 39.
    Reliance Growth Date Rank1Y (Rs.Cr) Effect Relation Jul-03 14 38.71 - - Jul-04 2 460.62 Asset Increased, Rank Increased Positive Jul-05 5 1322.03 Asset Increased, Rank Decreased Negative Jul-06 6 1962.87 Asset Increased, Rank Decreased Negative Jul-07 2 4082.03 Asset Increased, Rank Increased Positive Jul-08 1 4792.09 Asset Increased, Rank Increased Positive Jul-09 73 4376.00 Asset Decreased, Rank Decreased Positive Jul-10 64 7272.00 Asset Increased, Rank Increased Positive Jul-11 42 7060.00 Asset Decreased, Rank Increased Negative Jul-12 20 5844.00 Asset Decreased, Rank Increased Negative Jul-13 25 5206.00 Asset Decreased, Rank Decreased Positive Jul-14 18 4106.00 Asset Decreased, Rank Increased Negative Jul-15 19 5405.00 Asset Increased, Rank Decreased Negative From above table it is clearly seen that in Reliance Growth fund the Asset and Ranking has no relationship.
  • 40.
    Recommendation  We recommendinvestors to invest in mutual fund schemes after observing Performance & Ranking, Ratio analysis, Risk and return ratios, total expense ratio, Fund manager tenure and experience, Scheme asset size, investor’s risk taking capacity etc.  These parameters affect Asset of the scheme also. So, these should be considered at the time of investment.  If investor observe only one parameter it may mislead the investor for investing.
  • 41.
    Conclusion  According toour report we conclude by observing the data that the improvement in Rank of the particular scheme, the retail investors are attracted to invest in scheme. So, the improvement in Rank will increase the Asset under management in upcoming year.  The second reason of increase/decrease in the Asset of the scheme might be because of market fluctuation. If market will increase then stock price will increase which also increase assets of the scheme and vice versa.  And third might be that if the Mutual fund Managers are efficient in managing funds, despite of increase/decrease in asset the fund manager will manage fund effectively and it will give good returns to the investors. The following table clearly indicates the relationship of Rank with Asset of particular schemes.
  • 42.
    Sr. No. NameRelationship 1 Birla Sun Life Equity Negative on Asset 2 Birla SL Midcap No relation 3 Franklin India Blue Chip No relation 4 Franklin India Prima plus Negative on Asset 5 HDFC Equity Negative on Asset 6 HDFC Top 200 Negative on Asset 7 ICICI Prudential dynamic Fund Positive on Asset 8 ICICI Prudential Value Discovery No relation 9 Reliance Equity opportunities Positive on Asset 10 Reliance Growth No relation
  • 43.
    Bibliography  http://articles.economictimes.indiatimes.com/2014-08- 18/news/52941925_1_best-fund-performance-returns  http://www.nitinbhatia.in/personal-finance/misleading-mutual-fund- Ranking/ http://www.moneycontrol.com/news/mf-experts/5-parametersselecting- best-mutual-fund-scheme_945483.html  http://www.moneycontrol.com/news/mf-experts/how-to-choose-best- performing-mutual-funds_1132991.html
  • 44.