SlideShare a Scribd company logo
1 of 20
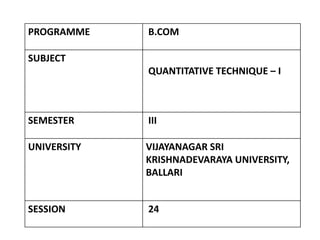
PROGRAMME B.COM
SUBJECT
QUANTITATIVE TECHNIQUE – I
SEMESTER III
UNIVERSITY VIJAYANAGAR SRI
KRISHNADEVARAYA UNIVERSITY,
BALLARI
SESSION 24
RECAP
• Graphical Representation, Meaning, Graph V/S
Diagrams, General Rules of Graph
LEARNING OBJECTIVES
• After Studying this unit, the students able to know
how to present data Graphically using Histogram,
Frequency Polygon and Curve, and Pie charts and
working out cumulative frequency
LEARNING OUTCOMES
• Students will be able to analyze and interpret with
in the Contexts they are written in Diagrams and to
present data Graphically using Histogram,
Frequency Polygon and Curve, and Pie charts
SESSION - 23
• Construction of Graphs ( Histogram, Frequency
Polygon and Curve) Problems---------------01
Construction of Graphs
• Types of Graphs
Histogram
Frequency polygon
Frequency curve
Ogives or Cumulative frequency curve
HISTOGRAM;
A histogram is an attached bar chart or graph displaying
the distribution of a frequency distribution in visual
form. Take classes along the X-axis and the frequencies
along the Y-axis. Corresponding to each class interval, a
vertical bar is drawn whose height is proportional to the
class frequency.
CONTD
We cannot construct a histogram for distribution with
open-ended classes. The histogram is also quite
misleading, if the distribution has unequal intervals.
PROBLEM 01
The following table shows the time taken (in minutes)
by 100 students to travel to school on a particular day.
Draw Histogram.
CONTD
CONTD
• FREQUENCY POLYGON
Frequency polygon is drawn after drawing histogram for
a given frequency distribution. The area covered under
the polygon is equal to the area of the histogram.
Vertices of the polygon represent the class frequencies.
Frequency polygon helps to determine the classes with
higher frequencies.
PROBLEM 02. A firm reported that its Net Worth in the
years 2011-2016 are as follows. Draw frequency polygon
CONTD
CONTD
• FREQUENCY CURVE
Frequency curve is a smooth and free-hand curve drawn
to represent a frequency distribution. Frequency curve
is drawn by smoothing the vertices of the frequency
polygon.
Frequency curve provides better understanding about
the properties of the data than frequency polygon and
histogram.
CONTD
PROBLEM 03
The ages of group of pensioners are given in the table
below.
Draw the Frequency curve to the following data.
CONTD
SUMMARY
As we already discussed and learnt today on
Diagrammatic and Graphical Representation as below
• Construction of Graphs ( Histogram, Frequency
Polygon and Curve) Problems---------------01
MCQs
1 . Histogram can be drawn only for:
(a) Discrete frequency distribution
(b) Continuous frequency distribution
(c) Cumulative frequency distribution
(d) Relative frequency distribution
2. Histogram is a graph of:
(a) Frequency distribution
(b) Time series
(c) Qualitative data
(d) Ogive
MCQs
3 . When successive mid-points in a histogram are
connected by straight lines, the graph is called a:
(a) Histogram
(b) Ogive
(c) Frequency curve
(d) Frequency polygon
4. A frequency polygon is a closed figure which is:
(a) One sided
(b) Two sided
(c) Three sided
(d) Many sided
MCQs
5 . Frequency polygon can be drawn with the help of:
(a) Historigram
(b) Histogram
(c) Circle
(d) Percentage
CONTD
ANSWERS
1. B
2. A
3. D
4. D
5. B
REFERENCES
• S.P. Gupta, Sultan Chand and Sons Publications, 2017
• S. C. Gupta, Himalaya Publishing House,
Fundamentals of Statistics, 2018
• R.S.N Pillai and Bagavathi, S.Chand publications, 2010
THANK YOU

More Related Content

Similar to graphical representation 2

Presentation of statistics
Presentation of statisticsPresentation of statistics
Presentation of statisticsJagdish Powar
 
frequency distribution table 1
frequency distribution table 1frequency distribution table 1
frequency distribution table 1AkkiMaruthi2
 
Frequency Distribution Table 1
Frequency Distribution Table 1Frequency Distribution Table 1
Frequency Distribution Table 1AkkiMaruthi2
 
graphical representation 1
graphical representation 1graphical representation 1
graphical representation 1AkkiMaruthi2
 
Frequency Distribution Table 3
Frequency Distribution Table 3Frequency Distribution Table 3
Frequency Distribution Table 3AkkiMaruthi2
 
frequency distribution table 3
frequency distribution table 3frequency distribution table 3
frequency distribution table 3AkkiMaruthi2
 
Presentation1.pptx
Presentation1.pptxPresentation1.pptx
Presentation1.pptxMANJUNATHMP7
 
Chapter Two (PART ONE).pptx
Chapter Two (PART ONE).pptxChapter Two (PART ONE).pptx
Chapter Two (PART ONE).pptxMohammedYonis2
 
PRESENTATION OF DATA.pptx
PRESENTATION OF DATA.pptxPRESENTATION OF DATA.pptx
PRESENTATION OF DATA.pptxajesh ps
 
collectionandrepresentationofdata1-200904192336.pptx
collectionandrepresentationofdata1-200904192336.pptxcollectionandrepresentationofdata1-200904192336.pptx
collectionandrepresentationofdata1-200904192336.pptxaibakimito
 
Sqqs1013 ch2-a122
Sqqs1013 ch2-a122Sqqs1013 ch2-a122
Sqqs1013 ch2-a122kim rae KI
 
Statistik Chapter 2
Statistik Chapter 2Statistik Chapter 2
Statistik Chapter 2WanBK Leo
 
COMPUTER GRAPHICS
COMPUTER GRAPHICSCOMPUTER GRAPHICS
COMPUTER GRAPHICSJagan Raja
 
Graphical representation of data mohit verma
Graphical representation of data mohit verma Graphical representation of data mohit verma
Graphical representation of data mohit verma MOHIT KUMAR VERMA
 
Image quality assessment and statistical evaluation
Image quality assessment and statistical evaluationImage quality assessment and statistical evaluation
Image quality assessment and statistical evaluationDocumentStory
 

Similar to graphical representation 2 (20)

Diagrams part 2
Diagrams part 2Diagrams part 2
Diagrams part 2
 
diagrams theory
diagrams theorydiagrams theory
diagrams theory
 
Presentation of statistics
Presentation of statisticsPresentation of statistics
Presentation of statistics
 
Visual Techniques
Visual TechniquesVisual Techniques
Visual Techniques
 
frequency distribution table 1
frequency distribution table 1frequency distribution table 1
frequency distribution table 1
 
Frequency Distribution Table 1
Frequency Distribution Table 1Frequency Distribution Table 1
Frequency Distribution Table 1
 
graphical representation 1
graphical representation 1graphical representation 1
graphical representation 1
 
Frequency Distribution Table 3
Frequency Distribution Table 3Frequency Distribution Table 3
Frequency Distribution Table 3
 
frequency distribution table 3
frequency distribution table 3frequency distribution table 3
frequency distribution table 3
 
Presentation1.pptx
Presentation1.pptxPresentation1.pptx
Presentation1.pptx
 
Chapter Two (PART ONE).pptx
Chapter Two (PART ONE).pptxChapter Two (PART ONE).pptx
Chapter Two (PART ONE).pptx
 
PRESENTATION OF DATA.pptx
PRESENTATION OF DATA.pptxPRESENTATION OF DATA.pptx
PRESENTATION OF DATA.pptx
 
collectionandrepresentationofdata1-200904192336.pptx
collectionandrepresentationofdata1-200904192336.pptxcollectionandrepresentationofdata1-200904192336.pptx
collectionandrepresentationofdata1-200904192336.pptx
 
Tabular and Graphical Representation of Data
Tabular and Graphical Representation of Data Tabular and Graphical Representation of Data
Tabular and Graphical Representation of Data
 
Frequency Polygon
Frequency PolygonFrequency Polygon
Frequency Polygon
 
Sqqs1013 ch2-a122
Sqqs1013 ch2-a122Sqqs1013 ch2-a122
Sqqs1013 ch2-a122
 
Statistik Chapter 2
Statistik Chapter 2Statistik Chapter 2
Statistik Chapter 2
 
COMPUTER GRAPHICS
COMPUTER GRAPHICSCOMPUTER GRAPHICS
COMPUTER GRAPHICS
 
Graphical representation of data mohit verma
Graphical representation of data mohit verma Graphical representation of data mohit verma
Graphical representation of data mohit verma
 
Image quality assessment and statistical evaluation
Image quality assessment and statistical evaluationImage quality assessment and statistical evaluation
Image quality assessment and statistical evaluation
 

More from AkkiMaruthi2

Bi variate Table 2
Bi variate Table 2Bi variate Table 2
Bi variate Table 2AkkiMaruthi2
 
Classification Theory
Classification Theory Classification Theory
Classification Theory AkkiMaruthi2
 
Frequency Distribution Table 4
Frequency Distribution Table 4Frequency Distribution Table 4
Frequency Distribution Table 4AkkiMaruthi2
 
Frequency Distribution Table 5
Frequency Distribution Table 5Frequency Distribution Table 5
Frequency Distribution Table 5AkkiMaruthi2
 
Frequency Distribution Table 2
Frequency Distribution Table 2Frequency Distribution Table 2
Frequency Distribution Table 2AkkiMaruthi2
 
Mean, median & mode 2
Mean, median & mode 2Mean, median & mode 2
Mean, median & mode 2AkkiMaruthi2
 
mean median mode 3
mean median mode 3mean median mode 3
mean median mode 3AkkiMaruthi2
 
Mean, median & mode 1
Mean, median & mode 1Mean, median & mode 1
Mean, median & mode 1AkkiMaruthi2
 
Range, Q.D and Co-efficient 2
Range, Q.D and Co-efficient 2Range, Q.D and Co-efficient 2
Range, Q.D and Co-efficient 2AkkiMaruthi2
 
Measures of Dispersion
Measures of DispersionMeasures of Dispersion
Measures of DispersionAkkiMaruthi2
 
Missing frequency 1
Missing frequency 1Missing frequency 1
Missing frequency 1AkkiMaruthi2
 
Mean Deviation and Co- efficient
Mean Deviation and Co- efficientMean Deviation and Co- efficient
Mean Deviation and Co- efficientAkkiMaruthi2
 

More from AkkiMaruthi2 (19)

Bi variate Table 2
Bi variate Table 2Bi variate Table 2
Bi variate Table 2
 
Tabulation 2
Tabulation 2Tabulation 2
Tabulation 2
 
Classification Theory
Classification Theory Classification Theory
Classification Theory
 
tabulation 3
tabulation 3tabulation 3
tabulation 3
 
Blank Table 1
Blank Table 1Blank Table 1
Blank Table 1
 
Bivariate table 1
Bivariate table 1Bivariate table 1
Bivariate table 1
 
Frequency Distribution Table 4
Frequency Distribution Table 4Frequency Distribution Table 4
Frequency Distribution Table 4
 
Frequency Distribution Table 5
Frequency Distribution Table 5Frequency Distribution Table 5
Frequency Distribution Table 5
 
Frequency Distribution Table 2
Frequency Distribution Table 2Frequency Distribution Table 2
Frequency Distribution Table 2
 
Mean, median & mode 2
Mean, median & mode 2Mean, median & mode 2
Mean, median & mode 2
 
KPC skewness 1
KPC skewness 1KPC skewness 1
KPC skewness 1
 
mean median mode 3
mean median mode 3mean median mode 3
mean median mode 3
 
Mean, median & mode 1
Mean, median & mode 1Mean, median & mode 1
Mean, median & mode 1
 
Range, Q.D and Co-efficient 2
Range, Q.D and Co-efficient 2Range, Q.D and Co-efficient 2
Range, Q.D and Co-efficient 2
 
KPC skewness 2
KPC skewness 2KPC skewness 2
KPC skewness 2
 
Measures of Dispersion
Measures of DispersionMeasures of Dispersion
Measures of Dispersion
 
Missing frequency 1
Missing frequency 1Missing frequency 1
Missing frequency 1
 
KPC skewness 2
KPC skewness 2KPC skewness 2
KPC skewness 2
 
Mean Deviation and Co- efficient
Mean Deviation and Co- efficientMean Deviation and Co- efficient
Mean Deviation and Co- efficient
 

Recently uploaded

Micro-Scholarship, What it is, How can it help me.pdf
Micro-Scholarship, What it is, How can it help me.pdfMicro-Scholarship, What it is, How can it help me.pdf
Micro-Scholarship, What it is, How can it help me.pdfPoh-Sun Goh
 
Google Gemini An AI Revolution in Education.pptx
Google Gemini An AI Revolution in Education.pptxGoogle Gemini An AI Revolution in Education.pptx
Google Gemini An AI Revolution in Education.pptxDr. Sarita Anand
 
Python Notes for mca i year students osmania university.docx
Python Notes for mca i year students osmania university.docxPython Notes for mca i year students osmania university.docx
Python Notes for mca i year students osmania university.docxRamakrishna Reddy Bijjam
 
HMCS Max Bernays Pre-Deployment Brief (May 2024).pptx
HMCS Max Bernays Pre-Deployment Brief (May 2024).pptxHMCS Max Bernays Pre-Deployment Brief (May 2024).pptx
HMCS Max Bernays Pre-Deployment Brief (May 2024).pptxEsquimalt MFRC
 
Basic Civil Engineering first year Notes- Chapter 4 Building.pptx
Basic Civil Engineering first year Notes- Chapter 4 Building.pptxBasic Civil Engineering first year Notes- Chapter 4 Building.pptx
Basic Civil Engineering first year Notes- Chapter 4 Building.pptxDenish Jangid
 
Understanding Accommodations and Modifications
Understanding  Accommodations and ModificationsUnderstanding  Accommodations and Modifications
Understanding Accommodations and ModificationsMJDuyan
 
Graduate Outcomes Presentation Slides - English
Graduate Outcomes Presentation Slides - EnglishGraduate Outcomes Presentation Slides - English
Graduate Outcomes Presentation Slides - Englishneillewis46
 
Key note speaker Neum_Admir Softic_ENG.pdf
Key note speaker Neum_Admir Softic_ENG.pdfKey note speaker Neum_Admir Softic_ENG.pdf
Key note speaker Neum_Admir Softic_ENG.pdfAdmir Softic
 
ICT role in 21st century education and it's challenges.
ICT role in 21st century education and it's challenges.ICT role in 21st century education and it's challenges.
ICT role in 21st century education and it's challenges.MaryamAhmad92
 
Holdier Curriculum Vitae (April 2024).pdf
Holdier Curriculum Vitae (April 2024).pdfHoldier Curriculum Vitae (April 2024).pdf
Holdier Curriculum Vitae (April 2024).pdfagholdier
 
TỔNG ÔN TẬP THI VÀO LỚP 10 MÔN TIẾNG ANH NĂM HỌC 2023 - 2024 CÓ ĐÁP ÁN (NGỮ Â...
TỔNG ÔN TẬP THI VÀO LỚP 10 MÔN TIẾNG ANH NĂM HỌC 2023 - 2024 CÓ ĐÁP ÁN (NGỮ Â...TỔNG ÔN TẬP THI VÀO LỚP 10 MÔN TIẾNG ANH NĂM HỌC 2023 - 2024 CÓ ĐÁP ÁN (NGỮ Â...
TỔNG ÔN TẬP THI VÀO LỚP 10 MÔN TIẾNG ANH NĂM HỌC 2023 - 2024 CÓ ĐÁP ÁN (NGỮ Â...Nguyen Thanh Tu Collection
 
Vishram Singh - Textbook of Anatomy Upper Limb and Thorax.. Volume 1 (1).pdf
Vishram Singh - Textbook of Anatomy  Upper Limb and Thorax.. Volume 1 (1).pdfVishram Singh - Textbook of Anatomy  Upper Limb and Thorax.. Volume 1 (1).pdf
Vishram Singh - Textbook of Anatomy Upper Limb and Thorax.. Volume 1 (1).pdfssuserdda66b
 
Fostering Friendships - Enhancing Social Bonds in the Classroom
Fostering Friendships - Enhancing Social Bonds  in the ClassroomFostering Friendships - Enhancing Social Bonds  in the Classroom
Fostering Friendships - Enhancing Social Bonds in the ClassroomPooky Knightsmith
 
1029-Danh muc Sach Giao Khoa khoi 6.pdf
1029-Danh muc Sach Giao Khoa khoi  6.pdf1029-Danh muc Sach Giao Khoa khoi  6.pdf
1029-Danh muc Sach Giao Khoa khoi 6.pdfQucHHunhnh
 
1029 - Danh muc Sach Giao Khoa 10 . pdf
1029 -  Danh muc Sach Giao Khoa 10 . pdf1029 -  Danh muc Sach Giao Khoa 10 . pdf
1029 - Danh muc Sach Giao Khoa 10 . pdfQucHHunhnh
 
SOC 101 Demonstration of Learning Presentation
SOC 101 Demonstration of Learning PresentationSOC 101 Demonstration of Learning Presentation
SOC 101 Demonstration of Learning Presentationcamerronhm
 
Sociology 101 Demonstration of Learning Exhibit
Sociology 101 Demonstration of Learning ExhibitSociology 101 Demonstration of Learning Exhibit
Sociology 101 Demonstration of Learning Exhibitjbellavia9
 
Single or Multiple melodic lines structure
Single or Multiple melodic lines structureSingle or Multiple melodic lines structure
Single or Multiple melodic lines structuredhanjurrannsibayan2
 
How to Create and Manage Wizard in Odoo 17
How to Create and Manage Wizard in Odoo 17How to Create and Manage Wizard in Odoo 17
How to Create and Manage Wizard in Odoo 17Celine George
 

Recently uploaded (20)

Micro-Scholarship, What it is, How can it help me.pdf
Micro-Scholarship, What it is, How can it help me.pdfMicro-Scholarship, What it is, How can it help me.pdf
Micro-Scholarship, What it is, How can it help me.pdf
 
Google Gemini An AI Revolution in Education.pptx
Google Gemini An AI Revolution in Education.pptxGoogle Gemini An AI Revolution in Education.pptx
Google Gemini An AI Revolution in Education.pptx
 
Python Notes for mca i year students osmania university.docx
Python Notes for mca i year students osmania university.docxPython Notes for mca i year students osmania university.docx
Python Notes for mca i year students osmania university.docx
 
HMCS Max Bernays Pre-Deployment Brief (May 2024).pptx
HMCS Max Bernays Pre-Deployment Brief (May 2024).pptxHMCS Max Bernays Pre-Deployment Brief (May 2024).pptx
HMCS Max Bernays Pre-Deployment Brief (May 2024).pptx
 
Basic Civil Engineering first year Notes- Chapter 4 Building.pptx
Basic Civil Engineering first year Notes- Chapter 4 Building.pptxBasic Civil Engineering first year Notes- Chapter 4 Building.pptx
Basic Civil Engineering first year Notes- Chapter 4 Building.pptx
 
Understanding Accommodations and Modifications
Understanding  Accommodations and ModificationsUnderstanding  Accommodations and Modifications
Understanding Accommodations and Modifications
 
Graduate Outcomes Presentation Slides - English
Graduate Outcomes Presentation Slides - EnglishGraduate Outcomes Presentation Slides - English
Graduate Outcomes Presentation Slides - English
 
Key note speaker Neum_Admir Softic_ENG.pdf
Key note speaker Neum_Admir Softic_ENG.pdfKey note speaker Neum_Admir Softic_ENG.pdf
Key note speaker Neum_Admir Softic_ENG.pdf
 
ICT role in 21st century education and it's challenges.
ICT role in 21st century education and it's challenges.ICT role in 21st century education and it's challenges.
ICT role in 21st century education and it's challenges.
 
Spatium Project Simulation student brief
Spatium Project Simulation student briefSpatium Project Simulation student brief
Spatium Project Simulation student brief
 
Holdier Curriculum Vitae (April 2024).pdf
Holdier Curriculum Vitae (April 2024).pdfHoldier Curriculum Vitae (April 2024).pdf
Holdier Curriculum Vitae (April 2024).pdf
 
TỔNG ÔN TẬP THI VÀO LỚP 10 MÔN TIẾNG ANH NĂM HỌC 2023 - 2024 CÓ ĐÁP ÁN (NGỮ Â...
TỔNG ÔN TẬP THI VÀO LỚP 10 MÔN TIẾNG ANH NĂM HỌC 2023 - 2024 CÓ ĐÁP ÁN (NGỮ Â...TỔNG ÔN TẬP THI VÀO LỚP 10 MÔN TIẾNG ANH NĂM HỌC 2023 - 2024 CÓ ĐÁP ÁN (NGỮ Â...
TỔNG ÔN TẬP THI VÀO LỚP 10 MÔN TIẾNG ANH NĂM HỌC 2023 - 2024 CÓ ĐÁP ÁN (NGỮ Â...
 
Vishram Singh - Textbook of Anatomy Upper Limb and Thorax.. Volume 1 (1).pdf
Vishram Singh - Textbook of Anatomy  Upper Limb and Thorax.. Volume 1 (1).pdfVishram Singh - Textbook of Anatomy  Upper Limb and Thorax.. Volume 1 (1).pdf
Vishram Singh - Textbook of Anatomy Upper Limb and Thorax.. Volume 1 (1).pdf
 
Fostering Friendships - Enhancing Social Bonds in the Classroom
Fostering Friendships - Enhancing Social Bonds  in the ClassroomFostering Friendships - Enhancing Social Bonds  in the Classroom
Fostering Friendships - Enhancing Social Bonds in the Classroom
 
1029-Danh muc Sach Giao Khoa khoi 6.pdf
1029-Danh muc Sach Giao Khoa khoi  6.pdf1029-Danh muc Sach Giao Khoa khoi  6.pdf
1029-Danh muc Sach Giao Khoa khoi 6.pdf
 
1029 - Danh muc Sach Giao Khoa 10 . pdf
1029 -  Danh muc Sach Giao Khoa 10 . pdf1029 -  Danh muc Sach Giao Khoa 10 . pdf
1029 - Danh muc Sach Giao Khoa 10 . pdf
 
SOC 101 Demonstration of Learning Presentation
SOC 101 Demonstration of Learning PresentationSOC 101 Demonstration of Learning Presentation
SOC 101 Demonstration of Learning Presentation
 
Sociology 101 Demonstration of Learning Exhibit
Sociology 101 Demonstration of Learning ExhibitSociology 101 Demonstration of Learning Exhibit
Sociology 101 Demonstration of Learning Exhibit
 
Single or Multiple melodic lines structure
Single or Multiple melodic lines structureSingle or Multiple melodic lines structure
Single or Multiple melodic lines structure
 
How to Create and Manage Wizard in Odoo 17
How to Create and Manage Wizard in Odoo 17How to Create and Manage Wizard in Odoo 17
How to Create and Manage Wizard in Odoo 17
 

graphical representation 2

  • 1. PROGRAMME B.COM SUBJECT QUANTITATIVE TECHNIQUE – I SEMESTER III UNIVERSITY VIJAYANAGAR SRI KRISHNADEVARAYA UNIVERSITY, BALLARI SESSION 24
  • 2. RECAP • Graphical Representation, Meaning, Graph V/S Diagrams, General Rules of Graph
  • 3. LEARNING OBJECTIVES • After Studying this unit, the students able to know how to present data Graphically using Histogram, Frequency Polygon and Curve, and Pie charts and working out cumulative frequency
  • 4. LEARNING OUTCOMES • Students will be able to analyze and interpret with in the Contexts they are written in Diagrams and to present data Graphically using Histogram, Frequency Polygon and Curve, and Pie charts
  • 5. SESSION - 23 • Construction of Graphs ( Histogram, Frequency Polygon and Curve) Problems---------------01
  • 6. Construction of Graphs • Types of Graphs Histogram Frequency polygon Frequency curve Ogives or Cumulative frequency curve HISTOGRAM; A histogram is an attached bar chart or graph displaying the distribution of a frequency distribution in visual form. Take classes along the X-axis and the frequencies along the Y-axis. Corresponding to each class interval, a vertical bar is drawn whose height is proportional to the class frequency.
  • 7. CONTD We cannot construct a histogram for distribution with open-ended classes. The histogram is also quite misleading, if the distribution has unequal intervals. PROBLEM 01 The following table shows the time taken (in minutes) by 100 students to travel to school on a particular day. Draw Histogram.
  • 9. CONTD • FREQUENCY POLYGON Frequency polygon is drawn after drawing histogram for a given frequency distribution. The area covered under the polygon is equal to the area of the histogram. Vertices of the polygon represent the class frequencies. Frequency polygon helps to determine the classes with higher frequencies. PROBLEM 02. A firm reported that its Net Worth in the years 2011-2016 are as follows. Draw frequency polygon
  • 10. CONTD
  • 11. CONTD • FREQUENCY CURVE Frequency curve is a smooth and free-hand curve drawn to represent a frequency distribution. Frequency curve is drawn by smoothing the vertices of the frequency polygon. Frequency curve provides better understanding about the properties of the data than frequency polygon and histogram.
  • 12. CONTD PROBLEM 03 The ages of group of pensioners are given in the table below. Draw the Frequency curve to the following data.
  • 13. CONTD
  • 14. SUMMARY As we already discussed and learnt today on Diagrammatic and Graphical Representation as below • Construction of Graphs ( Histogram, Frequency Polygon and Curve) Problems---------------01
  • 15. MCQs 1 . Histogram can be drawn only for: (a) Discrete frequency distribution (b) Continuous frequency distribution (c) Cumulative frequency distribution (d) Relative frequency distribution 2. Histogram is a graph of: (a) Frequency distribution (b) Time series (c) Qualitative data (d) Ogive
  • 16. MCQs 3 . When successive mid-points in a histogram are connected by straight lines, the graph is called a: (a) Histogram (b) Ogive (c) Frequency curve (d) Frequency polygon 4. A frequency polygon is a closed figure which is: (a) One sided (b) Two sided (c) Three sided (d) Many sided
  • 17. MCQs 5 . Frequency polygon can be drawn with the help of: (a) Historigram (b) Histogram (c) Circle (d) Percentage
  • 19. REFERENCES • S.P. Gupta, Sultan Chand and Sons Publications, 2017 • S. C. Gupta, Himalaya Publishing House, Fundamentals of Statistics, 2018 • R.S.N Pillai and Bagavathi, S.Chand publications, 2010