
Recommended
More Related Content
Similar to Frequency Distribution Table 4
Similar to Frequency Distribution Table 4 (20)
More from AkkiMaruthi2
More from AkkiMaruthi2 (20)
Recently uploaded
Recently uploaded (20)
Frequency Distribution Table 4
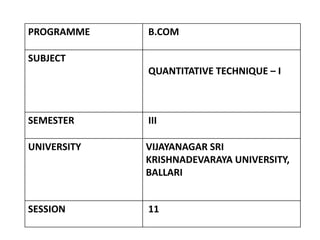
- 1. PROGRAMME B.COM SUBJECT QUANTITATIVE TECHNIQUE – I SEMESTER III UNIVERSITY VIJAYANAGAR SRI KRISHNADEVARAYA UNIVERSITY, BALLARI SESSION 11
- 2. RECAP • Preparation of Frequency Distribution Table - Continuous Series Problems ----------- 01
- 3. LEARNING OBJECTIVES • The aim of the chapter is to make students to present data in textual and Tabular format including the technique of creating frequency distribution and working out bi-variate distribution table
- 4. LEARNING OUTCOMES • After the Chapter, The Students Shall be able to Describe and Understand the Rules & Types of Classification, Frequency Distribution, Class Interval & its Types, Basic Principles Tabulation and The Sorting of Data.
- 5. SESSION - 11 • Preparation of Frequency Distribution Table - Continuous Series(Exclusive) Problems-02
- 6. EXAMPLE; 01 Marks scored by 50 students are given below form a frequency distribution with a class of 10. 04, 10, 14, 20, 25, 35, 65, 75, 10, 15 05, 20, 25, 30, 35, 40, 85, 95, 98, 20 50, 60, 65, 65, 35, 20, 10, 95, 85, 30 05, 15, 20, 25, 25, 30, 68, 75, 35, 45 12, 15, 20, 25, 30, 40, 48, 78, 88, 35. Construct grouped frequency distribution table.
- 7. CONTD CLASS INTERVAL TALLY MARKS FREQUENCY 0-10 III 03 10-20 IIII III 08 20-30 IIII IIII I 11 30-40 IIII IIII 09 40-50 IIII 04 50-60 I 01 60-70 IIII 05 70-80 III 03 80-90 III 03 90-100 III 03 TOTAL 50
- 8. EXAMPLE; 02 The following are the number of replacement parts used In a mill 50 consecutive weeks for a certain groups of similar machine. 48, 41, 45, 52, 47, 46, 54, 43, 46, 47 45, 36, 56, 44, 61, 68, 42, 58, 51, 47 48, 49, 42, 48, 53, 48, 41, 65, 45, 52 58, 50, 55, 45, 43, 69, 63, 45, 38, 43 42, 47, 43, 49, 46, 57, 49, 44, 47, 49 Construct a frequency table with 5 Class Interval
- 9. CONTD CLASS INTERVAL TALLY MARKS FREQUENCY 35-40 II 02 40-45 IIII IIII I 11 45-50 IIII IIII IIII IIII I 21 50-55 IIII I 06 55-60 IIII 05 60-65 II 02 65-70 III 03 TOTAL 50
- 10. SUMMARY As we already discussed and learnt today on Classifications and Tabulation as below • Preparation of Frequency Distribution Table - Continuous Series(Exclusive) Problems-02
- 11. MCQs 1. The suitable formula for computing the number of classes is: (a) 3.322 logN (b) 0.322 logN (c) 1+3.322 logN (d) 1- 3.322 logN 2. The number of classes in a frequency distribution is obtained by dividing the range of variable by the: (a) Total frequency (b) Class interval (c) Mid-point (d) Relative frequency
- 12. MCQs 3 . If the number of workers in a factory is 256, the number of classes will be: (a) 8 (b) 9 (c) 10 (d) 12 4 . The largest and the smallest values of any given class of a frequency distribution are called: (a) Class Intervals (b) Class marks (c) Class boundaries (d) Class limits
- 13. MCQs 5 . If there are no gaps between consecutive classes, the limits are called: (a) Class limits (b) Class boundaries (c) Class intervals (d) Class marks
- 14. CONTD ANSWERS 1. C 2. B 3. B 4. D 5. B
- 15. REFERENCES • S.P. Gupta, Sultan Chand and Sons Publications, 2017 • S. C. Gupta, Himalaya Publishing House, Fundamentals of Statistics, 2018 • R.S.N Pillai and Bagavathi, S.Chand publications, 2010
- 16. THANK YOU