SlideShare a Scribd company logo
1 of 17
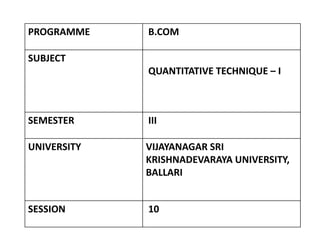
PROGRAMME B.COM
SUBJECT
QUANTITATIVE TECHNIQUE – I
SEMESTER III
UNIVERSITY VIJAYANAGAR SRI
KRISHNADEVARAYA UNIVERSITY,
BALLARI
SESSION 10
RECAP
• Preparation of Frequency Distribution Table Discrete
Series Problems -- 02
LEARNING OBJECTIVES
• The aim of the chapter is to make students to
present data in textual and Tabular format including
the technique of creating frequency distribution
and working out bi-variate distribution table
LEARNING OUTCOMES
• After the Chapter, The Students Shall be able to
Describe and Understand the Rules & Types of
Classification, Frequency Distribution, Class Interval
& its Types, Basic Principles Tabulation and The
Sorting of Data.
SESSION - 10
• Preparation of Frequency Distribution Table -
Continuous Series Problems ----------- 01
CONTINUOUS FREQUENCY DISTRIBUTION
• In statistics Frequency distribution continuous is an
arrangement of the values that one or more variables
take in a sample.
• Each entry in the table contains the frequency or count
of the occurrences of values within a particular group
or interval, and in this way, the table summarizes the
distribution of values in the sample.
CONTD
• Data collected from tests and experiments may have
little meaning to the investigator until they have been
arranged or classified in some systematic way.
• The steps in grouping may be summarized as follows:
1. Decide on the number of classes.
2. Determine the range, i.e., the difference
between the highest and lowest observations in the
data.
3. Divide range by the number of classes to
estimate approximate size of the interval (h or C).
CONTD
4. Find the lower class limit of the lowest class and
add to it the class- interval to get the upper class
limit.
5. Obtain class-limits for the remaining classes by
adding the class-interval to the limits of the
previous class.
6. Count numbers of frequencies in each class and
check against the total number of observations
EXAMPLE
• Consider the following marks (out of 50) obtained in
Mathematics by 60 students of Class VIII:
21, 10, 30, 22, 33, 5 , 37, 12, 25, 42, 15, 39, 26, 32, 18,
27, 28, 19, 29, 35, 31, 24,36, 18, 20, 38, 22, 44, 16, 24,
10, 27, 39, 28, 49, 29, 32, 23, 31, 21, 34, 22, 23, 36, 24,
36, 33, 47, 48, 50 , 39, 20, 7, 16, 36, 45, 47, 30, 22, 17.
Construct grouped frequency distribution table taking
10 Class interval.
CONTD
CLASS INTERVAL TALLY MARKS FREQUENCY
0-10 II 02
10-20 IIII IIII 10
20-30 IIII IIII IIII IIII I 21
30-40 IIII IIII IIII IIII 19
40-50 IIII II 07
50-60 I 01
TOTAL 60
SUMMARY
As we already discussed and learnt today on
Classifications and Tabulation as below
• Preparation of Frequency Distribution Table -
Continuous Series Problems ----------- 01
MCQs
1 . The grouped data are called:
(a) Primary data
(b) Secondary data
(c) Raw data
(d) Difficult to tell
2 . A series of data with exclusive classes along with the
corresponding frequencies is called:
(a) Discrete frequency distribution
(b) Continuous frequency distribution
(c) Percentage frequency distribution
(d) Cumulative frequency distribution
MCQs
3 . In an exclusive classification, the limits excluded are
(a) Upper limits
(b) Lower limits
(c) Both lower and upper limits
(d) Either lower or upper limits
4 . Weights; 15-20, 20-25, 25-30, 30-35, 35-40
No.of items 10, 15, 30 , 10, 5,
The above series is categorized as:
(a) Continuous series
(b) Discrete series
(c) Time series
(d) Geometric series
MCQs
5 . The number of classes in a frequency distribution is
obtained by dividing the range of variable by the:
(a) Total frequency
(b) Class interval
(c) Mid-point
(d) Relative frequency
CONTD
ANSWERS
1. B
2. B
3. D
4. A
5. B
REFERENCES
• S.P. Gupta, Sultan Chand and Sons Publications, 2017
• S. C. Gupta, Himalaya Publishing House,
Fundamentals of Statistics, 2018
• R.S.N Pillai and Bagavathi, S.Chand publications, 2010
THANK YOU

More Related Content

Similar to Frequency Distribution Table 3

Frequency Distribution (Class-interval- Tally).pptx
Frequency Distribution (Class-interval- Tally).pptxFrequency Distribution (Class-interval- Tally).pptx
Frequency Distribution (Class-interval- Tally).pptxAlwinCAsuncion
 
Classification Theory
Classification Theory Classification Theory
Classification Theory AkkiMaruthi2
 
Tabulation and Classification
Tabulation and ClassificationTabulation and Classification
Tabulation and ClassificationAkkiMaruthi2
 
Graphical presentation of data
Graphical presentation of dataGraphical presentation of data
Graphical presentation of dataprince irfan
 
Aed1222 lesson 5
Aed1222 lesson 5Aed1222 lesson 5
Aed1222 lesson 5nurun2010
 
Frequency Distribution
Frequency DistributionFrequency Distribution
Frequency DistributionTeacherMariza
 
3_-frequency_distribution.pptx
3_-frequency_distribution.pptx3_-frequency_distribution.pptx
3_-frequency_distribution.pptxitzsudipto99
 
graphical representation 3
graphical representation 3graphical representation 3
graphical representation 3AkkiMaruthi2
 
Utilization of Data: Introduction to Statistics
Utilization of Data: Introduction to StatisticsUtilization of Data: Introduction to Statistics
Utilization of Data: Introduction to StatisticsChristine Mejino
 
Final Lecture - 2.ppt
Final Lecture - 2.pptFinal Lecture - 2.ppt
Final Lecture - 2.pptssuserbe1d97
 
Nota Bab 1 JF608
Nota Bab 1 JF608Nota Bab 1 JF608
Nota Bab 1 JF608Mira Awang
 
Chapter 7 statistics
Chapter 7  statisticsChapter 7  statistics
Chapter 7 statisticsatiqah ayie
 
Analysis and interpretation of Assessment.pptx
Analysis and interpretation of Assessment.pptxAnalysis and interpretation of Assessment.pptx
Analysis and interpretation of Assessment.pptxAeonneFlux
 
Utilization-of-assessment-data-assessmentinLearning1.pptx
Utilization-of-assessment-data-assessmentinLearning1.pptxUtilization-of-assessment-data-assessmentinLearning1.pptx
Utilization-of-assessment-data-assessmentinLearning1.pptxEdeleneGetes
 
Ch 3 Organisation of Data 1 (1).pptx
Ch 3 Organisation of Data 1 (1).pptxCh 3 Organisation of Data 1 (1).pptx
Ch 3 Organisation of Data 1 (1).pptxsyedmohd9
 
Mean, median & mode 1
Mean, median & mode 1Mean, median & mode 1
Mean, median & mode 1AkkiMaruthi2
 
frequency distribution table 2
frequency distribution table 2frequency distribution table 2
frequency distribution table 2AkkiMaruthi2
 
Frequency Distribution Table 2
Frequency Distribution Table 2Frequency Distribution Table 2
Frequency Distribution Table 2AkkiMaruthi2
 

Similar to Frequency Distribution Table 3 (20)

Frequency Distribution (Class-interval- Tally).pptx
Frequency Distribution (Class-interval- Tally).pptxFrequency Distribution (Class-interval- Tally).pptx
Frequency Distribution (Class-interval- Tally).pptx
 
Classification Theory
Classification Theory Classification Theory
Classification Theory
 
Tabulation and Classification
Tabulation and ClassificationTabulation and Classification
Tabulation and Classification
 
Graphical presentation of data
Graphical presentation of dataGraphical presentation of data
Graphical presentation of data
 
Aed1222 lesson 5
Aed1222 lesson 5Aed1222 lesson 5
Aed1222 lesson 5
 
Frequency Distribution
Frequency DistributionFrequency Distribution
Frequency Distribution
 
3_-frequency_distribution.pptx
3_-frequency_distribution.pptx3_-frequency_distribution.pptx
3_-frequency_distribution.pptx
 
Classification of data
Classification of dataClassification of data
Classification of data
 
graphical representation 3
graphical representation 3graphical representation 3
graphical representation 3
 
Utilization of Data: Introduction to Statistics
Utilization of Data: Introduction to StatisticsUtilization of Data: Introduction to Statistics
Utilization of Data: Introduction to Statistics
 
Final Lecture - 2.ppt
Final Lecture - 2.pptFinal Lecture - 2.ppt
Final Lecture - 2.ppt
 
Nota Bab 1 JF608
Nota Bab 1 JF608Nota Bab 1 JF608
Nota Bab 1 JF608
 
Chapter 7 statistics
Chapter 7  statisticsChapter 7  statistics
Chapter 7 statistics
 
Analysis and interpretation of Assessment.pptx
Analysis and interpretation of Assessment.pptxAnalysis and interpretation of Assessment.pptx
Analysis and interpretation of Assessment.pptx
 
Utilization-of-assessment-data-assessmentinLearning1.pptx
Utilization-of-assessment-data-assessmentinLearning1.pptxUtilization-of-assessment-data-assessmentinLearning1.pptx
Utilization-of-assessment-data-assessmentinLearning1.pptx
 
Basic statics
Basic staticsBasic statics
Basic statics
 
Ch 3 Organisation of Data 1 (1).pptx
Ch 3 Organisation of Data 1 (1).pptxCh 3 Organisation of Data 1 (1).pptx
Ch 3 Organisation of Data 1 (1).pptx
 
Mean, median & mode 1
Mean, median & mode 1Mean, median & mode 1
Mean, median & mode 1
 
frequency distribution table 2
frequency distribution table 2frequency distribution table 2
frequency distribution table 2
 
Frequency Distribution Table 2
Frequency Distribution Table 2Frequency Distribution Table 2
Frequency Distribution Table 2
 

More from AkkiMaruthi2

Mean, median & mode 2
Mean, median & mode 2Mean, median & mode 2
Mean, median & mode 2AkkiMaruthi2
 
mean median mode 3
mean median mode 3mean median mode 3
mean median mode 3AkkiMaruthi2
 
Range, Q.D and Co-efficient 2
Range, Q.D and Co-efficient 2Range, Q.D and Co-efficient 2
Range, Q.D and Co-efficient 2AkkiMaruthi2
 
graphical representation 1
graphical representation 1graphical representation 1
graphical representation 1AkkiMaruthi2
 
graphical representation 4
graphical representation 4graphical representation 4
graphical representation 4AkkiMaruthi2
 
graphical representation 5
graphical representation 5graphical representation 5
graphical representation 5AkkiMaruthi2
 
graphical representation 2
graphical representation 2graphical representation 2
graphical representation 2AkkiMaruthi2
 
Measures of Dispersion
Measures of DispersionMeasures of Dispersion
Measures of DispersionAkkiMaruthi2
 
Missing frequency 1
Missing frequency 1Missing frequency 1
Missing frequency 1AkkiMaruthi2
 
Mean Deviation and Co- efficient
Mean Deviation and Co- efficientMean Deviation and Co- efficient
Mean Deviation and Co- efficientAkkiMaruthi2
 
graphical representation 6
graphical representation 6graphical representation 6
graphical representation 6AkkiMaruthi2
 

More from AkkiMaruthi2 (20)

Tabulation 2
Tabulation 2Tabulation 2
Tabulation 2
 
tabulation 3
tabulation 3tabulation 3
tabulation 3
 
Blank Table 1
Blank Table 1Blank Table 1
Blank Table 1
 
Bivariate table 1
Bivariate table 1Bivariate table 1
Bivariate table 1
 
Mean, median & mode 2
Mean, median & mode 2Mean, median & mode 2
Mean, median & mode 2
 
KPC skewness 1
KPC skewness 1KPC skewness 1
KPC skewness 1
 
mean median mode 3
mean median mode 3mean median mode 3
mean median mode 3
 
Range, Q.D and Co-efficient 2
Range, Q.D and Co-efficient 2Range, Q.D and Co-efficient 2
Range, Q.D and Co-efficient 2
 
graphical representation 1
graphical representation 1graphical representation 1
graphical representation 1
 
KPC skewness 2
KPC skewness 2KPC skewness 2
KPC skewness 2
 
graphical representation 4
graphical representation 4graphical representation 4
graphical representation 4
 
graphical representation 5
graphical representation 5graphical representation 5
graphical representation 5
 
graphical representation 2
graphical representation 2graphical representation 2
graphical representation 2
 
Measures of Dispersion
Measures of DispersionMeasures of Dispersion
Measures of Dispersion
 
Missing frequency 1
Missing frequency 1Missing frequency 1
Missing frequency 1
 
diagrams theory
diagrams theorydiagrams theory
diagrams theory
 
KPC skewness 2
KPC skewness 2KPC skewness 2
KPC skewness 2
 
Diagrams part 2
Diagrams part 2Diagrams part 2
Diagrams part 2
 
Mean Deviation and Co- efficient
Mean Deviation and Co- efficientMean Deviation and Co- efficient
Mean Deviation and Co- efficient
 
graphical representation 6
graphical representation 6graphical representation 6
graphical representation 6
 

Recently uploaded

MARGINALIZATION (Different learners in Marginalized Group
MARGINALIZATION (Different learners in Marginalized GroupMARGINALIZATION (Different learners in Marginalized Group
MARGINALIZATION (Different learners in Marginalized GroupJonathanParaisoCruz
 
Meghan Sutherland In Media Res Media Component
Meghan Sutherland In Media Res Media ComponentMeghan Sutherland In Media Res Media Component
Meghan Sutherland In Media Res Media ComponentInMediaRes1
 
Roles & Responsibilities in Pharmacovigilance
Roles & Responsibilities in PharmacovigilanceRoles & Responsibilities in Pharmacovigilance
Roles & Responsibilities in PharmacovigilanceSamikshaHamane
 
History Class XII Ch. 3 Kinship, Caste and Class (1).pptx
History Class XII Ch. 3 Kinship, Caste and Class (1).pptxHistory Class XII Ch. 3 Kinship, Caste and Class (1).pptx
History Class XII Ch. 3 Kinship, Caste and Class (1).pptxsocialsciencegdgrohi
 
Solving Puzzles Benefits Everyone (English).pptx
Solving Puzzles Benefits Everyone (English).pptxSolving Puzzles Benefits Everyone (English).pptx
Solving Puzzles Benefits Everyone (English).pptxOH TEIK BIN
 
Software Engineering Methodologies (overview)
Software Engineering Methodologies (overview)Software Engineering Methodologies (overview)
Software Engineering Methodologies (overview)eniolaolutunde
 
Types of Journalistic Writing Grade 8.pptx
Types of Journalistic Writing Grade 8.pptxTypes of Journalistic Writing Grade 8.pptx
Types of Journalistic Writing Grade 8.pptxEyham Joco
 
18-04-UA_REPORT_MEDIALITERAСY_INDEX-DM_23-1-final-eng.pdf
18-04-UA_REPORT_MEDIALITERAСY_INDEX-DM_23-1-final-eng.pdf18-04-UA_REPORT_MEDIALITERAСY_INDEX-DM_23-1-final-eng.pdf
18-04-UA_REPORT_MEDIALITERAСY_INDEX-DM_23-1-final-eng.pdfssuser54595a
 
DATA STRUCTURE AND ALGORITHM for beginners
DATA STRUCTURE AND ALGORITHM for beginnersDATA STRUCTURE AND ALGORITHM for beginners
DATA STRUCTURE AND ALGORITHM for beginnersSabitha Banu
 
Capitol Tech U Doctoral Presentation - April 2024.pptx
Capitol Tech U Doctoral Presentation - April 2024.pptxCapitol Tech U Doctoral Presentation - April 2024.pptx
Capitol Tech U Doctoral Presentation - April 2024.pptxCapitolTechU
 
Pharmacognosy Flower 3. Compositae 2023.pdf
Pharmacognosy Flower 3. Compositae 2023.pdfPharmacognosy Flower 3. Compositae 2023.pdf
Pharmacognosy Flower 3. Compositae 2023.pdfMahmoud M. Sallam
 
Alper Gobel In Media Res Media Component
Alper Gobel In Media Res Media ComponentAlper Gobel In Media Res Media Component
Alper Gobel In Media Res Media ComponentInMediaRes1
 
Final demo Grade 9 for demo Plan dessert.pptx
Final demo Grade 9 for demo Plan dessert.pptxFinal demo Grade 9 for demo Plan dessert.pptx
Final demo Grade 9 for demo Plan dessert.pptxAvyJaneVismanos
 
Introduction to ArtificiaI Intelligence in Higher Education
Introduction to ArtificiaI Intelligence in Higher EducationIntroduction to ArtificiaI Intelligence in Higher Education
Introduction to ArtificiaI Intelligence in Higher Educationpboyjonauth
 
ECONOMIC CONTEXT - PAPER 1 Q3: NEWSPAPERS.pptx
ECONOMIC CONTEXT - PAPER 1 Q3: NEWSPAPERS.pptxECONOMIC CONTEXT - PAPER 1 Q3: NEWSPAPERS.pptx
ECONOMIC CONTEXT - PAPER 1 Q3: NEWSPAPERS.pptxiammrhaywood
 

Recently uploaded (20)

MARGINALIZATION (Different learners in Marginalized Group
MARGINALIZATION (Different learners in Marginalized GroupMARGINALIZATION (Different learners in Marginalized Group
MARGINALIZATION (Different learners in Marginalized Group
 
Meghan Sutherland In Media Res Media Component
Meghan Sutherland In Media Res Media ComponentMeghan Sutherland In Media Res Media Component
Meghan Sutherland In Media Res Media Component
 
Roles & Responsibilities in Pharmacovigilance
Roles & Responsibilities in PharmacovigilanceRoles & Responsibilities in Pharmacovigilance
Roles & Responsibilities in Pharmacovigilance
 
History Class XII Ch. 3 Kinship, Caste and Class (1).pptx
History Class XII Ch. 3 Kinship, Caste and Class (1).pptxHistory Class XII Ch. 3 Kinship, Caste and Class (1).pptx
History Class XII Ch. 3 Kinship, Caste and Class (1).pptx
 
TataKelola dan KamSiber Kecerdasan Buatan v022.pdf
TataKelola dan KamSiber Kecerdasan Buatan v022.pdfTataKelola dan KamSiber Kecerdasan Buatan v022.pdf
TataKelola dan KamSiber Kecerdasan Buatan v022.pdf
 
Solving Puzzles Benefits Everyone (English).pptx
Solving Puzzles Benefits Everyone (English).pptxSolving Puzzles Benefits Everyone (English).pptx
Solving Puzzles Benefits Everyone (English).pptx
 
Software Engineering Methodologies (overview)
Software Engineering Methodologies (overview)Software Engineering Methodologies (overview)
Software Engineering Methodologies (overview)
 
Types of Journalistic Writing Grade 8.pptx
Types of Journalistic Writing Grade 8.pptxTypes of Journalistic Writing Grade 8.pptx
Types of Journalistic Writing Grade 8.pptx
 
Model Call Girl in Tilak Nagar Delhi reach out to us at 🔝9953056974🔝
Model Call Girl in Tilak Nagar Delhi reach out to us at 🔝9953056974🔝Model Call Girl in Tilak Nagar Delhi reach out to us at 🔝9953056974🔝
Model Call Girl in Tilak Nagar Delhi reach out to us at 🔝9953056974🔝
 
18-04-UA_REPORT_MEDIALITERAСY_INDEX-DM_23-1-final-eng.pdf
18-04-UA_REPORT_MEDIALITERAСY_INDEX-DM_23-1-final-eng.pdf18-04-UA_REPORT_MEDIALITERAСY_INDEX-DM_23-1-final-eng.pdf
18-04-UA_REPORT_MEDIALITERAСY_INDEX-DM_23-1-final-eng.pdf
 
DATA STRUCTURE AND ALGORITHM for beginners
DATA STRUCTURE AND ALGORITHM for beginnersDATA STRUCTURE AND ALGORITHM for beginners
DATA STRUCTURE AND ALGORITHM for beginners
 
Capitol Tech U Doctoral Presentation - April 2024.pptx
Capitol Tech U Doctoral Presentation - April 2024.pptxCapitol Tech U Doctoral Presentation - April 2024.pptx
Capitol Tech U Doctoral Presentation - April 2024.pptx
 
Pharmacognosy Flower 3. Compositae 2023.pdf
Pharmacognosy Flower 3. Compositae 2023.pdfPharmacognosy Flower 3. Compositae 2023.pdf
Pharmacognosy Flower 3. Compositae 2023.pdf
 
Alper Gobel In Media Res Media Component
Alper Gobel In Media Res Media ComponentAlper Gobel In Media Res Media Component
Alper Gobel In Media Res Media Component
 
Final demo Grade 9 for demo Plan dessert.pptx
Final demo Grade 9 for demo Plan dessert.pptxFinal demo Grade 9 for demo Plan dessert.pptx
Final demo Grade 9 for demo Plan dessert.pptx
 
9953330565 Low Rate Call Girls In Rohini Delhi NCR
9953330565 Low Rate Call Girls In Rohini  Delhi NCR9953330565 Low Rate Call Girls In Rohini  Delhi NCR
9953330565 Low Rate Call Girls In Rohini Delhi NCR
 
OS-operating systems- ch04 (Threads) ...
OS-operating systems- ch04 (Threads) ...OS-operating systems- ch04 (Threads) ...
OS-operating systems- ch04 (Threads) ...
 
ESSENTIAL of (CS/IT/IS) class 06 (database)
ESSENTIAL of (CS/IT/IS) class 06 (database)ESSENTIAL of (CS/IT/IS) class 06 (database)
ESSENTIAL of (CS/IT/IS) class 06 (database)
 
Introduction to ArtificiaI Intelligence in Higher Education
Introduction to ArtificiaI Intelligence in Higher EducationIntroduction to ArtificiaI Intelligence in Higher Education
Introduction to ArtificiaI Intelligence in Higher Education
 
ECONOMIC CONTEXT - PAPER 1 Q3: NEWSPAPERS.pptx
ECONOMIC CONTEXT - PAPER 1 Q3: NEWSPAPERS.pptxECONOMIC CONTEXT - PAPER 1 Q3: NEWSPAPERS.pptx
ECONOMIC CONTEXT - PAPER 1 Q3: NEWSPAPERS.pptx
 

Frequency Distribution Table 3

  • 1. PROGRAMME B.COM SUBJECT QUANTITATIVE TECHNIQUE – I SEMESTER III UNIVERSITY VIJAYANAGAR SRI KRISHNADEVARAYA UNIVERSITY, BALLARI SESSION 10
  • 2. RECAP • Preparation of Frequency Distribution Table Discrete Series Problems -- 02
  • 3. LEARNING OBJECTIVES • The aim of the chapter is to make students to present data in textual and Tabular format including the technique of creating frequency distribution and working out bi-variate distribution table
  • 4. LEARNING OUTCOMES • After the Chapter, The Students Shall be able to Describe and Understand the Rules & Types of Classification, Frequency Distribution, Class Interval & its Types, Basic Principles Tabulation and The Sorting of Data.
  • 5. SESSION - 10 • Preparation of Frequency Distribution Table - Continuous Series Problems ----------- 01
  • 6. CONTINUOUS FREQUENCY DISTRIBUTION • In statistics Frequency distribution continuous is an arrangement of the values that one or more variables take in a sample. • Each entry in the table contains the frequency or count of the occurrences of values within a particular group or interval, and in this way, the table summarizes the distribution of values in the sample.
  • 7. CONTD • Data collected from tests and experiments may have little meaning to the investigator until they have been arranged or classified in some systematic way. • The steps in grouping may be summarized as follows: 1. Decide on the number of classes. 2. Determine the range, i.e., the difference between the highest and lowest observations in the data. 3. Divide range by the number of classes to estimate approximate size of the interval (h or C).
  • 8. CONTD 4. Find the lower class limit of the lowest class and add to it the class- interval to get the upper class limit. 5. Obtain class-limits for the remaining classes by adding the class-interval to the limits of the previous class. 6. Count numbers of frequencies in each class and check against the total number of observations
  • 9. EXAMPLE • Consider the following marks (out of 50) obtained in Mathematics by 60 students of Class VIII: 21, 10, 30, 22, 33, 5 , 37, 12, 25, 42, 15, 39, 26, 32, 18, 27, 28, 19, 29, 35, 31, 24,36, 18, 20, 38, 22, 44, 16, 24, 10, 27, 39, 28, 49, 29, 32, 23, 31, 21, 34, 22, 23, 36, 24, 36, 33, 47, 48, 50 , 39, 20, 7, 16, 36, 45, 47, 30, 22, 17. Construct grouped frequency distribution table taking 10 Class interval.
  • 10. CONTD CLASS INTERVAL TALLY MARKS FREQUENCY 0-10 II 02 10-20 IIII IIII 10 20-30 IIII IIII IIII IIII I 21 30-40 IIII IIII IIII IIII 19 40-50 IIII II 07 50-60 I 01 TOTAL 60
  • 11. SUMMARY As we already discussed and learnt today on Classifications and Tabulation as below • Preparation of Frequency Distribution Table - Continuous Series Problems ----------- 01
  • 12. MCQs 1 . The grouped data are called: (a) Primary data (b) Secondary data (c) Raw data (d) Difficult to tell 2 . A series of data with exclusive classes along with the corresponding frequencies is called: (a) Discrete frequency distribution (b) Continuous frequency distribution (c) Percentage frequency distribution (d) Cumulative frequency distribution
  • 13. MCQs 3 . In an exclusive classification, the limits excluded are (a) Upper limits (b) Lower limits (c) Both lower and upper limits (d) Either lower or upper limits 4 . Weights; 15-20, 20-25, 25-30, 30-35, 35-40 No.of items 10, 15, 30 , 10, 5, The above series is categorized as: (a) Continuous series (b) Discrete series (c) Time series (d) Geometric series
  • 14. MCQs 5 . The number of classes in a frequency distribution is obtained by dividing the range of variable by the: (a) Total frequency (b) Class interval (c) Mid-point (d) Relative frequency
  • 16. REFERENCES • S.P. Gupta, Sultan Chand and Sons Publications, 2017 • S. C. Gupta, Himalaya Publishing House, Fundamentals of Statistics, 2018 • R.S.N Pillai and Bagavathi, S.Chand publications, 2010