SlideShare a Scribd company logo
1 of 14
PROGRAMME B.COM
SUBJECT
QUANTITATIVE TECHNIQUE – I
SEMESTER III
UNIVERSITY VIJAYANAGAR SRI
KRISHNADEVARAYA UNIVERSITY,
BALLARI
SESSION 08
RECAP
• Types of Classifications and Types of Series
(Individual , Discrete & Continuous)
LEARNING OBJECTIVES
• The aim of the chapter is to make students to
present data in textual and Tabular format including
the technique of creating frequency distribution
and working out bi-variate distribution table
LEARNING OUTCOMES
• After the Chapter, The Students Shall be able to
Describe and Understand the Rules & Types of
Classification, Frequency Distribution, Class Interval
& its Types, Basic Principles Tabulation and The
Sorting of Data.
SESSION - 9
• Preparation of Frequency Distribution Table
Meaning-- Discrete Series Problems -- 01
Meaning of Frequency Distribution:
• In Statistics, a frequency distribution table is a chart
that summarizes values and their frequency, i.e. the
number of times the values have occurred.
Steps of Frequency Distribution: Four steps they are
• we should form table of three columns, with heading
of Observations, Tally marks and Frequency.
• In the first Column, place all possible values of
variables or observations.
CONT.,
• In the second column draw tally marks vertically against
the observations. After a particular value has occurred
four times, for the fifth occurrence we put a cross tally
marks IIII ( 5 )
• In the third column (Frequency column) count the
number of marks corresponding to each value of the
variable and place it.
• Discrete or Ungrouped Frequency distribution series
In this case, the observations or variables are counted
that how many times repeated is called the frequency of
that class.
Example of Discrete Series
• Example: A survey was taken on Maple Avenue. In each of
20 homes, people were asked how many cars were
registered to their households. The results were recorded
as follows: 3,1,4, 0, 2, 1, 5, 2, 1, 5, 4, 2, 3, 2, 0, 2, 1, 0, 3,2.
Present this data in Frequency Distribution Table.
Ans;
Number of Cars Tally marks Frequencies
0 III 3
1 IIII 4
2 IIII I 6
3 III 3
4 II 2
5 II 2
Total 20
SUMMARY
As we already discussed and learnt today on
Classifications and Tabulation as below
• Preparation of Frequency Distribution Table
Meaning-- Discrete Series Problems -- 01
MCQs
1. In an array, the data are:
(a) In ascending order
(b) In descending order
(c) Either (a) or (b)
(d) Neither (a) or (b)
2. The number of tally sheet count for each value or a
group is called:
(a) Class limit
(b) Class width
(c) Class boundary
(d) Frequency
MCQs
3. The frequency distribution according to individual
variate values is called:
(a) Discrete frequency distribution
(b) Cumulative frequency distribution
(c) Percentage frequency distribution
(d) Continuous frequency distribution
4. A series arranged according to each and every item is
known as:
(a) Discrete series
(b) Continuous series
(c) Individual series
(d) Time series
MCQs
5. A frequency distribution can be:
(a) Qualitative
(b) Discrete
(c) Continuous
(d) Both (b) and (c)
ANSWERS
1. C
2. D
3. A
4. C
5. D
REFERENCES
• S.P. Gupta, Sultan Chand and Sons Publications, 2017
• S. C. Gupta, Himalaya Publishing House,
Fundamentals of Statistics, 2018
• R.S.N Pillai and Bagavathi, S.Chand publications, 2010
THANK YOU

More Related Content

Similar to frequency distribution table 1

Frequency Distribution
Frequency DistributionFrequency Distribution
Frequency DistributionTeacherMariza
 
Frequency Distribution Table 5
Frequency Distribution Table 5Frequency Distribution Table 5
Frequency Distribution Table 5AkkiMaruthi2
 
frequency distribution table 5
frequency distribution table 5frequency distribution table 5
frequency distribution table 5AkkiMaruthi2
 
graphical representation 2
graphical representation 2graphical representation 2
graphical representation 2AkkiMaruthi2
 
graphical representation 3
graphical representation 3graphical representation 3
graphical representation 3AkkiMaruthi2
 
Bi variate Table 2
Bi variate Table 2Bi variate Table 2
Bi variate Table 2AkkiMaruthi2
 
Bi variate frequency distribution table 2
Bi variate frequency distribution table 2Bi variate frequency distribution table 2
Bi variate frequency distribution table 2AkkiMaruthi2
 
Graphical presentation of data
Graphical presentation of dataGraphical presentation of data
Graphical presentation of dataprince irfan
 
Frequency Distribution Table 4
Frequency Distribution Table 4Frequency Distribution Table 4
Frequency Distribution Table 4AkkiMaruthi2
 
frequency distribution table 4
frequency distribution table 4frequency distribution table 4
frequency distribution table 4AkkiMaruthi2
 
graphical representation 5
graphical representation 5graphical representation 5
graphical representation 5AkkiMaruthi2
 
Ch 3 Organisation of Data 1 (1).pptx
Ch 3 Organisation of Data 1 (1).pptxCh 3 Organisation of Data 1 (1).pptx
Ch 3 Organisation of Data 1 (1).pptxsyedmohd9
 
Textual and tabular format problems
Textual and tabular format problemsTextual and tabular format problems
Textual and tabular format problemsAkkiMaruthi2
 
An Introduction to Statistics
An Introduction to StatisticsAn Introduction to Statistics
An Introduction to StatisticsNazrul Islam
 
Summarizing Data : Listing and Grouping pdf
Summarizing Data : Listing and Grouping pdfSummarizing Data : Listing and Grouping pdf
Summarizing Data : Listing and Grouping pdfJustynOwen
 
The Frequency distribution table.pptx
The Frequency distribution table.pptxThe Frequency distribution table.pptx
The Frequency distribution table.pptxmariadanielapereyra
 
Bi variate frequency distribution table 1
Bi variate frequency distribution table 1Bi variate frequency distribution table 1
Bi variate frequency distribution table 1AkkiMaruthi2
 

Similar to frequency distribution table 1 (20)

Frequency Distribution
Frequency DistributionFrequency Distribution
Frequency Distribution
 
Frequency Distribution Table 5
Frequency Distribution Table 5Frequency Distribution Table 5
Frequency Distribution Table 5
 
frequency distribution table 5
frequency distribution table 5frequency distribution table 5
frequency distribution table 5
 
graphical representation 2
graphical representation 2graphical representation 2
graphical representation 2
 
graphical representation 3
graphical representation 3graphical representation 3
graphical representation 3
 
Bi variate Table 2
Bi variate Table 2Bi variate Table 2
Bi variate Table 2
 
Bi variate frequency distribution table 2
Bi variate frequency distribution table 2Bi variate frequency distribution table 2
Bi variate frequency distribution table 2
 
Graphical presentation of data
Graphical presentation of dataGraphical presentation of data
Graphical presentation of data
 
Data organization
Data organizationData organization
Data organization
 
Frequency Distribution Table 4
Frequency Distribution Table 4Frequency Distribution Table 4
Frequency Distribution Table 4
 
frequency distribution table 4
frequency distribution table 4frequency distribution table 4
frequency distribution table 4
 
graphical representation 5
graphical representation 5graphical representation 5
graphical representation 5
 
Classification of data
Classification of dataClassification of data
Classification of data
 
Ch 3 Organisation of Data 1 (1).pptx
Ch 3 Organisation of Data 1 (1).pptxCh 3 Organisation of Data 1 (1).pptx
Ch 3 Organisation of Data 1 (1).pptx
 
Textual and tabular format problems
Textual and tabular format problemsTextual and tabular format problems
Textual and tabular format problems
 
Blank Table 1
Blank Table 1Blank Table 1
Blank Table 1
 
An Introduction to Statistics
An Introduction to StatisticsAn Introduction to Statistics
An Introduction to Statistics
 
Summarizing Data : Listing and Grouping pdf
Summarizing Data : Listing and Grouping pdfSummarizing Data : Listing and Grouping pdf
Summarizing Data : Listing and Grouping pdf
 
The Frequency distribution table.pptx
The Frequency distribution table.pptxThe Frequency distribution table.pptx
The Frequency distribution table.pptx
 
Bi variate frequency distribution table 1
Bi variate frequency distribution table 1Bi variate frequency distribution table 1
Bi variate frequency distribution table 1
 

More from AkkiMaruthi2

Frequency Distribution Table 1
Frequency Distribution Table 1Frequency Distribution Table 1
Frequency Distribution Table 1AkkiMaruthi2
 
Mean, median & mode 2
Mean, median & mode 2Mean, median & mode 2
Mean, median & mode 2AkkiMaruthi2
 
mean median mode 3
mean median mode 3mean median mode 3
mean median mode 3AkkiMaruthi2
 
Mean, median & mode 1
Mean, median & mode 1Mean, median & mode 1
Mean, median & mode 1AkkiMaruthi2
 
Range, Q.D and Co-efficient 2
Range, Q.D and Co-efficient 2Range, Q.D and Co-efficient 2
Range, Q.D and Co-efficient 2AkkiMaruthi2
 
graphical representation 1
graphical representation 1graphical representation 1
graphical representation 1AkkiMaruthi2
 
graphical representation 4
graphical representation 4graphical representation 4
graphical representation 4AkkiMaruthi2
 
Measures of Dispersion
Measures of DispersionMeasures of Dispersion
Measures of DispersionAkkiMaruthi2
 
Missing frequency 1
Missing frequency 1Missing frequency 1
Missing frequency 1AkkiMaruthi2
 
Mean Deviation and Co- efficient
Mean Deviation and Co- efficientMean Deviation and Co- efficient
Mean Deviation and Co- efficientAkkiMaruthi2
 
graphical representation 6
graphical representation 6graphical representation 6
graphical representation 6AkkiMaruthi2
 

More from AkkiMaruthi2 (19)

tabulation 3
tabulation 3tabulation 3
tabulation 3
 
Bivariate table 1
Bivariate table 1Bivariate table 1
Bivariate table 1
 
Frequency Distribution Table 1
Frequency Distribution Table 1Frequency Distribution Table 1
Frequency Distribution Table 1
 
Mean, median & mode 2
Mean, median & mode 2Mean, median & mode 2
Mean, median & mode 2
 
KPC skewness 1
KPC skewness 1KPC skewness 1
KPC skewness 1
 
mean median mode 3
mean median mode 3mean median mode 3
mean median mode 3
 
Mean, median & mode 1
Mean, median & mode 1Mean, median & mode 1
Mean, median & mode 1
 
Range, Q.D and Co-efficient 2
Range, Q.D and Co-efficient 2Range, Q.D and Co-efficient 2
Range, Q.D and Co-efficient 2
 
graphical representation 1
graphical representation 1graphical representation 1
graphical representation 1
 
KPC skewness 2
KPC skewness 2KPC skewness 2
KPC skewness 2
 
graphical representation 4
graphical representation 4graphical representation 4
graphical representation 4
 
Measures of Dispersion
Measures of DispersionMeasures of Dispersion
Measures of Dispersion
 
Missing frequency 1
Missing frequency 1Missing frequency 1
Missing frequency 1
 
diagrams theory
diagrams theorydiagrams theory
diagrams theory
 
KPC skewness 2
KPC skewness 2KPC skewness 2
KPC skewness 2
 
Diagrams part 2
Diagrams part 2Diagrams part 2
Diagrams part 2
 
Mean Deviation and Co- efficient
Mean Deviation and Co- efficientMean Deviation and Co- efficient
Mean Deviation and Co- efficient
 
graphical representation 6
graphical representation 6graphical representation 6
graphical representation 6
 
Diagrams part 3
Diagrams part 3Diagrams part 3
Diagrams part 3
 

Recently uploaded

Unit-IV; Professional Sales Representative (PSR).pptx
Unit-IV; Professional Sales Representative (PSR).pptxUnit-IV; Professional Sales Representative (PSR).pptx
Unit-IV; Professional Sales Representative (PSR).pptxVishalSingh1417
 
TỔNG ÔN TẬP THI VÀO LỚP 10 MÔN TIẾNG ANH NĂM HỌC 2023 - 2024 CÓ ĐÁP ÁN (NGỮ Â...
TỔNG ÔN TẬP THI VÀO LỚP 10 MÔN TIẾNG ANH NĂM HỌC 2023 - 2024 CÓ ĐÁP ÁN (NGỮ Â...TỔNG ÔN TẬP THI VÀO LỚP 10 MÔN TIẾNG ANH NĂM HỌC 2023 - 2024 CÓ ĐÁP ÁN (NGỮ Â...
TỔNG ÔN TẬP THI VÀO LỚP 10 MÔN TIẾNG ANH NĂM HỌC 2023 - 2024 CÓ ĐÁP ÁN (NGỮ Â...Nguyen Thanh Tu Collection
 
ICT role in 21st century education and it's challenges.
ICT role in 21st century education and it's challenges.ICT role in 21st century education and it's challenges.
ICT role in 21st century education and it's challenges.MaryamAhmad92
 
Accessible Digital Futures project (20/03/2024)
Accessible Digital Futures project (20/03/2024)Accessible Digital Futures project (20/03/2024)
Accessible Digital Futures project (20/03/2024)Jisc
 
SOC 101 Demonstration of Learning Presentation
SOC 101 Demonstration of Learning PresentationSOC 101 Demonstration of Learning Presentation
SOC 101 Demonstration of Learning Presentationcamerronhm
 
How to Give a Domain for a Field in Odoo 17
How to Give a Domain for a Field in Odoo 17How to Give a Domain for a Field in Odoo 17
How to Give a Domain for a Field in Odoo 17Celine George
 
Food safety_Challenges food safety laboratories_.pdf
Food safety_Challenges food safety laboratories_.pdfFood safety_Challenges food safety laboratories_.pdf
Food safety_Challenges food safety laboratories_.pdfSherif Taha
 
Google Gemini An AI Revolution in Education.pptx
Google Gemini An AI Revolution in Education.pptxGoogle Gemini An AI Revolution in Education.pptx
Google Gemini An AI Revolution in Education.pptxDr. Sarita Anand
 
2024-NATIONAL-LEARNING-CAMP-AND-OTHER.pptx
2024-NATIONAL-LEARNING-CAMP-AND-OTHER.pptx2024-NATIONAL-LEARNING-CAMP-AND-OTHER.pptx
2024-NATIONAL-LEARNING-CAMP-AND-OTHER.pptxMaritesTamaniVerdade
 
The basics of sentences session 3pptx.pptx
The basics of sentences session 3pptx.pptxThe basics of sentences session 3pptx.pptx
The basics of sentences session 3pptx.pptxheathfieldcps1
 
Holdier Curriculum Vitae (April 2024).pdf
Holdier Curriculum Vitae (April 2024).pdfHoldier Curriculum Vitae (April 2024).pdf
Holdier Curriculum Vitae (April 2024).pdfagholdier
 
UGC NET Paper 1 Mathematical Reasoning & Aptitude.pdf
UGC NET Paper 1 Mathematical Reasoning & Aptitude.pdfUGC NET Paper 1 Mathematical Reasoning & Aptitude.pdf
UGC NET Paper 1 Mathematical Reasoning & Aptitude.pdfNirmal Dwivedi
 
ICT Role in 21st Century Education & its Challenges.pptx
ICT Role in 21st Century Education & its Challenges.pptxICT Role in 21st Century Education & its Challenges.pptx
ICT Role in 21st Century Education & its Challenges.pptxAreebaZafar22
 
This PowerPoint helps students to consider the concept of infinity.
This PowerPoint helps students to consider the concept of infinity.This PowerPoint helps students to consider the concept of infinity.
This PowerPoint helps students to consider the concept of infinity.christianmathematics
 
HMCS Max Bernays Pre-Deployment Brief (May 2024).pptx
HMCS Max Bernays Pre-Deployment Brief (May 2024).pptxHMCS Max Bernays Pre-Deployment Brief (May 2024).pptx
HMCS Max Bernays Pre-Deployment Brief (May 2024).pptxEsquimalt MFRC
 
1029 - Danh muc Sach Giao Khoa 10 . pdf
1029 -  Danh muc Sach Giao Khoa 10 . pdf1029 -  Danh muc Sach Giao Khoa 10 . pdf
1029 - Danh muc Sach Giao Khoa 10 . pdfQucHHunhnh
 
Dyslexia AI Workshop for Slideshare.pptx
Dyslexia AI Workshop for Slideshare.pptxDyslexia AI Workshop for Slideshare.pptx
Dyslexia AI Workshop for Slideshare.pptxcallscotland1987
 
1029-Danh muc Sach Giao Khoa khoi 6.pdf
1029-Danh muc Sach Giao Khoa khoi  6.pdf1029-Danh muc Sach Giao Khoa khoi  6.pdf
1029-Danh muc Sach Giao Khoa khoi 6.pdfQucHHunhnh
 
Vishram Singh - Textbook of Anatomy Upper Limb and Thorax.. Volume 1 (1).pdf
Vishram Singh - Textbook of Anatomy  Upper Limb and Thorax.. Volume 1 (1).pdfVishram Singh - Textbook of Anatomy  Upper Limb and Thorax.. Volume 1 (1).pdf
Vishram Singh - Textbook of Anatomy Upper Limb and Thorax.. Volume 1 (1).pdfssuserdda66b
 

Recently uploaded (20)

Unit-IV; Professional Sales Representative (PSR).pptx
Unit-IV; Professional Sales Representative (PSR).pptxUnit-IV; Professional Sales Representative (PSR).pptx
Unit-IV; Professional Sales Representative (PSR).pptx
 
TỔNG ÔN TẬP THI VÀO LỚP 10 MÔN TIẾNG ANH NĂM HỌC 2023 - 2024 CÓ ĐÁP ÁN (NGỮ Â...
TỔNG ÔN TẬP THI VÀO LỚP 10 MÔN TIẾNG ANH NĂM HỌC 2023 - 2024 CÓ ĐÁP ÁN (NGỮ Â...TỔNG ÔN TẬP THI VÀO LỚP 10 MÔN TIẾNG ANH NĂM HỌC 2023 - 2024 CÓ ĐÁP ÁN (NGỮ Â...
TỔNG ÔN TẬP THI VÀO LỚP 10 MÔN TIẾNG ANH NĂM HỌC 2023 - 2024 CÓ ĐÁP ÁN (NGỮ Â...
 
ICT role in 21st century education and it's challenges.
ICT role in 21st century education and it's challenges.ICT role in 21st century education and it's challenges.
ICT role in 21st century education and it's challenges.
 
Accessible Digital Futures project (20/03/2024)
Accessible Digital Futures project (20/03/2024)Accessible Digital Futures project (20/03/2024)
Accessible Digital Futures project (20/03/2024)
 
SOC 101 Demonstration of Learning Presentation
SOC 101 Demonstration of Learning PresentationSOC 101 Demonstration of Learning Presentation
SOC 101 Demonstration of Learning Presentation
 
How to Give a Domain for a Field in Odoo 17
How to Give a Domain for a Field in Odoo 17How to Give a Domain for a Field in Odoo 17
How to Give a Domain for a Field in Odoo 17
 
Food safety_Challenges food safety laboratories_.pdf
Food safety_Challenges food safety laboratories_.pdfFood safety_Challenges food safety laboratories_.pdf
Food safety_Challenges food safety laboratories_.pdf
 
Google Gemini An AI Revolution in Education.pptx
Google Gemini An AI Revolution in Education.pptxGoogle Gemini An AI Revolution in Education.pptx
Google Gemini An AI Revolution in Education.pptx
 
2024-NATIONAL-LEARNING-CAMP-AND-OTHER.pptx
2024-NATIONAL-LEARNING-CAMP-AND-OTHER.pptx2024-NATIONAL-LEARNING-CAMP-AND-OTHER.pptx
2024-NATIONAL-LEARNING-CAMP-AND-OTHER.pptx
 
Spatium Project Simulation student brief
Spatium Project Simulation student briefSpatium Project Simulation student brief
Spatium Project Simulation student brief
 
The basics of sentences session 3pptx.pptx
The basics of sentences session 3pptx.pptxThe basics of sentences session 3pptx.pptx
The basics of sentences session 3pptx.pptx
 
Holdier Curriculum Vitae (April 2024).pdf
Holdier Curriculum Vitae (April 2024).pdfHoldier Curriculum Vitae (April 2024).pdf
Holdier Curriculum Vitae (April 2024).pdf
 
UGC NET Paper 1 Mathematical Reasoning & Aptitude.pdf
UGC NET Paper 1 Mathematical Reasoning & Aptitude.pdfUGC NET Paper 1 Mathematical Reasoning & Aptitude.pdf
UGC NET Paper 1 Mathematical Reasoning & Aptitude.pdf
 
ICT Role in 21st Century Education & its Challenges.pptx
ICT Role in 21st Century Education & its Challenges.pptxICT Role in 21st Century Education & its Challenges.pptx
ICT Role in 21st Century Education & its Challenges.pptx
 
This PowerPoint helps students to consider the concept of infinity.
This PowerPoint helps students to consider the concept of infinity.This PowerPoint helps students to consider the concept of infinity.
This PowerPoint helps students to consider the concept of infinity.
 
HMCS Max Bernays Pre-Deployment Brief (May 2024).pptx
HMCS Max Bernays Pre-Deployment Brief (May 2024).pptxHMCS Max Bernays Pre-Deployment Brief (May 2024).pptx
HMCS Max Bernays Pre-Deployment Brief (May 2024).pptx
 
1029 - Danh muc Sach Giao Khoa 10 . pdf
1029 -  Danh muc Sach Giao Khoa 10 . pdf1029 -  Danh muc Sach Giao Khoa 10 . pdf
1029 - Danh muc Sach Giao Khoa 10 . pdf
 
Dyslexia AI Workshop for Slideshare.pptx
Dyslexia AI Workshop for Slideshare.pptxDyslexia AI Workshop for Slideshare.pptx
Dyslexia AI Workshop for Slideshare.pptx
 
1029-Danh muc Sach Giao Khoa khoi 6.pdf
1029-Danh muc Sach Giao Khoa khoi  6.pdf1029-Danh muc Sach Giao Khoa khoi  6.pdf
1029-Danh muc Sach Giao Khoa khoi 6.pdf
 
Vishram Singh - Textbook of Anatomy Upper Limb and Thorax.. Volume 1 (1).pdf
Vishram Singh - Textbook of Anatomy  Upper Limb and Thorax.. Volume 1 (1).pdfVishram Singh - Textbook of Anatomy  Upper Limb and Thorax.. Volume 1 (1).pdf
Vishram Singh - Textbook of Anatomy Upper Limb and Thorax.. Volume 1 (1).pdf
 

frequency distribution table 1

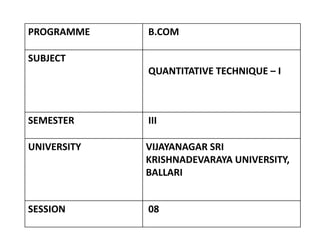
  • 1. PROGRAMME B.COM SUBJECT QUANTITATIVE TECHNIQUE – I SEMESTER III UNIVERSITY VIJAYANAGAR SRI KRISHNADEVARAYA UNIVERSITY, BALLARI SESSION 08
  • 2. RECAP • Types of Classifications and Types of Series (Individual , Discrete & Continuous)
  • 3. LEARNING OBJECTIVES • The aim of the chapter is to make students to present data in textual and Tabular format including the technique of creating frequency distribution and working out bi-variate distribution table
  • 4. LEARNING OUTCOMES • After the Chapter, The Students Shall be able to Describe and Understand the Rules & Types of Classification, Frequency Distribution, Class Interval & its Types, Basic Principles Tabulation and The Sorting of Data.
  • 5. SESSION - 9 • Preparation of Frequency Distribution Table Meaning-- Discrete Series Problems -- 01
  • 6. Meaning of Frequency Distribution: • In Statistics, a frequency distribution table is a chart that summarizes values and their frequency, i.e. the number of times the values have occurred. Steps of Frequency Distribution: Four steps they are • we should form table of three columns, with heading of Observations, Tally marks and Frequency. • In the first Column, place all possible values of variables or observations.
  • 7. CONT., • In the second column draw tally marks vertically against the observations. After a particular value has occurred four times, for the fifth occurrence we put a cross tally marks IIII ( 5 ) • In the third column (Frequency column) count the number of marks corresponding to each value of the variable and place it. • Discrete or Ungrouped Frequency distribution series In this case, the observations or variables are counted that how many times repeated is called the frequency of that class.
  • 8. Example of Discrete Series • Example: A survey was taken on Maple Avenue. In each of 20 homes, people were asked how many cars were registered to their households. The results were recorded as follows: 3,1,4, 0, 2, 1, 5, 2, 1, 5, 4, 2, 3, 2, 0, 2, 1, 0, 3,2. Present this data in Frequency Distribution Table. Ans; Number of Cars Tally marks Frequencies 0 III 3 1 IIII 4 2 IIII I 6 3 III 3 4 II 2 5 II 2 Total 20
  • 9. SUMMARY As we already discussed and learnt today on Classifications and Tabulation as below • Preparation of Frequency Distribution Table Meaning-- Discrete Series Problems -- 01
  • 10. MCQs 1. In an array, the data are: (a) In ascending order (b) In descending order (c) Either (a) or (b) (d) Neither (a) or (b) 2. The number of tally sheet count for each value or a group is called: (a) Class limit (b) Class width (c) Class boundary (d) Frequency
  • 11. MCQs 3. The frequency distribution according to individual variate values is called: (a) Discrete frequency distribution (b) Cumulative frequency distribution (c) Percentage frequency distribution (d) Continuous frequency distribution 4. A series arranged according to each and every item is known as: (a) Discrete series (b) Continuous series (c) Individual series (d) Time series
  • 12. MCQs 5. A frequency distribution can be: (a) Qualitative (b) Discrete (c) Continuous (d) Both (b) and (c) ANSWERS 1. C 2. D 3. A 4. C 5. D
  • 13. REFERENCES • S.P. Gupta, Sultan Chand and Sons Publications, 2017 • S. C. Gupta, Himalaya Publishing House, Fundamentals of Statistics, 2018 • R.S.N Pillai and Bagavathi, S.Chand publications, 2010