
Recommended
More Related Content
Similar to frequency distribution table 2
Similar to frequency distribution table 2 (20)
More from AkkiMaruthi2
More from AkkiMaruthi2 (16)
Recently uploaded
Recently uploaded (20)
frequency distribution table 2
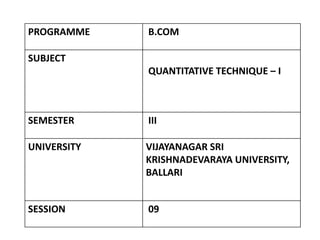
- 1. PROGRAMME B.COM SUBJECT QUANTITATIVE TECHNIQUE – I SEMESTER III UNIVERSITY VIJAYANAGAR SRI KRISHNADEVARAYA UNIVERSITY, BALLARI SESSION 09
- 2. RECAP • Preparation of Frequency Distribution Table Meaning-- Discrete Series Problems -- 01
- 3. LEARNING OBJECTIVES • The aim of the chapter is to make students to present data in textual and Tabular format including the technique of creating frequency distribution and working out bi-variate distribution table
- 4. LEARNING OUTCOMES • After the Chapter, The Students Shall be able to Describe and Understand the Rules & Types of Classification, Frequency Distribution, Class Interval & its Types, Basic Principles Tabulation and The Sorting of Data.
- 5. SESSION - 9 • Preparation of Frequency Distribution Table Discrete Series Problems -- 02
- 6. Discrete Series Problems • 1. In a survey of 35 families in a village, the number of children per family was recorded and the following data was obtained : 1 0 2 3 4 5 6 7 2 3 4 0 2 5 8 4 5 12 6 3 2 7 6 5 3 3 7 8 9 7 9 4 5 4 3
- 7. CONTD NUMBER OF CHILDREN TALLY MARKS FREQUENCY 0 II 2 1 I 1 2 IIII 4 3 IIII I 6 4 IIII 5 5 IIII 5 6 III 3 7 IIII 4 8 II 2 9 II 2 10 -- 0 11 -- 0 12 I 1 TOTAL FREQUENCY 35
- 8. CONTD • 2. Count the number of letters in each word of the para given below (ignoring comma, full-stop, etc.) and prepare a discrete frequency distribution. “TODAY, TO A VERY STRIKING DEGREE, OUR CULTURE HAS BECOME A STATISTICAL CULTURE. EVEN A PERSON WHO MAY NEVER HAVE HEARD OF AN INDEX NUMBER, IS ATTACHED IN AN INTIMATE FASHION BY THE GYRATIONS OF THOSE INDEX NUMBERS WHICH DESCRIBE THE COST OF LIVING.’’
- 9. CONTD NUMBER OF CHILDREN TALLY MARKS FREQUENCY 1 III 3 2 IIII IIII 9 3 IIII I 6 4 IIII 4 5 IIII II 7 6 IIII 5 7 IIII 4 8 IIII 4 9 I 1 10 - 0 11 I 1 TOTAL FREQUENCY 44
- 10. SUMMARY As we already discussed and learnt today on Classifications and Tabulation as below • Preparation of Frequency Distribution Table Discrete Series Problems
- 11. MCQs 1 . The following frequency distribution: X 5 8 7 8 10. F 2 4 9 3 1 . Is classified (a) Relative frequency distribution (b) Continuous distribution (c) Percentage frequency distribution (d) Discrete distribution
- 12. MCQs 2 . Frequency distribution is often constructed with the help of: (a) Entry table (b) Tally sheet (c) Both (a) and (b) (d) Neither (a) and (b) 3 . The data given as 3, 5, 15, 35, 70, 84, 96 will be called as: (a) Individual series (b) Discrete series (c) Continuous series (d) Time series
- 13. MCQs 4 . Frequency of a variable is always in: (a) Fraction form (b) Percentage form (c) Less than form (d) Integer form 5 . Data arranged in ascending or descending order of magnitude is called: (a) Ungrouped data (b) Grouped data (c) Discrete frequency distribution (d) Arrayed data
- 14. CONTD ANSWERS 1. D 2. C 3. A 4. D 5. D
- 15. REFERENCES • S.P. Gupta, Sultan Chand and Sons Publications, 2017 • S. C. Gupta, Himalaya Publishing House, Fundamentals of Statistics, 2018 • R.S.N Pillai and Bagavathi, S.Chand publications, 2010
- 16. THANK YOU