One major problem in the data cleaning & data reduction step of KDD process is the presence of missing values in attributes. Many of analysis task have to deal with missing values and have developed several treatments to guess them. One of the most common method to replace the missing values is the mean method of imputation. In this paper we suggested a new imputation method by combining factor type and compromised imputation method, using two-phase sampling scheme and by using this method we impute the missing values of a target attribute in a data warehouse. Our simulation study shows that the estimator of mean from this method is found more efficient than compare to other.
Some Imputation Methods to Treat Missing Values in Knowledge Discovery in Data warehouse
1. D. Shukla, Rahul Singhai, Narendra Singh Thakur & Naresh Dembla
International Journal of Data Engineering (IJDE) Volume (1): Issue (2) 1
Some Imputation Methods to Treat Missing Values in Knowledge
Discovery in Data warehouse
D. Shukla diwakarshukla@rediffmail.com
Deptt. of Mathematics and Statistics,
Dr. H.S.G. Central University, Sagar (M.P.), India.
Rahul Singhai singhai_rahul@hotmail.com
Iinternational Institute of Professional Studies,
Devi Ahilya Vishwavidyalaya, Indore (M.P.) India.
Narendra Singh Thakur nst_stats@yahoo.co.in
B.T. Institute of Research and Technology,
Sironja, Sagar (M.P.) India.
Naresh Dembla nareshdembla@gmail.com
Iinternational Institute of Professional Studies,
Devi Ahilya Vishwavidyalaya, Indore (M.P.) India.
Abstract
One major problem in the data cleaning & data reduction step of KDD process is
the presence of missing values in attributes. Many of analysis task have to deal
with missing values and have developed several treatments to guess them. One
of the most common method to replace the missing values is the mean method
of imputation. In this paper we suggested a new imputation method by combining
factor type and compromised imputation method, using two-phase sampling
scheme and by using this method we impute the missing values of a target
attribute in a data warehouse. Our simulation study shows that the estimator of
mean from this method is found more efficient than compare to other.
Keywords: KDD (Knowledge Discovery in Databases), Data mining, Attribute, Missing values, Imputation
methods, Sampling.
1. INTRODUCTION
“Data mining”, often also referred to as “Knowledge Discovery in Databases” (KDD), is a young
sub-discipline of computer science aiming at the automatic interpretation of large datasets. The
classic definition of knowledge discovery by Fayyad et al.(1996) describes KDD as “the non-trivial
process of identifying valid, novel, potentially useful, and ultimately understandable patterns in
data” (Fayyad et al. 1996). Additionally, they define data mining as “a step in the KDD process
consisting of applying data analysis and discovery algorithms. In order to be able to “identify valid,
novel patterns in data”, a step of pre-processing of the data is almost always required. This
preprocessing has a significant impact on the runtime and on the results of the subsequent data
mining algorithm.
The knowledge discovery in database is more than pure pattern recognition, Data miners do not
simply analyze data, and they have to bring the data in a format and state that allows for this
2. D. Shukla, Rahul Singhai, Narendra Singh Thakur & Naresh Dembla
International Journal of Data Engineering (IJDE) Volume (1): Issue (2) 2
analysis. It has been estimated that the actual mining of data only makes up 10% of the time
required for the complete knowledge discovery process (Pyle 1999). In our opinion, the precedent
time-consuming step of preprocessing is of essential importance for data mining (Han and
Kamber 2001). It is more than a tedious necessity: The techniques used in the preprocessing
step can deeply influence the results of the following step, the actual application of a data mining
algorithm (Hans et al.(2007). We therefore feel that the role of the impact on and the link of data
preprocessing to data mining will gain steadily more interest over the coming years.
Thus Data pre-processing is one of the essential issue of KDD process in Data mining. Since
data warehouse is a large database that contains data that is collected and integrated from
multiple heterogeneous data sources. This may lead to irrelevant, noisy inconsistent, missing and
vague data. So it is required to apply different data pre-processing techniques to improve the
quality of patterns mined by data mining techniques. The data mining pre-processing methods
are organised into four categories: Data cleaning, data integration and transportation, data
reduction, descritization and concept hierarchy generation.
Since the goal of knowledge discovery can be vaguely characterized as locating interesting
regularities from large databases (Fayyad et al. &. Krishnamurthy R. et al.) For large collections
of data, sampling is a promising method for knowledge discovery: instead of doing complicated
discovery processes on all the data, one first takes a small sample, finds the regularities in it, and
then possibly validates these on the whole data
Sampling is a powerful data reduction technique that has been applied to a variety of problems in
database systems. Kivinen and Mannila (1994) discuss the general applicability of sampling to
data mining, and Zaki, et al.(1996) employ a simple random sample to identify association rules.
Toivonen (1996) uses sampling to generate candidate itemsets but still requires a full database
scan. John and Langley (1996) give a dynamic sampling method that selects the sample size
based on the observed behavior of the data-mining algorithm. Traditionally, random sampling is
the most widely utilized sampling strategy for data mining applications. According to the Chernoff
bounds, the consistency between the population proportion and the sample proportion of a
measured pattern can be probabilistically guaranteed when the sample size is large (Domingo et
al.(2002) and Zaki et al.(1997)). Kun-Ta Chuang et al.(2007) proposed a novel sampling
algorithm (PAS) to generate a high quality online sample with the desired sample rate.
Presence of missing data is one of the critical problem in data cleaning and data reduction
approach. While using sampling techniques to obtain reduced representation of large database, it
often possible that the sample may contains some missing values.Missing data are a part of most
of the research, and missing data can seriously affect research results (Robert 1996). So, it has
to be decided how to deal with it. If one ignores missing data or assumes that excluding missing
data is acceptable, there is a risk of reaching invalid and non-representative conclusions. There
are a number of alternative ways of dealing with missing data (Joop 1999). There are many
methods of imputation (Litte and Rubin 1987) like Mean Imputation,regression imputation,
Expectation maximization etc. Imputation of missing data minimizes bias and allows for analysis
using a reduced dataset. In general the imputation methods can be classified into single &
multiple imputations. The single imputation method always imputes the same value, thereby
ignoring the variance associated with the imputation process. The multiple imputations method
imputes several imputed values and the effect of the chosen imputed values on the variance can
be taken into account.
Both the single-imputation and MI methods can be divided into three categories: 1) data driven; 2)
model based; and 3) ML based (Laxminarayan et al.(1999), Little and Rubin(1987), Oh (1983)).
Data-driven methods use only the complete data to compute imputed values. Model-based
methods use some data models to compute imputed values. They assume that the data are
generated by a model governed by unknown parameters. Finally, ML-based methods use the
entire available data and consider some ML algorithm to perform imputation. The data-driven
methods include simple imputation procedures such as mean, conditional mean, hot-deck, cold-
deck, and substitution imputation (Laxminarayan et al. (1999), Sarle(1998)). Several model-based
imputation algorithms are described by Little and Rubin (1987). The leading methods include
regression-based, likelihood-based, and linear discriminant analysis (LDA)-based imputation. In
regression-based methods, missing values for a given record are imputed by a regression model
based on complete values of attributes for that record. The likelihood-based methods can be
3. D. Shukla, Rahul Singhai, Narendra Singh Thakur & Naresh Dembla
International Journal of Data Engineering (IJDE) Volume (1): Issue (2) 3
considered to impute values only for discrete attributes. They assume that the data are described
by a parameterized model, where parameters are estimated by maximum likelihood or maximum
a posteriori procedures, which use different variants of the EM algorithm (Cios(1998), Little and
Rubin(1987)). A probabilistic imputation method that uses probability density estimates and
Bayesian approach was applied as a preprocessing step for an independent module analysis
system (Chan K et al.(2003)). Neural networks were used to implement missing data imputation
methods (Freund and Schapire (1996), Tresp (1995)). An association rule algorithm, which
belongs to the category of algorithms encountered in data mining, was used to perform MIs of
discrete data (Zhang (2000)). Recently, algorithms of supervised ML were used to implement
imputation. In this case, imputation is performed one attribute at a time, where the selected
attribute is used as a class attribute. Several different families of supervised ML algorithms, such
as decision trees, probabilistic, and decision rules (Cios et al.(1998)) can be used; however, the
underlying methodology remains the same. For example, a decision tree C4.5
(Quinlan(1992),(1986), and a probabilistic algorithm A decision rule algorithm CLIP4 (Cios(1998))
and a probabilistic algorithm Naïve Bayes were studied in (Farhangfar et al.(2004). A k-nearest
neighbor algorithm was used by Batista and Monard(2003). Backpropagation Neural Network
(BPNN) is one of the most popular neural network learning algorithms. Werbos (1974) proposed
the learning algorithm of the hidden layers and applied to the prediction in the economy.
Classification is another important technique in data mining. A decision tree approach to
classification problems were described by Friedman 1997. Let ....,, zyxA is a finite attribute
set of any database, where target attribute domain Y consist of NiYi
,........2,1; values of main
interest and attribute domain X consist of NiXi
,........2,1; auxiliary values, that is highly
associated with attribute domain Y. Suppose target attribute Domain Y has some missing values.
Let y be the mean of finite attribute set Y under consideration for estimation
N
i
iYNY
1
1
and
X be the mean of reference attribute set X. When X is unknown, the two-phase sampling is
used to estimate the main data set missing values (Shukla, 2002).
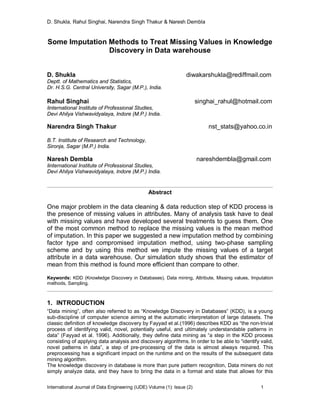
2. PROPOSED IMPUTATION TECHNIQUES FOR MISSING ATTRIBUTE
VALUES
Consider preliminary large sample ''
,.....,3,2,1; niXS i
of size n’ drawn from attribute data set
A by SRSWOR and a secondary sample of size n '
nn drawn in the following manner ( fig. 1).
Attribute set A = {x,y,z}, of
having N tupples
Sample (s) having n’
tupples
R Rc
Sample (s) having n (n<n’
) tupple
'
'
nsizeX
NsizeXY ,
nsizeX
Data warehouse
4. D. Shukla, Rahul Singhai, Narendra Singh Thakur & Naresh Dembla
International Journal of Data Engineering (IJDE) Volume (1): Issue (2) 4
FIGURE 1.
The sample S of n units contains r available values (r < n) forming a subspace R and (n – r)
missing values with subspace C
R in C
RRS . For every Ri , the i
y ’s are available values of
attribute Y and for C
Ri , the i
y values are missing and imputed values are to be derived, to
replace these missing values.
2.1.0 F-T-C Imputation Strategies:
For 3,2,1jyji
C
j
ji
ji
Riifkk
Riifkky
r
kn
y
1
)()1(
'
'
…(2.1)
where,
xCxfBA
xfBxCA
yk r '
'
'
1
)(
)(
)( ;
r
r
r
xCxfBA
xfBxCA
yk
)(
)(
)('
2 ;
r
r
r
xCxfBA
xfBxCA
yk '
'
'
3
)(
)(
)( ; ;21 kkA ;41 kkB
k0;432 kkkC
2.1.1 Properties of kj :
(i) At k = 1; A = 0; B = 0; C = - 6
x
x
yr
'
'
1 1 ;
r
r
x
x
y1'
2 ;
r
r
x
x
y
'
'
3 1
(ii) At k = 2; A = 0; B = -2; C = 0
'
'
3 2
x
x
yr ;
x
x
y
r
r2'
2 ; '
'
3 2
x
x
y
r
r
(iii) At k = 3; A = 2; B = - 2; C = 0
'
'
'
3
'
2'
'
'
1
1
3;
1
3;
1
3
xf
xfx
y
xf
xfx
y
xf
xfx
y
r
r
r
rr
(iv) At k = 4; A = 6; B = 0; C = 0
ry 444 '
3
'
2
'
1
Theorem 2.1: The point estimate for S of Y are:
3,2,1);()1()( ''
jkkyky jrjFTC …(2.2)
Proof:
Si
jijsjFTC y
n
yy )(
1'
c
Ri
ji
Ri
ji yy
n
)()(
1
)()1()()1(
1 ''
kkkky
r
kn
n Ri Ri
jji
c
5. D. Shukla, Rahul Singhai, Narendra Singh Thakur & Naresh Dembla
International Journal of Data Engineering (IJDE) Volume (1): Issue (2) 5
3,2,1;)()1( ''
jkkyky jrjFTC
2.2.0 Some Special Cases:
1kAt , 3,2,1
'
jyy rjFTC …(2.3)
2kAt ,
'
1
'
2
x
x
yy rFTC …(2.4)
x
x
yy
r
rFTC 2
2
'
…(2.5)
'
3
'
2
x
x
yy
r
rFTC …(2.6)
3kAt ,
'
'
1
'
)1(
)(2
3
xf
xfx
yy rFTC …(2.7)
xf
xfx
yy
r
rFTC
)1(
)(2
32
'
…(2.8)
'
'
3
'
)1(
)(2
3
xf
xfx
yy
r
rFTC …(2.9)
4kAt , 3,2,1
'
jyy rjFTC …(2.10)
3. BIAS AND MEAN SQUARED ERROR
Let B(.) and M(.) denote the bias and mean squared error (M.S.E.) of an estimator under a given
sampling design. The large sample approximations are
)1();1(),1(;)1( '
3
'
311 eXxeXxeXxeYy rr …(3.1)
Using the concept of two phase sampling following Rao and Sitter (1995) and the mechanism of
MCAR for given r, n and n’. we have
2
3
'
33
2
3
'
32
2
232
3
'
31231121
2
3
2'
3
2
2
2
3
2
1
2
2
2
1
2
1
'
3321
)(;)(;)(
;)(;)(;)(
;)(;)(;)(;)(
0)()()()(
XXX
YXXYXY
XXXY
CeeECeeECeeE
CCeeECCeeECCeeE
CeECeECeECeE
eEeEeEeE
…(3.2)
where
'1
11
nr
;
'2
11
nn
;
Nn
11
'3
Theorem 3.1: Estimator 3,2,1;
'
jy jFTC ii
eie '
and3,2,1,oftermsin could be expressed as:
(i) })({)1(1
2'
33
2
34
'
3343
'
3131
'
3311
'
eeeeeeeeeePkeYy FTC …(3.3)
(ii) })({)1(1 2
33
2
24324331213212
'
eeeeeeeeeePkeYy FTC …(3.4)
(iii) })({)1(1
2'
33
2
24
'
3243
'
3121
'
3213
'
eeeeeeeeeePkeYy FTC …(3.5)
9. D. Shukla, Rahul Singhai, Narendra Singh Thakur & Naresh Dembla
International Journal of Data Engineering (IJDE) Volume (1): Issue (2) 9
22
211
min
2'
)( YFTC SyM
(iii)
0
)1( 3
'
FTCyM
Pkd
d
From equation (3.11)
X
Y
C
C
Pk )1( ...(3.16)
Therefore 22
311min3
'
)( YFTC SYM
3.1 Multiple Choices of k :
The optimality condition VP provides the equation
kVffkVffkVfk 235108154 234
0224244 Vff …(3.17)
which fourth degree polynomial in terms of k. One can get at most four values of k like k1, k2, k3,
k4 for which m. s. e. is optimal. The best choice criteria is
Step I: Compute jkFTiTB for i = 1, 2, 3; j = 1, 2, 3, 4.
Step II: For given i, choose kj as jkFTiTB = 4,3,2,1
min
j
jkFTiTB
This ultimately gives bias control at the optimal level of m.s.e.
Note 3.1: For given pair of values of (V, f), 10;0 fV , one can generate a trivariate
table of 4321 ,,, kkkk so as to achieve solution quickly.
Remark 3.2: Reddy (1978) has shown that quantity
X
Y
C
C
V is stable over moderate length
time period and could be priorly known or guessed by past data. Therefore, pair (f, V) be treated
as known and equation (3.13) generates maximum of four roots (some may imaginary) on which
optimum level of m.s.e. will be attained.
4. COMPARISON
(i) Let min2
'
min1
'
1 )( FTCFTC yMyMD 22
311 ]2[ Y
Thus 1
'
2
'
thanbetteris FTCFTC yy if:
0]2[0 22
3211 YeD 02 321 …(4.1)
(ii) Let min3
'
min1
'
2 FTCFTC yMyMD 22
3132 ][ Y
22
21 )( Y
ifthanbetterThus 1
'
3
'
FTCFTC yy
02)(0 2
212 YD rn
nrnr
11
0
11
…(4.2)
i.e. the size of sample domain is greater than the size of auxiliary data.
10. D. Shukla, Rahul Singhai, Narendra Singh Thakur & Naresh Dembla
International Journal of Data Engineering (IJDE) Volume (1): Issue (2) 10
(iii) min3
'
min2
'
3 FTCFTC yMyMD 22
32 ])[( Y 22
32 )( Y
Thus 3
'
FTCy is better than 2
'
FTCy if
0)(0 323 D
Nnnn
1111
''31 If Nn '
Then nN
NnNn
11
0
11
…(4.3)
i.e. the size of total data set is greater than the size of sample data set.
5. EMPIRICAL STUDY
The attached appendix A has generated artificial population of size N = 200 containing values of
main variable Y and auxiliary variable X. Parameter of this are given below:
Y = 42.485; X = 18.515;
2
YS = 199.0598;
2
XS = 48.5375; = 0.8652; XC = 0.3763; YC = 0.3321.
Using random sample SRSWOR of size n = 50; r = 45; f = 0.25, = 0.2365. Solving optimum
condition V [see (3.13)] the equation of power four in k provides only two real values 1
k =
0.8350; 2k =4.1043. Rest other two roots appear imaginary.
6. SIMULATION
The bias and optimum m.s.e. of proposed estimators under both designs are computed through
50,000 repeated samples n, '
n as per design. Computations are in table 6.1.
The simulation procedure has following steps :
Step 1: Draw a random sample '
S of size 110'
n from the population of N = 200 by SRSWOR.
Step 2: Draw a random sub-sample of size 50n from
'
S .
Step 3: Drop down 5 units randomly from each second sample corresponding to Y.
Step 4: Impute dropped units of Y by proposed methods and available methods and compute the
relevant statistic.
Step 5: Repeat the above steps 50,000 times, which provides multiple sample based estimates
,ˆ,ˆ 21 yy 500003
ˆ,....,ˆ yy .
Step 6: Bias of yˆ is
50000
1
ˆ
50000
1
ˆ
i
i YyyB
Step 7: M.S.E. of yˆ is
250000
1
ˆ
50000
1
ˆ
i
i YyyM
Table 6.1 : Comparisons of Estimators
Estimator Bias (.) M(.)
11 kFTCIy
0.3313 13.5300
21 kFTCIy
0.0489 3.4729
31 kFTCIy
--- ---
12 kFTCIy
0.2686 4.6934
11. D. Shukla, Rahul Singhai, Narendra Singh Thakur & Naresh Dembla
International Journal of Data Engineering (IJDE) Volume (1): Issue (2) 11
22 kFTCIy
0.0431 3.2194
32 kFTCIy
--- ---
13 kFTCIy
0.5705 14.6633
23 kFTCIy
0.0639 3.5274
33 kFTCIy
--- ---
TABLE 1: Bias and Optimum m.s.e. at )2,1( ikk i
7. CONCLUDING REMARKS
The content of this paper has a comparative approach for the three estimators examined under
two-phase sampling. The estimator 22 kFTCIy is best in terms of mean squared error than other
estimators. We can also choose an appropriate value of k for minimum bias from available values
of k. Equation (4.1), (4.2) and (4.3) shows the general conditions for showing better performance
of any estimator. All suggested methods of imputation are capable enough to obtain the values of
missing observations in data warehouse. These methods are useful in the case where two
attributes are in quantitative manner and linearly correlate with each other, like, Statistical
Database, agricultural database (yield and area under cultivation), banking database (saving and
interest),Spatial Databases etc. Therefore, suggested strategies are found very effective in order
to replace missing values during the data preprocessing in KDD, so that the quality of the results
or patterns mined by data mining methods can be improved.
8. REFERENCES
[1]. U Fayyad, Piatetsky-Shapiro, P.Smyth. ”Knowledge discovery and data mining: Towards a
unifying framework”,In Proceedings of the 2nd ACM international conference on knowledge
discovery and data mining (KDD), Portland, OR, pp 82–88.1996.
[2]. Piatetsky, Shapiro and J.William, Frawley. “Knowledge discovery in databases”,AAAI
Press/MIT Press,1991.
[3]. R.Krishnamurthy, and T.Imielinski. “Research directions in Knowledge Discovery”,
SIGMOD Record,20(3):76-78,1991.
[4]. D.Pyle. “Data preparation for data mining”, Morgan Kaufmann Publishers Inc, (1999).
[5]. J. Han, M. Kamber. “Data mining: concepts and techniques”, Academic Press, San Diego,
(2001).
[6]. H. P. Kriegel, Karsten, M. Borgwardt, P. Kröge, A. Pryakhin, M. Schubert, A. Zimek,
“Future trends in data mining”, Data Min Knowl Disc 15:87–97 DOI 10.1007/s10618-007-
0067-9,2007.
[7]. J. Kivinen and H.Mannila. “The power of sampling in knowledge discovery”, In Proc.
Thirteenth ACM SIGACT-SIGMOD-SIGART Symp. Principles of Database Sys., pages 77–
85. ACM Press,1994.
12. D. Shukla, Rahul Singhai, Narendra Singh Thakur & Naresh Dembla
International Journal of Data Engineering (IJDE) Volume (1): Issue (2) 12
[8]. M. J. Zaki, S. Parthasarathy, W. Lin, and M. Ogihara. “Evaluation of sampling for data
mining of association rules”, Technical Report 617, University of Rochester, Rochester,
NY,1996.
[9]. H. Toivonen. “Sampling large databases for association rules”, In Proc. 22nd VLDB 1996.
[10]. G. H. John and P. Langley. “Static versus dynamic sampling for data mining”, In Proc.
Second Intl. Conf. Knowledge Discovery and Data Mining, pages 367–370. AAAI
Press,1996.
[11]. C. Domingo, R. Gavalda and Q. Watanabe. “Adaptive Sampling Methods for Scaling Up
Knowledge Discovery Algorithms”, Data Mining and Knowledge Discovery,2002.
[12]. M. Zaki, S. Parthasarathy, W. Li and M. Ogihara. “Evaluation of Sampling for Data Mining
of Association Rules”, Proc. Int’l Workshop Research Issues in Data Eng,1997.
[13]. K.T. Chuang, K. P. Lin, and M. S. Chen. “Quality-Aware Sampling and Its Applications in
Incremental Data Mining”, IEEE Transactions on knowledge and data engineering,vol.19,
no. 4,2007.
[14]. K.Lakshminarayan, S. A. Harp and Samad. “Imputation of missing data in industrial
databases, Appl. Intell., vol. 11, no. 3, pp. 259–275, Nov./Dec1999.
[15]. R. J. Little and D. B. Rubin. “Statistical Analysis With Missing Data”, Hoboken, NJ: Wiley,
(1987).
[16]. H. L. Oh, and F. L. Scheuren. “Weighting adjustments for unit nonresponse, incomplete
data in sample survey”, in Theory and Bibliographies, vol. 2, W. G. Madow, I. Olkin, and D.
B. Rubin, Eds. New York: Academic, pp. 143–183,1983.
[17]. W. S. Sarle. “Prediction with missing inputs”, in Proc. 4th JCIS, vol. 2, pp. 399–402,1998.
[18]. K. J. Cios, W. Pedrycz, ,and R. Swiniarski. “Data Mining Methods for Knowledge
Discovery”,Norwell, MA: Kluwer,(1998).
[19]. K. Chan, T. W. Lee, and T. J. Sejnowski. “Variational Bayesian learning of ICA with
missing data, Neural Comput”, vol. 15, no. 8, pp. 1991–2011,2003.
[20]. Y. Freund and R. E. Schapire. “Experiments with a new boosting algorithm”, in Proc. 13th
Int. Conf. Mach. Learn., pp. 146–148,1996.
[21]. V. Tresp, R. Neuneier, and S. Ahmad. “Efficient methods for dealing with missing data in
supervised learning”, in Advances in Neural Information Processing Systems 7, G.
Cambridge, MA: MIT Press, pp. 689–696,1995.
[22]. W. Zhang. “Association based multiple imputation in multivariate datasets”, A summary, in
Proc. 16th ICDE, pp. 310–311,2000.
[23]. J. R. Quinlan. ”C4.5: Programs for Machine Learning”, San Mateo, CA: Morgan
Kaufmann,1992.
[24]. J. R. Quinlan. “Induction of decision trees, Mach. Learn”, vol. 1, no. 1, pp. 81–106, 1986.
[25]. A. Farhangfar, L. A. Kurgan, and W. Pedrycz. “Novel framework for imputation of missing
values in databases”, Comput.: Theory and Appl. II Conf., Conjunction with SPIE Defense
and Security Symp. (formerly AeroSense), Orlando, FL, pp. 172–182,2004.
[26]. G. Batista and M. Monard. “An analysis of four missing data treatment methods for
supervised learning”, Appl. Artif. Intell., vol. 17, no. 5/6, pp. 519–533,2003
[27]. W. G. Cochran. “Sampling Techniques”, John Wiley and Sons, New York, (2005).
[28]. D. F. Heitjan and S. Basu. “Distinguishing ‘Missing at random’ and ‘missing completely at
random”, The American Statistician, 50, 207-213,1996.
13. D. Shukla, Rahul Singhai, Narendra Singh Thakur & Naresh Dembla
International Journal of Data Engineering (IJDE) Volume (1): Issue (2) 13
[29]. V. N. Reddy. “A study on the use of prior knowledge on certain population parameters in
estimation”, Sankhya, C, 40, 29-37,1978.
[30]. D. Shukla. “F-T estimator under two-phase sampling”, Metron, 59, 1-2, 253-263,2002.
[31]. S. Singh, and S. Horn. “Compromised imputation in survey sampling”, Metrika, 51, 266-
276,2000.
[32]. Li.Liu, Y. Tu, Y. Li, and G. Zou. “Imputation for missing data and variance estimation when
auxiliary information is incomplete”, Model Assisted Statistics and Applications, 83-94,2005.
[33]. S.Singh. “A new method of imputation in survey sampling”, Statistics, Vol. 43, 5 , 499 –
511,2009.
Appendix A (Artificial Dataset (N = 200) )
Yi 45 50 39 60 42 38 28 42 38 35
Xi 15 20 23 35 18 12 8 15 17 13
Yi 40 55 45 36 40 58 56 62 58 46
Xi 29 35 20 14 18 25 28 21 19 18
Yi 36 43 68 70 50 56 45 32 30 38
Xi 15 20 38 42 23 25 18 11 09 17
Yi 35 41 45 65 30 28 32 38 61 58
Xi 13 15 18 25 09 08 11 13 23 21
Yi 65 62 68 85 40 32 60 57 47 55
Xi 27 25 30 45 15 12 22 19 17 21
Yi 67 70 60 40 35 30 25 38 23 55
Xi 25 30 27 21 15 17 09 15 11 21
Yi 50 69 53 55 71 74 55 39 43 45
Xi 15 23 29 30 33 31 17 14 17 19
Yi 61 72 65 39 43 57 37 71 71 70
Xi 25 31 30 19 21 23 15 30 32 29
Yi 73 63 67 47 53 51 54 57 59 39
Xi 28 23 23 17 19 17 18 21 23 20
Yi 23 25 35 30 38 60 60 40 47 30
Xi 07 09 15 11 13 25 27 15 17 11
Yi 57 54 60 51 26 32 30 45 55 54
Xi 31 23 25 17 09 11 13 19 25 27
Yi 33 33 20 25 28 40 33 38 41 33
Xi 13 11 07 09 13 15 13 17 15 13
Yi 30 35 20 18 20 27 23 42 37 45
Xi 11 15 08 07 09 13 12 25 21 22
Yi 37 37 37 34 41 35 39 45 24 27
Xi 15 16 17 13 20 15 21 25 11 13
Yi 23 20 26 26 40 56 41 47 43 33
Xi 09 08 11 12 15 25 15 25 21 15
Yi 37 27 21 23 24 21 39 33 25 35
Xi 17 13 11 11 09 08 15 17 11 19
Yi 45 40 31 20 40 50 45 35 30 35
Xi 21 23 15 11 20 25 23 17 16 18
Yi 32 27 30 33 31 47 43 35 30 40
Xi 15 13 14 17 15 25 23 17 16 19
Yi 35 35 46 39 35 30 31 53 63 41
Xi 19 19 23 15 17 13 19 25 35 21
Yi 52 43 39 37 20 23 35 39 45 37
Xi 25 19 18 17 11 09 15 17 19 19