Download as PDF, PPTX

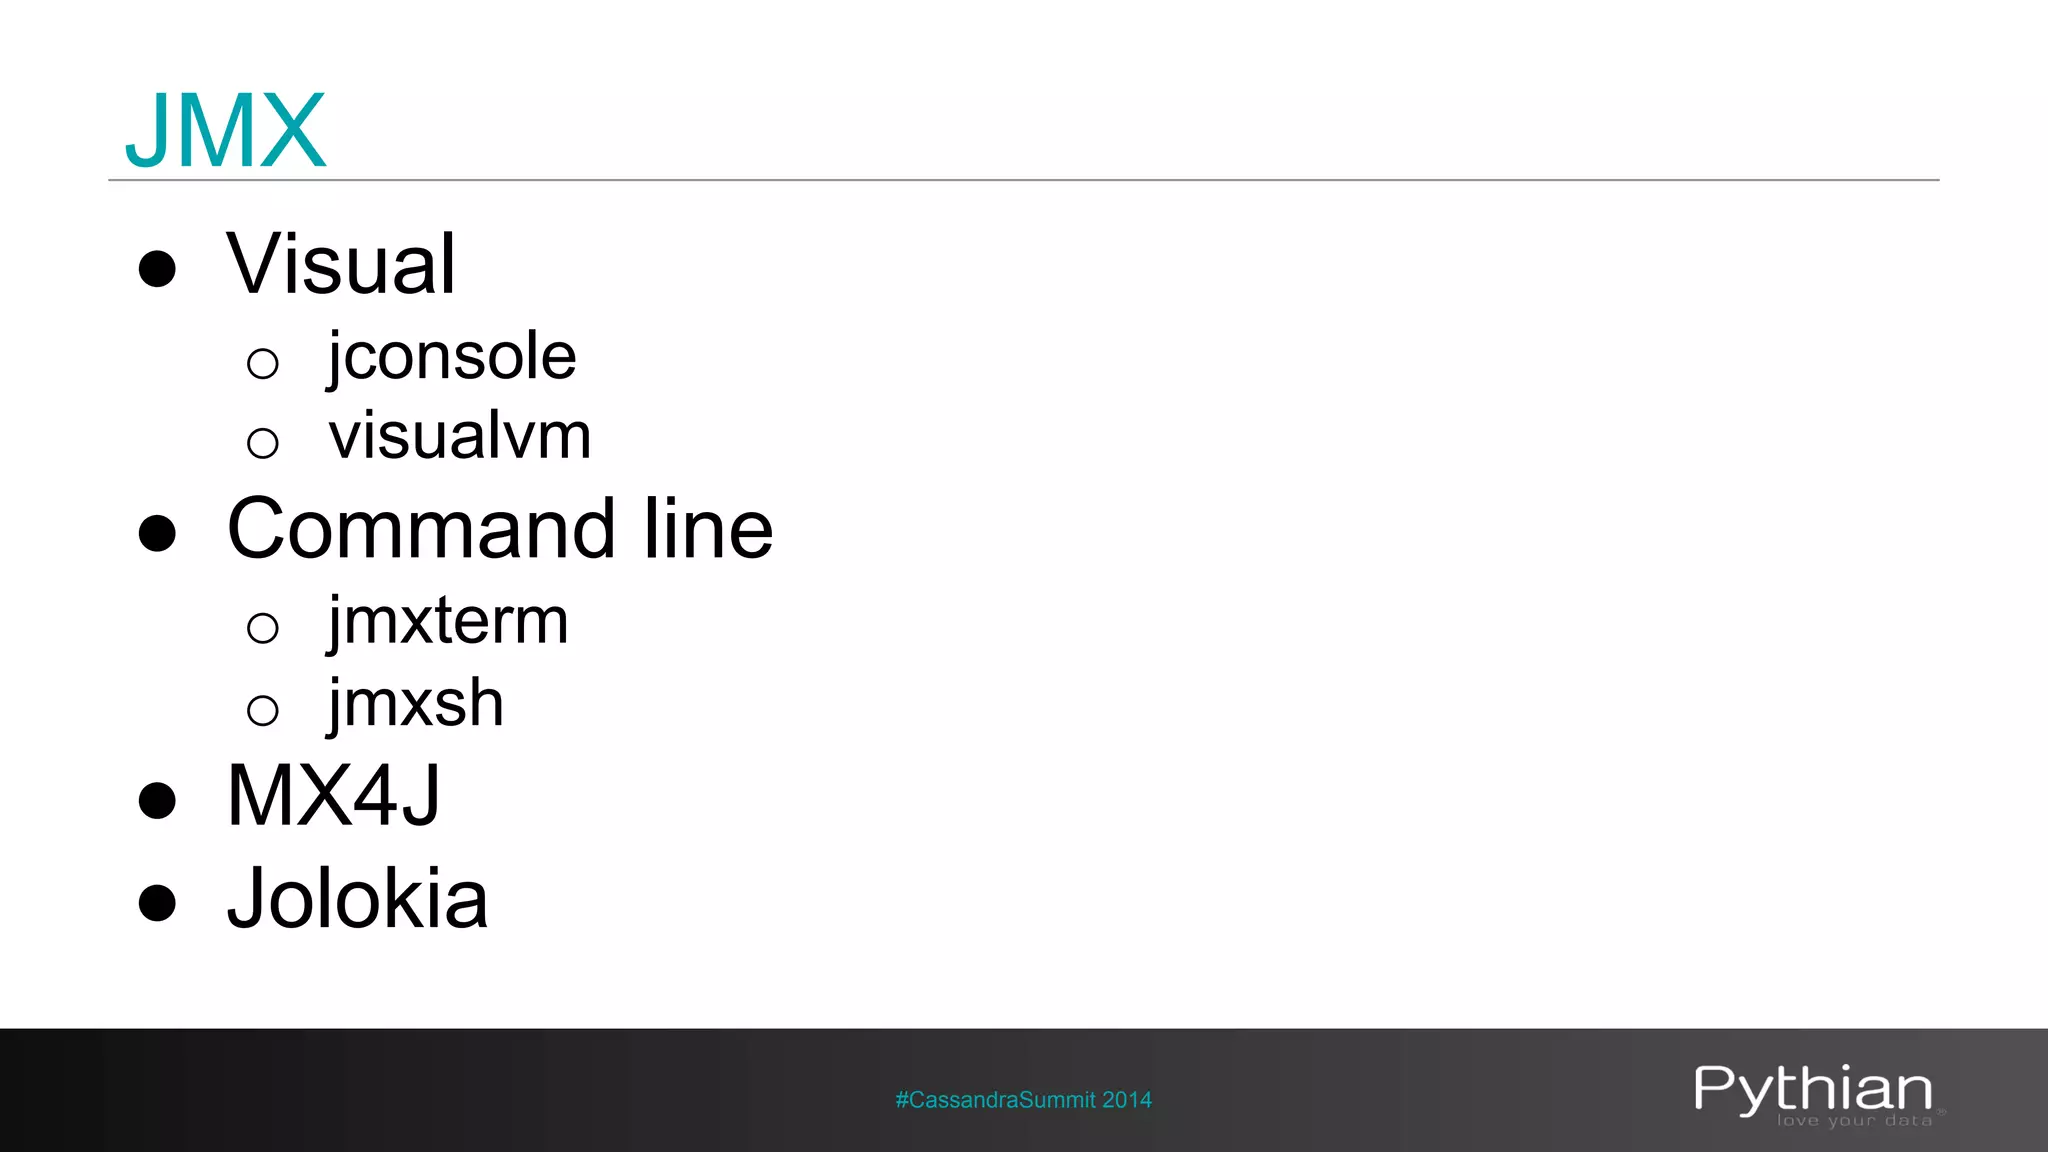
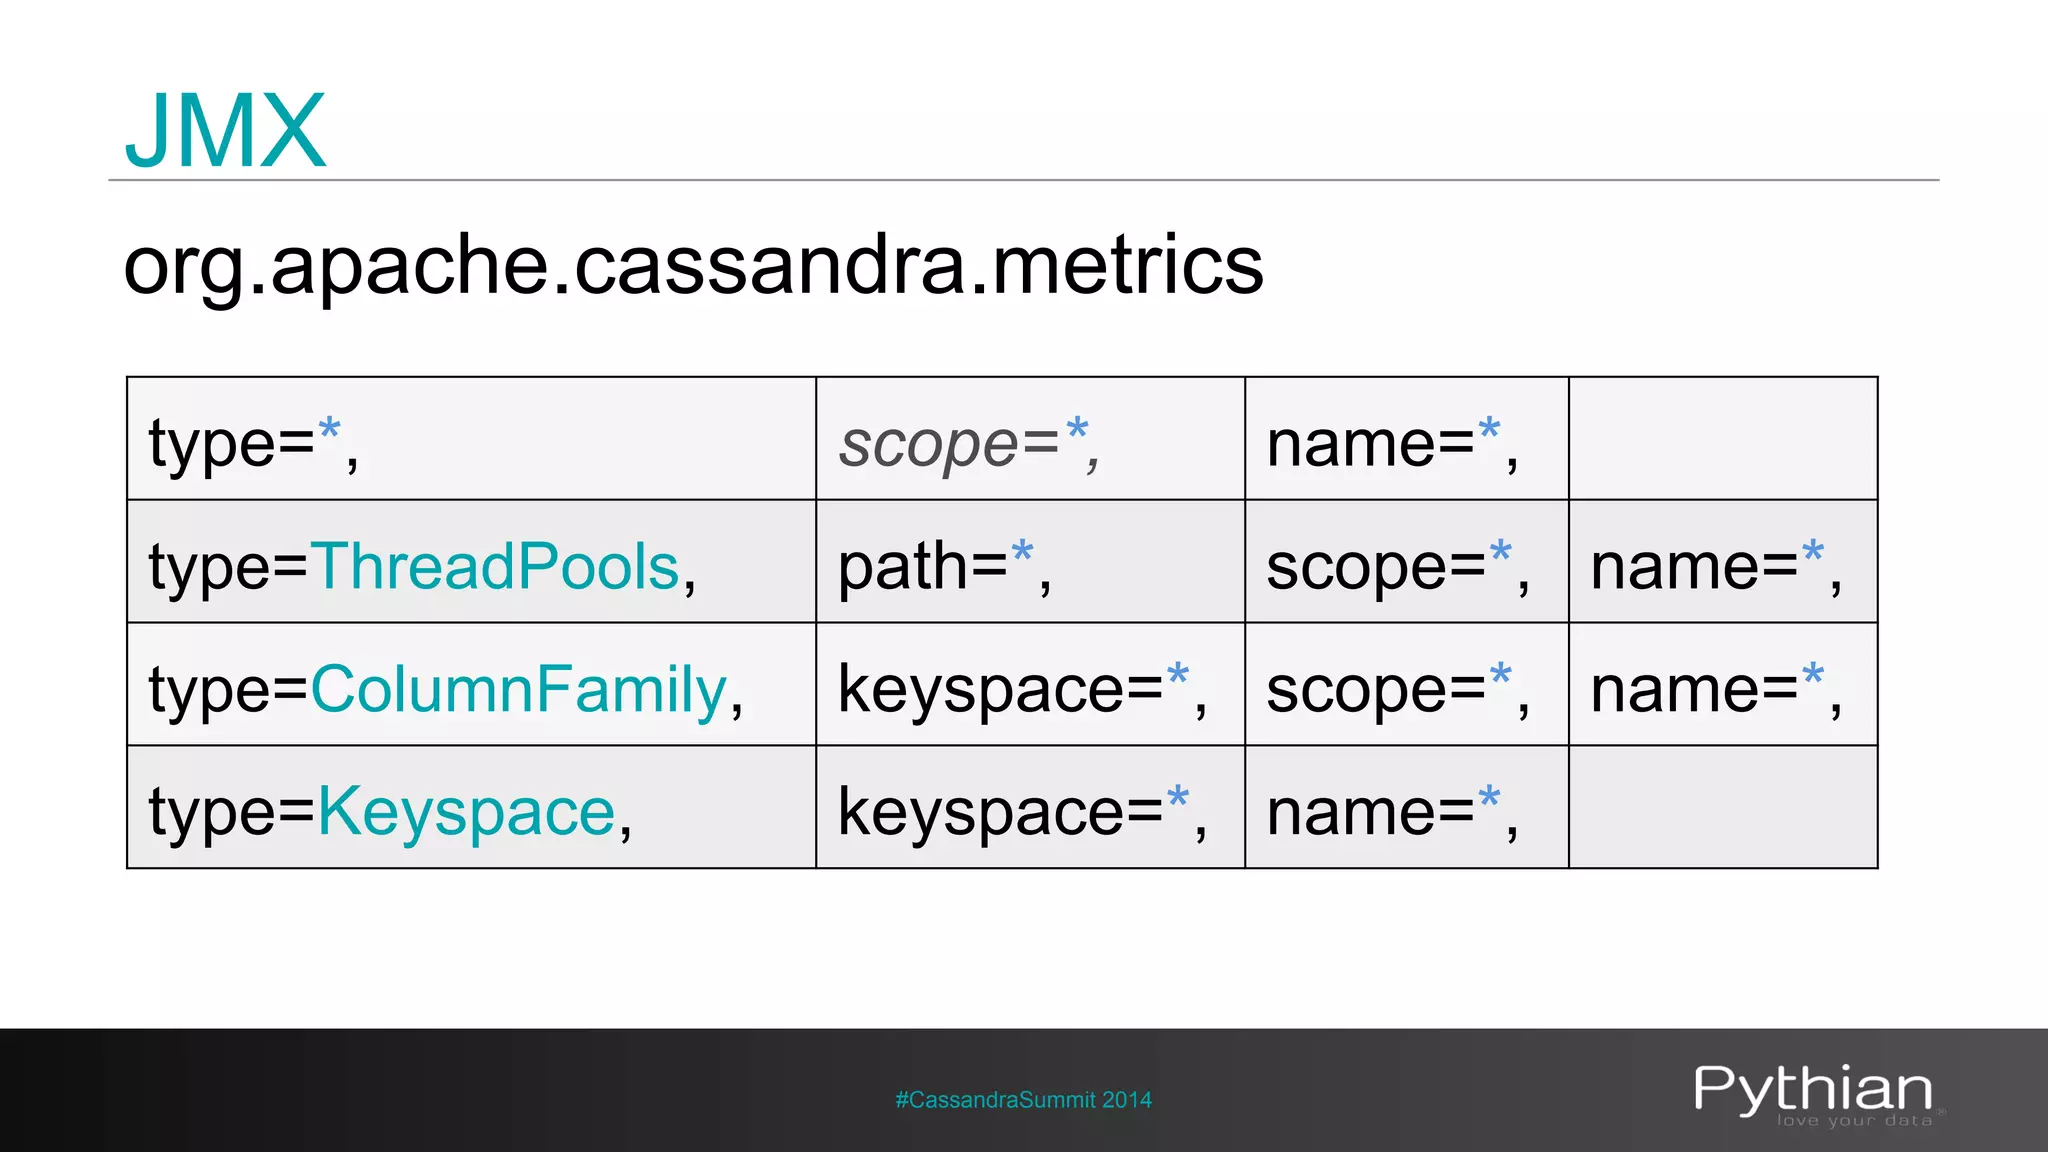
![JMX
[domain]:[key]=[value],[key2]=[value2]...
#CassandraSummit 2014](https://image.slidesharecdn.com/chrislohfinkblackbirdio-140929192436-phpapp02/75/Cassandra-Summit-2014-Monitor-Everything-15-2048.jpg)
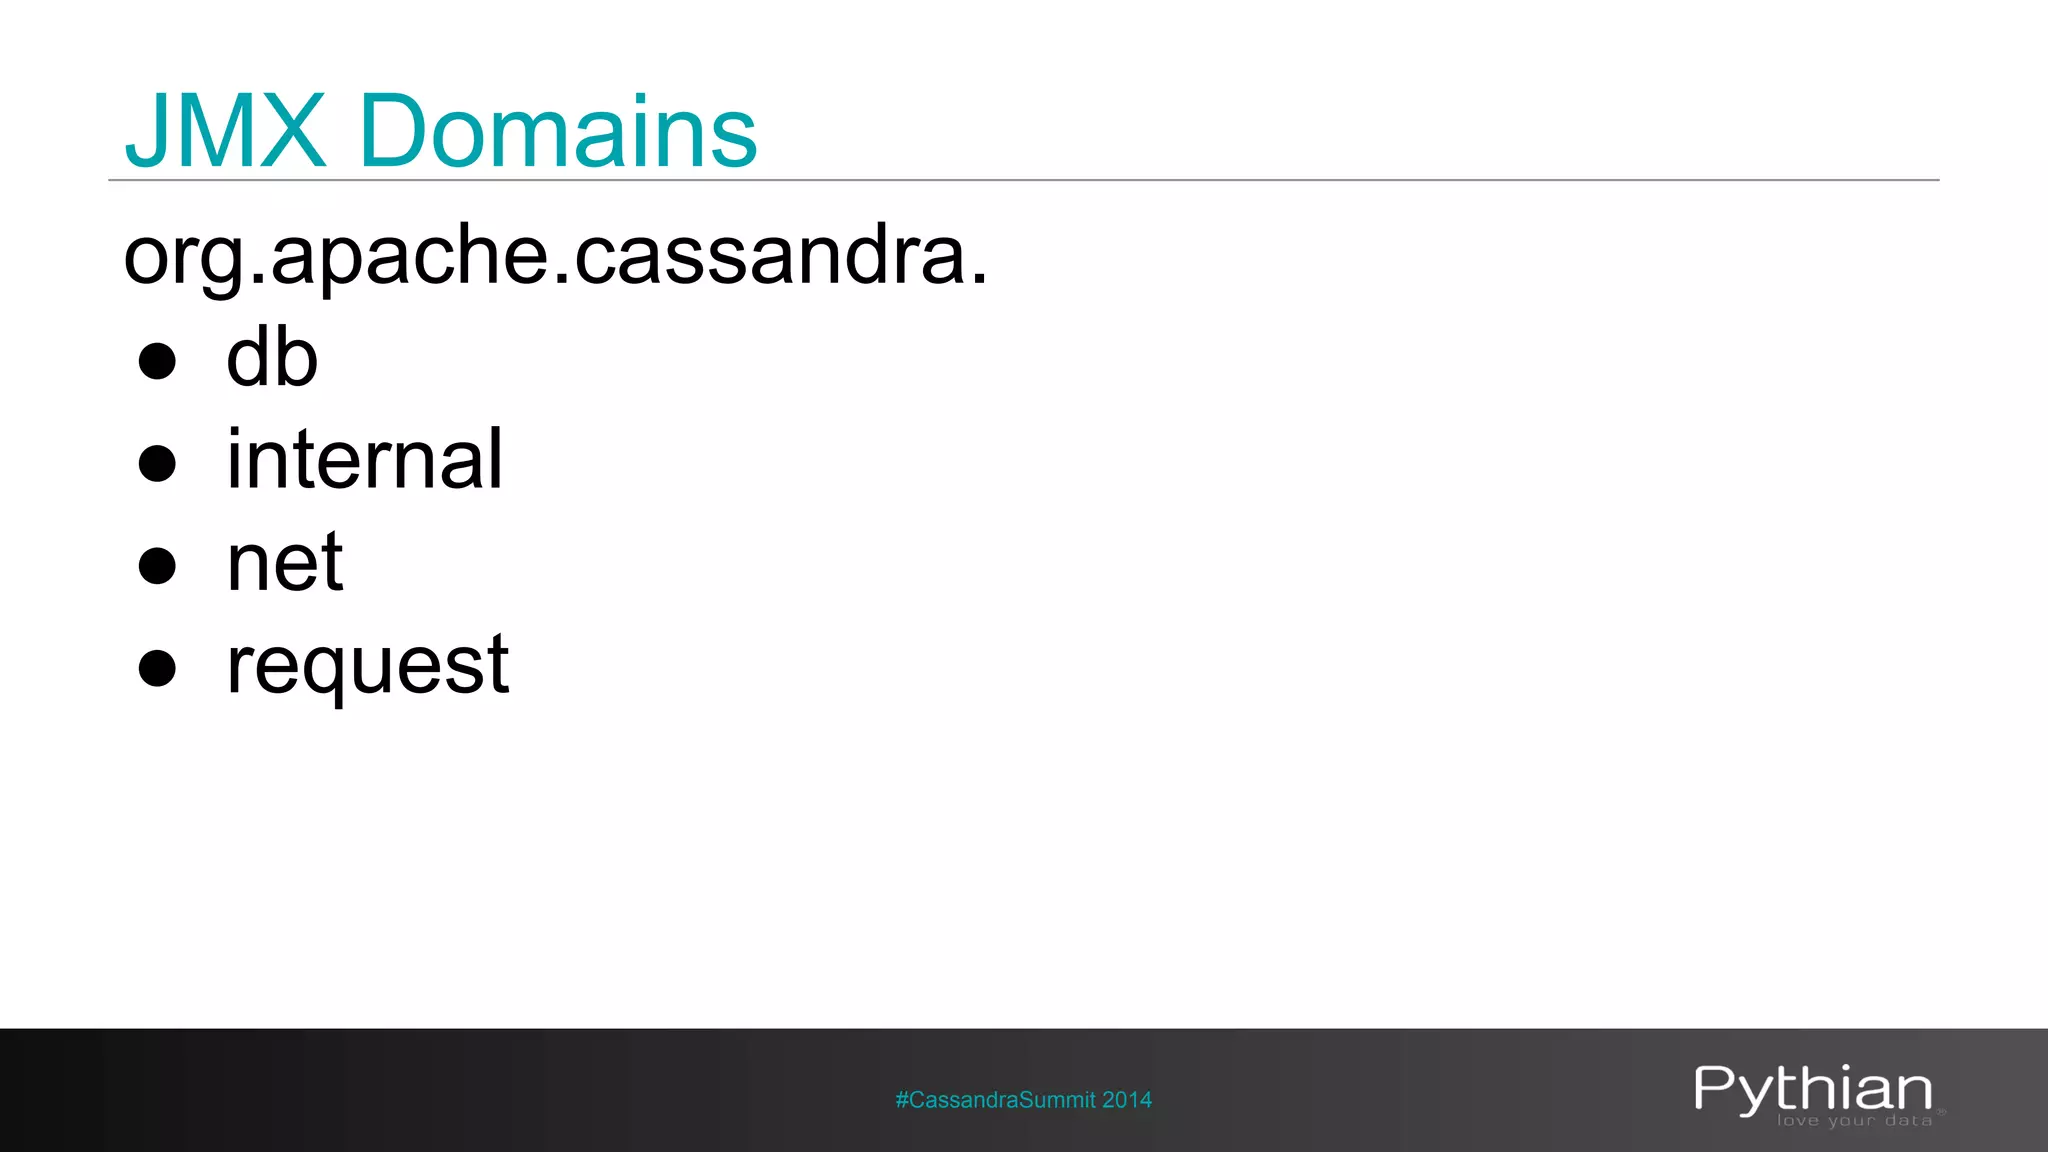
![JMX
[domain]:[key]=[value],[key2]=[value2]...
com.pythian:site=blog,type=views,target=post1
#CassandraSummit 2014](https://image.slidesharecdn.com/chrislohfinkblackbirdio-140929192436-phpapp02/75/Cassandra-Summit-2014-Monitor-Everything-16-2048.jpg)
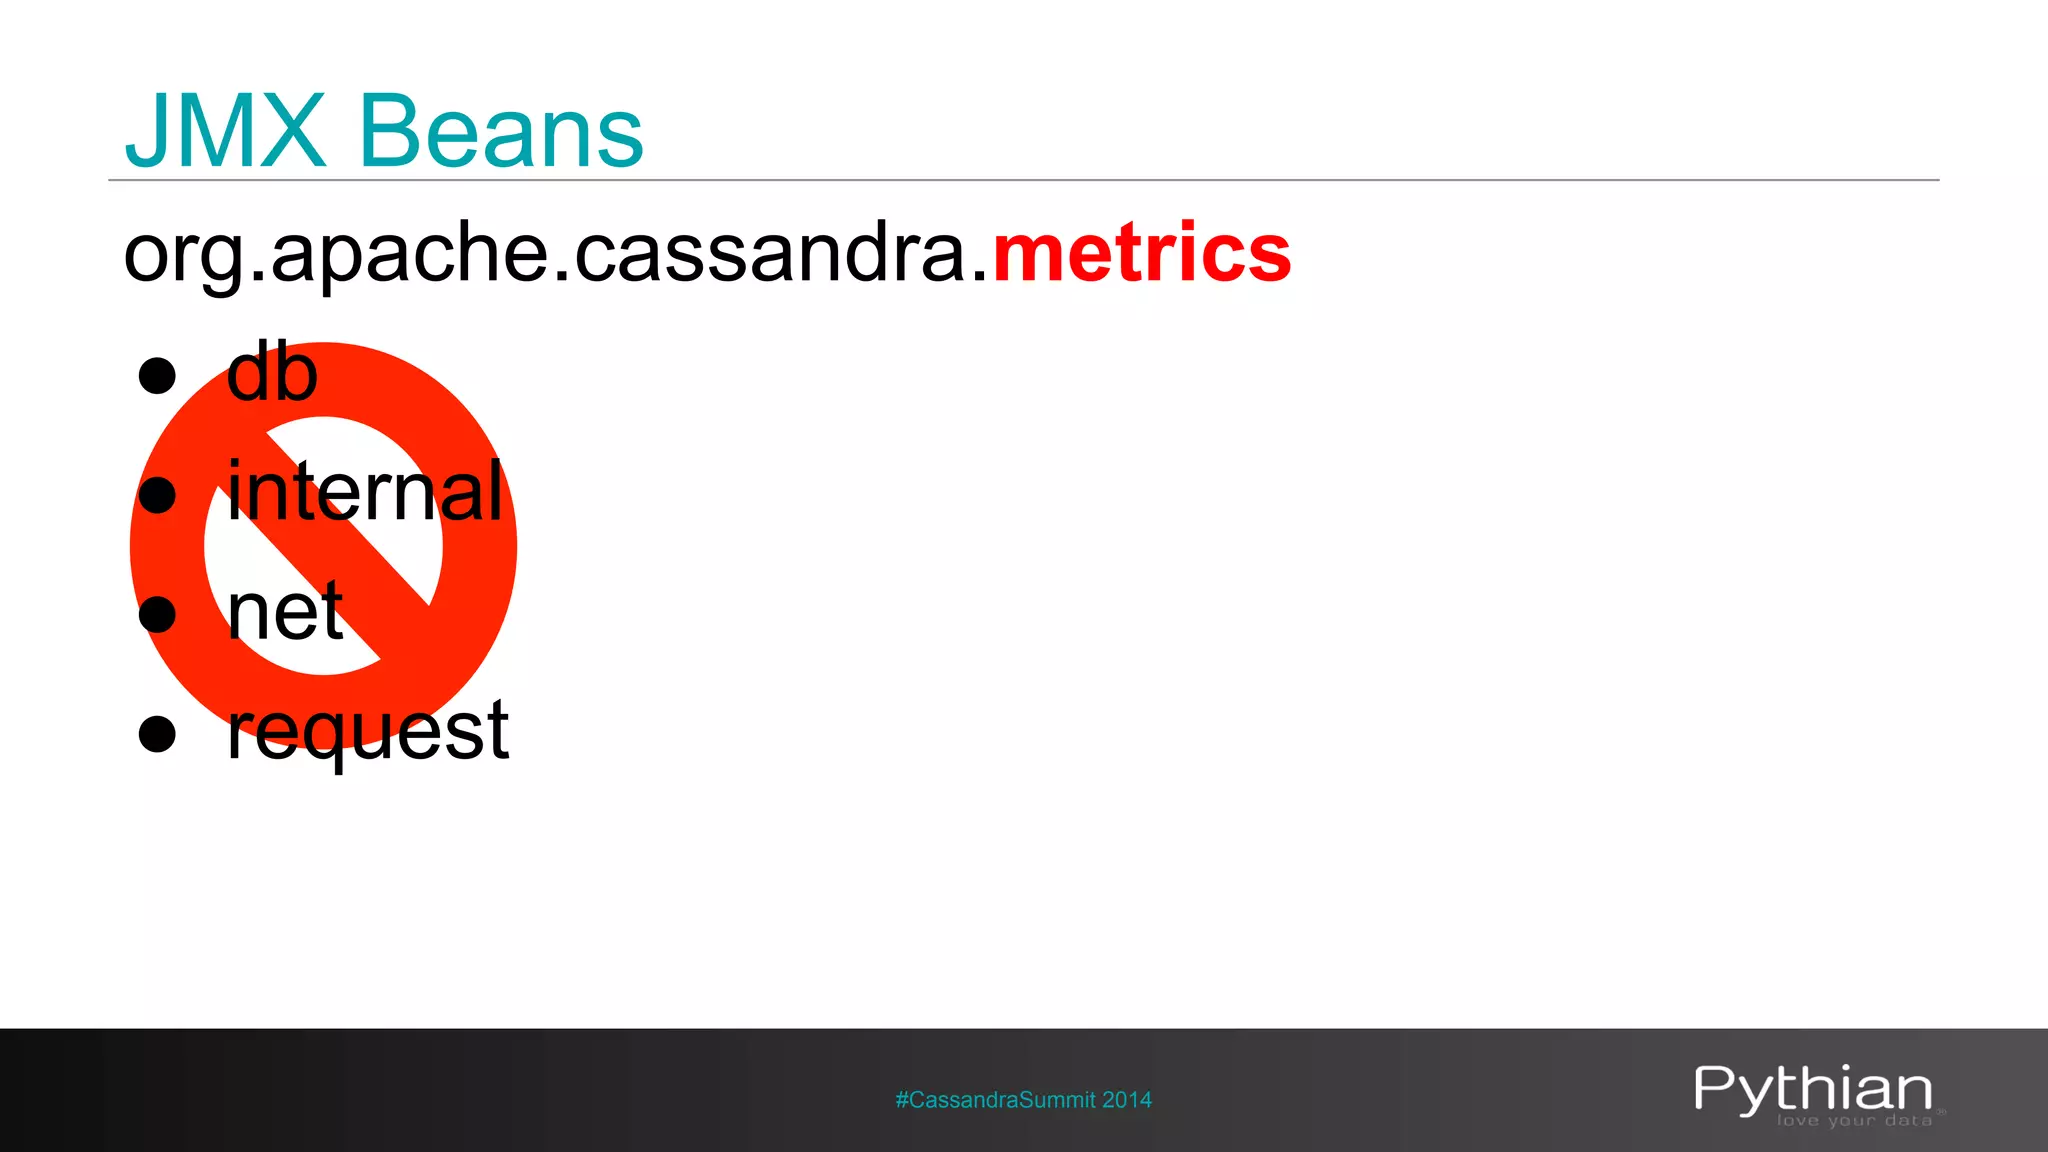
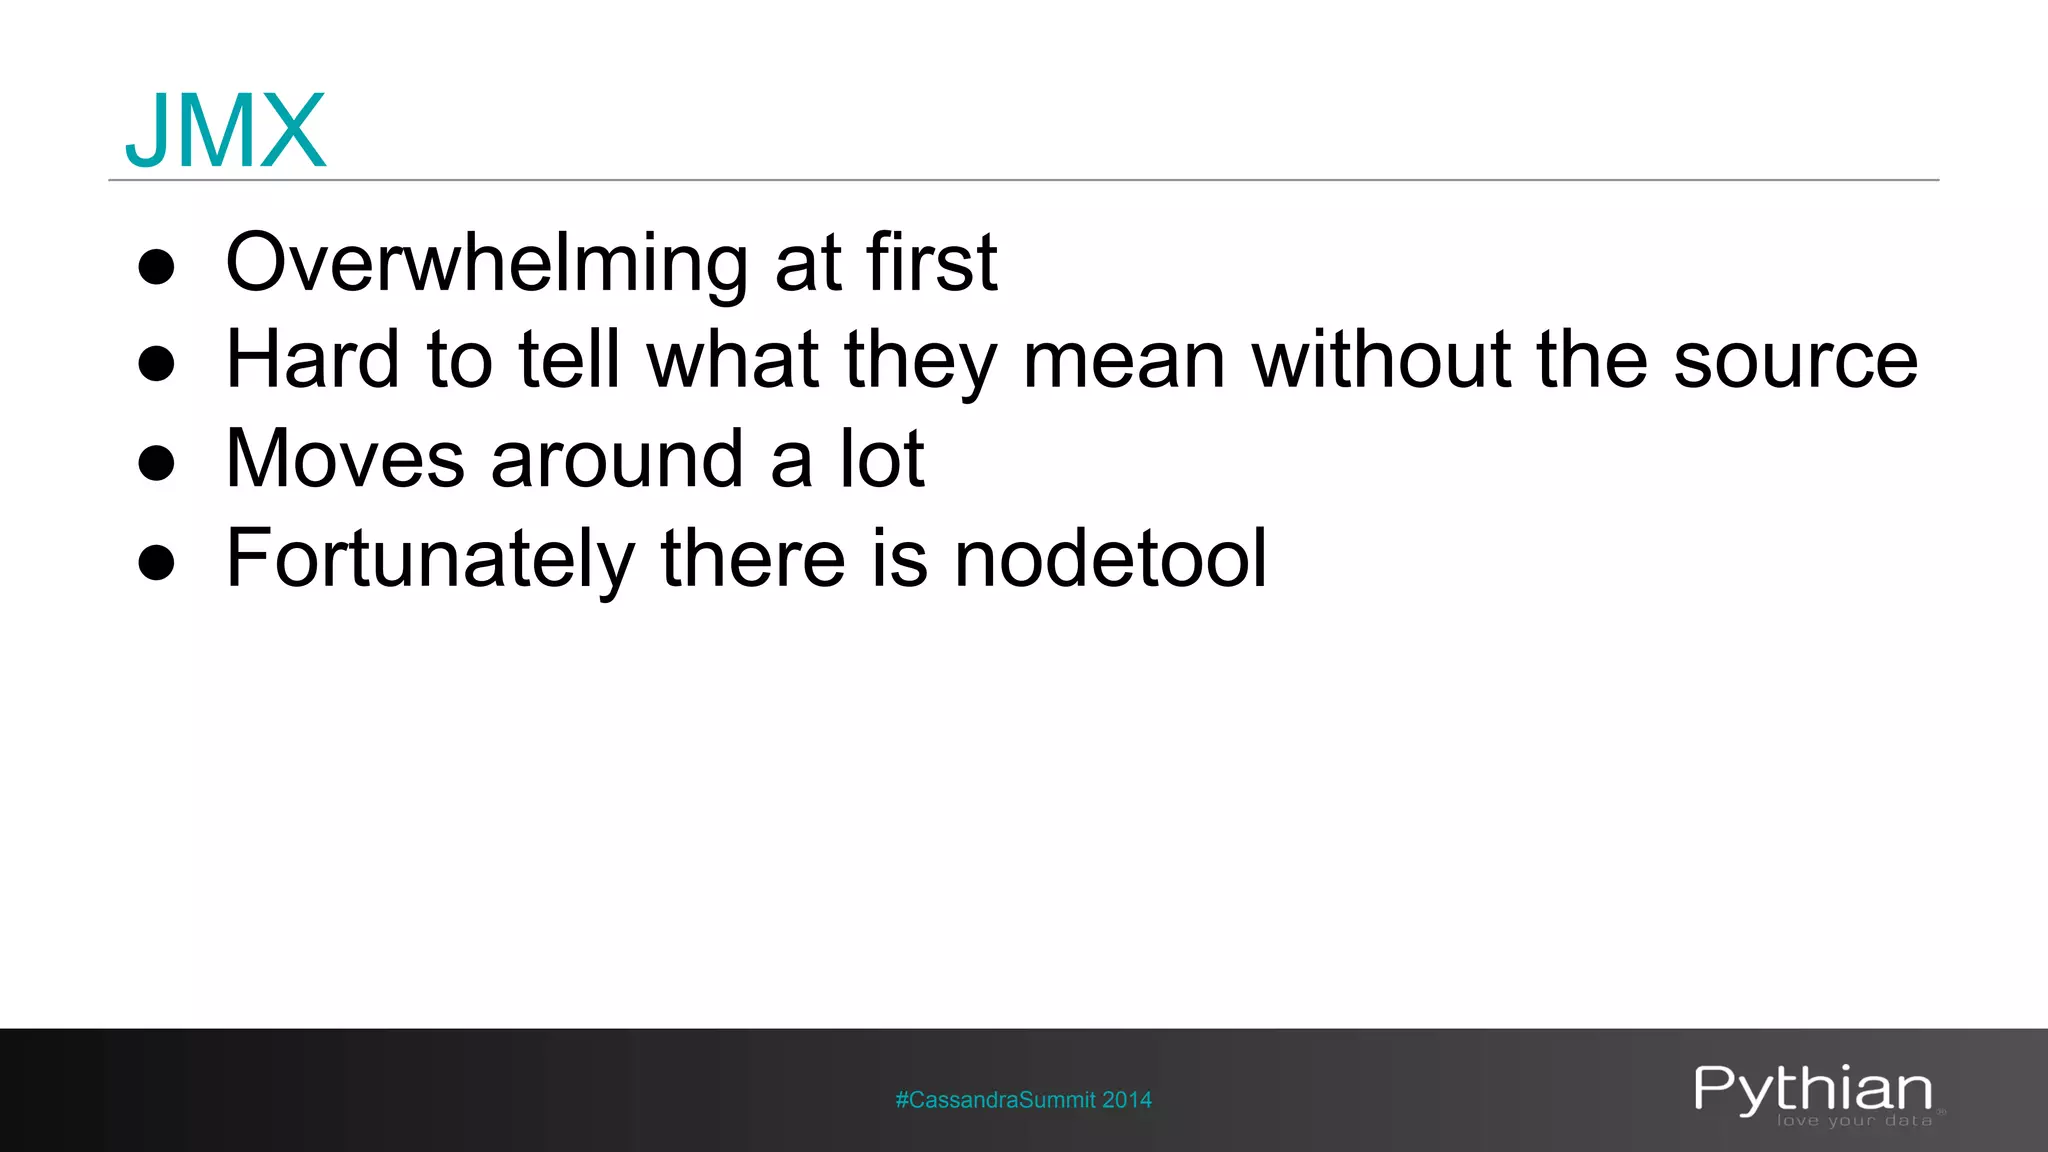
![JMX
[domain]:[key]=[value],[key2]=[value2]...
com.pythian:site=blog,type=views,target=post1
#CassandraSummit 2014](https://image.slidesharecdn.com/chrislohfinkblackbirdio-140929192436-phpapp02/75/Cassandra-Summit-2014-Monitor-Everything-17-2048.jpg)
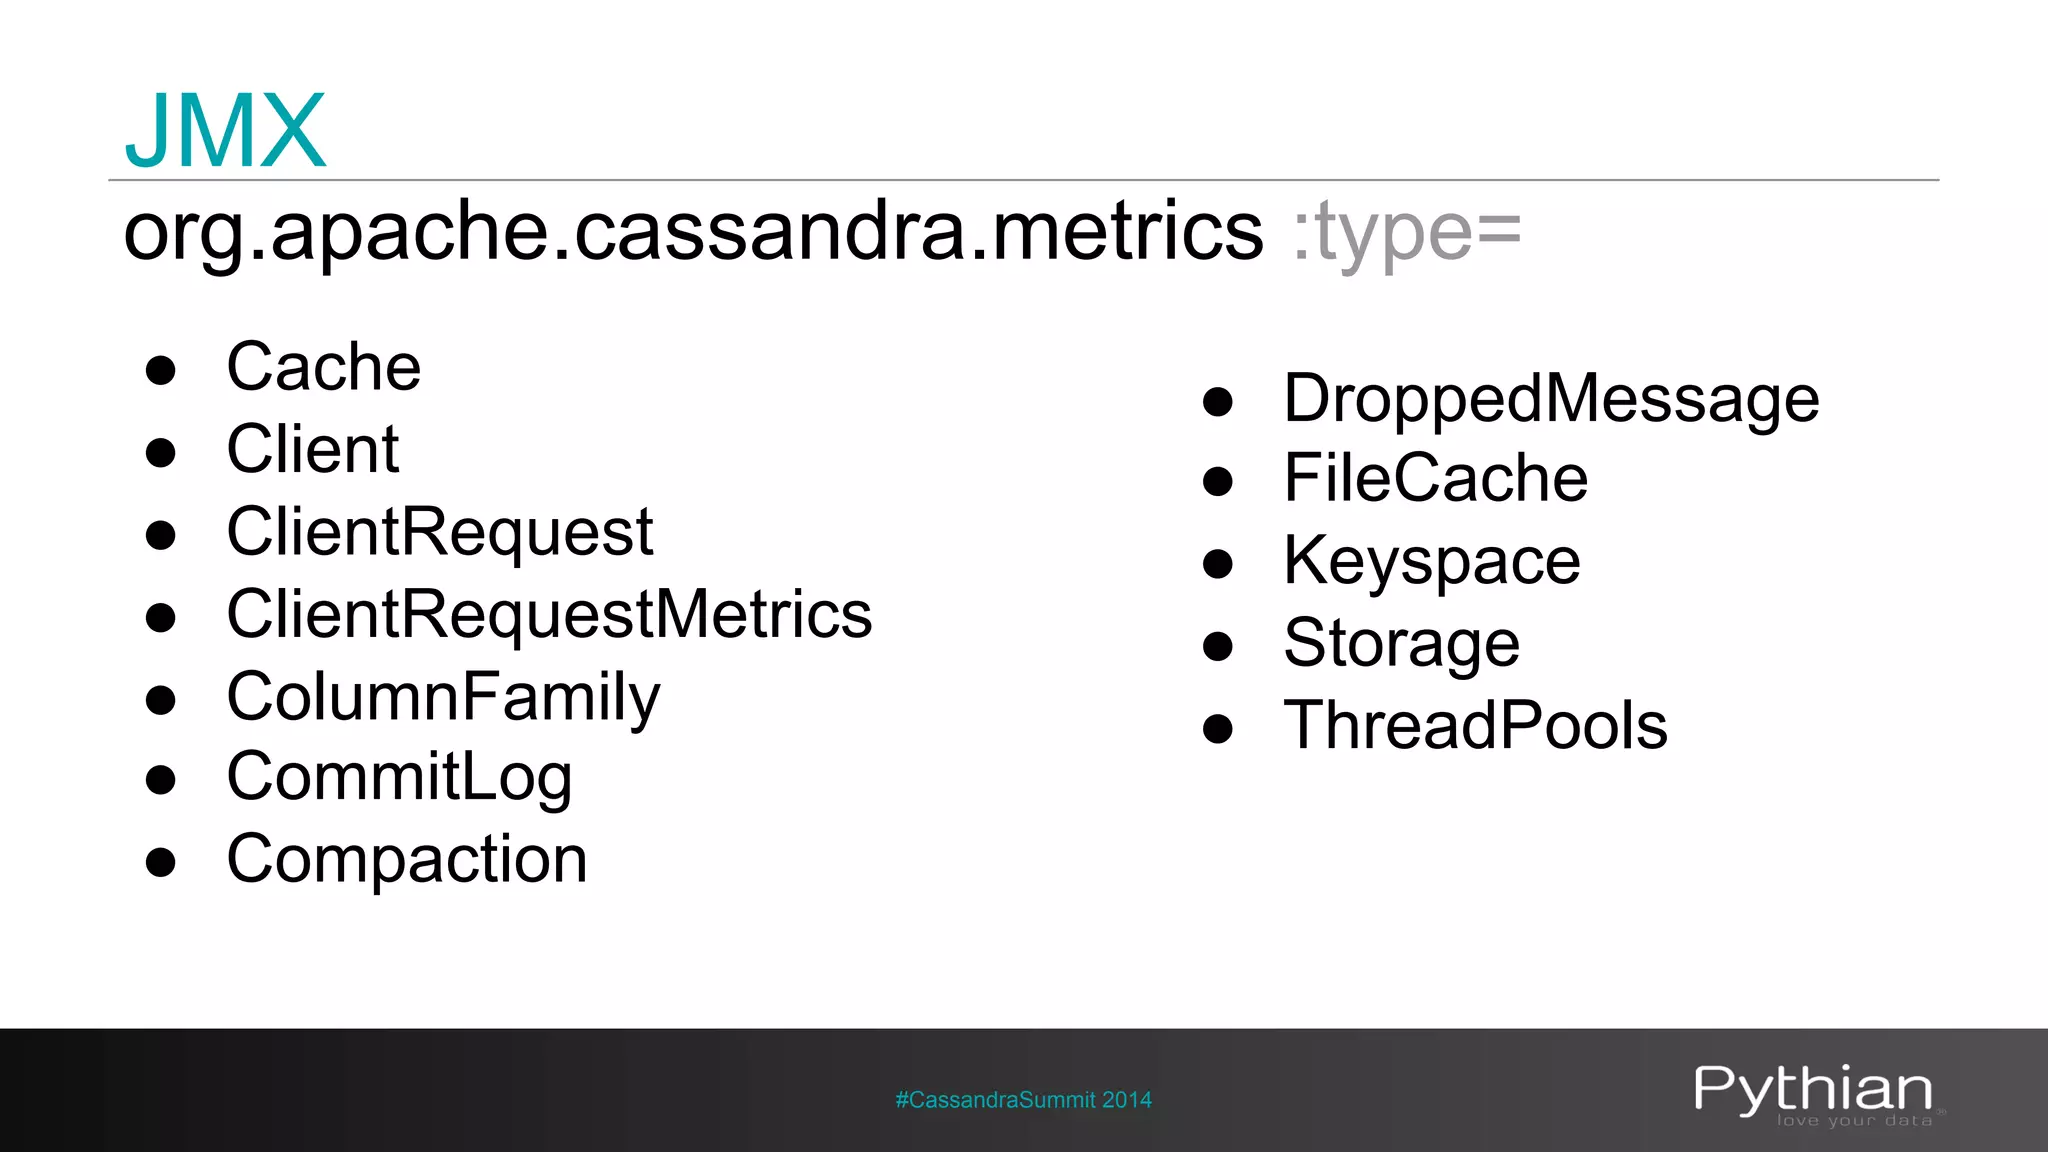
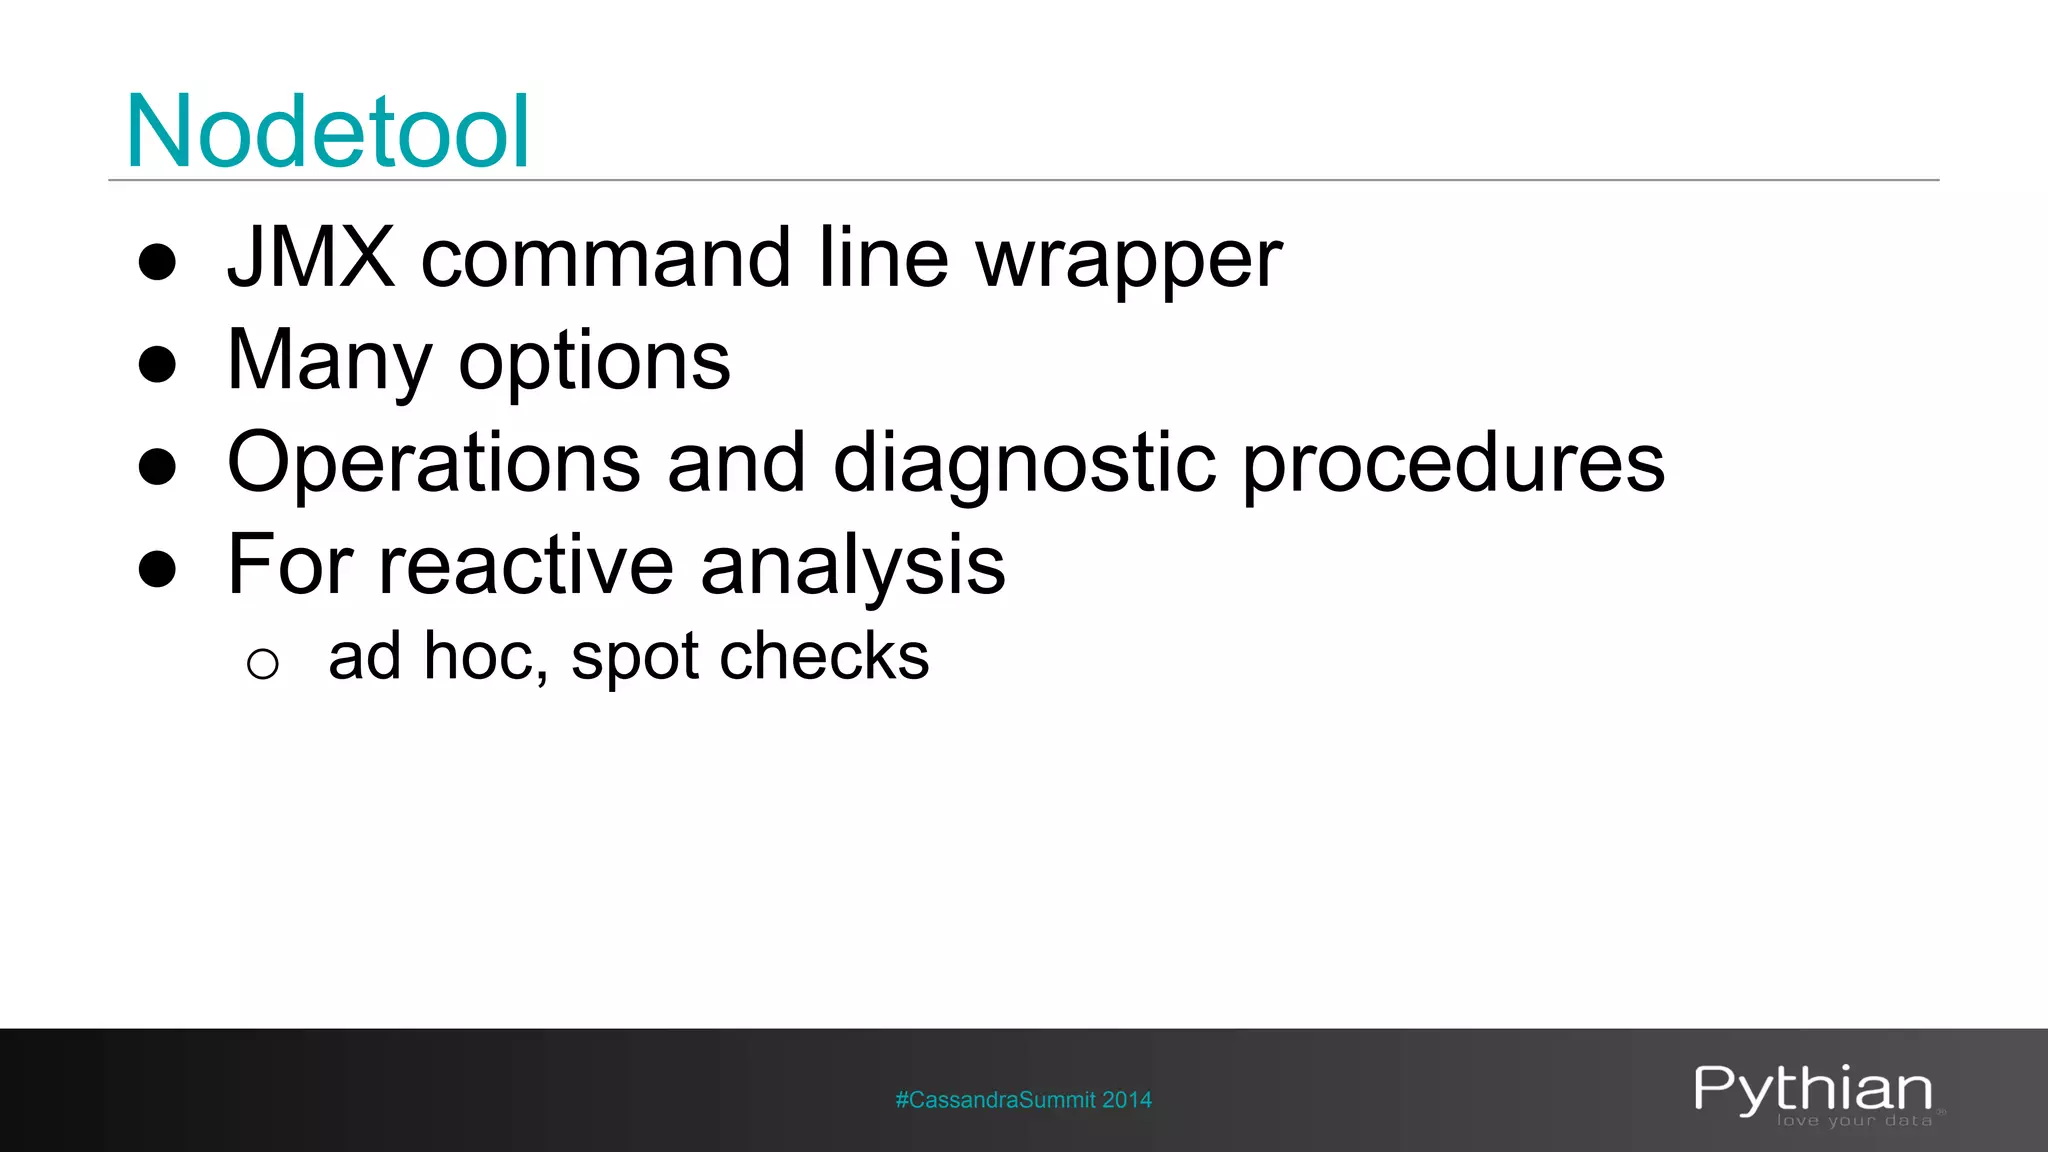
![JMX
[domain]:[key]=[value],[key2]=[value2]...
com.pythian:site=blog,type=views,target=post1
#CassandraSummit 2014](https://image.slidesharecdn.com/chrislohfinkblackbirdio-140929192436-phpapp02/75/Cassandra-Summit-2014-Monitor-Everything-18-2048.jpg)


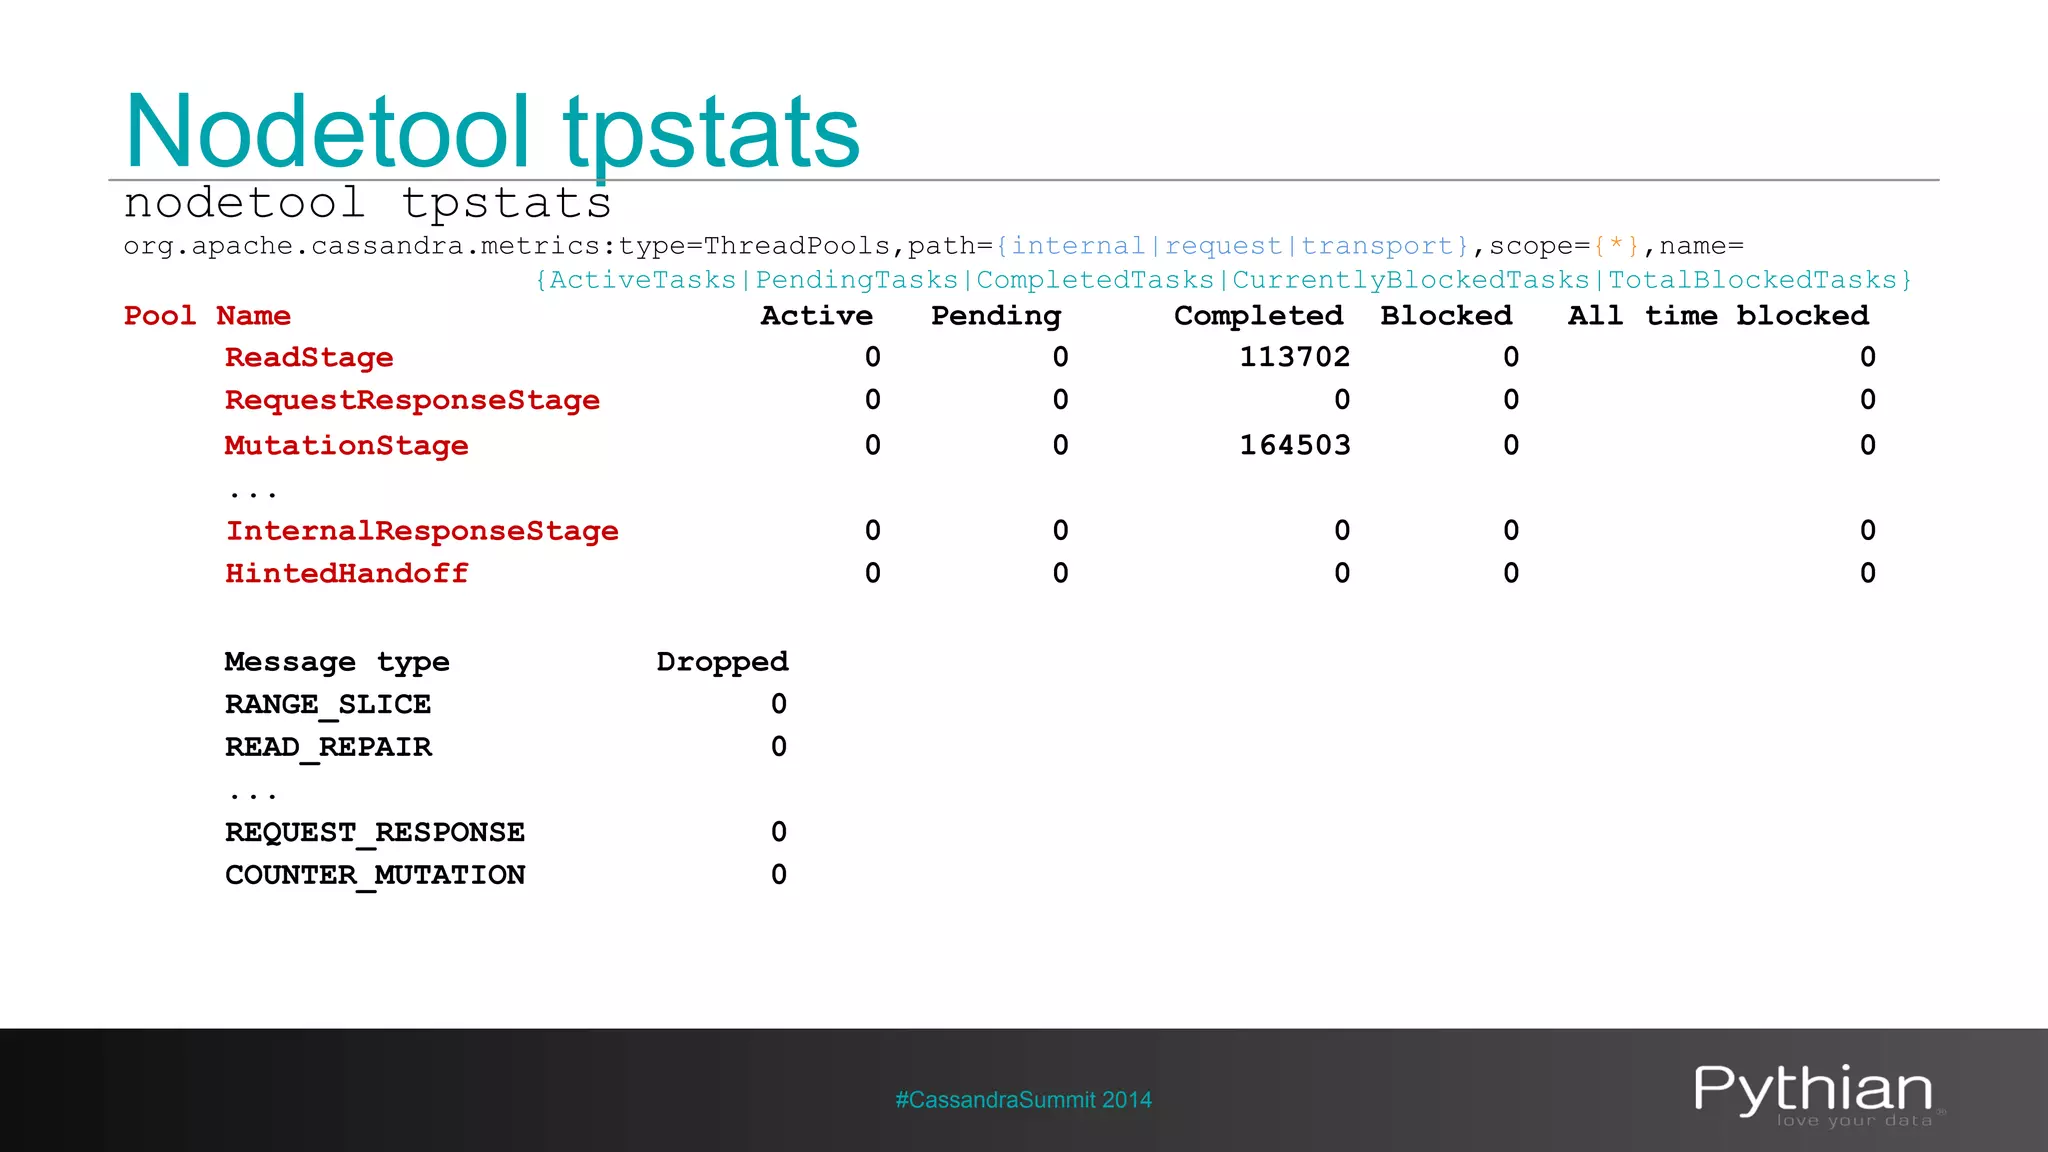
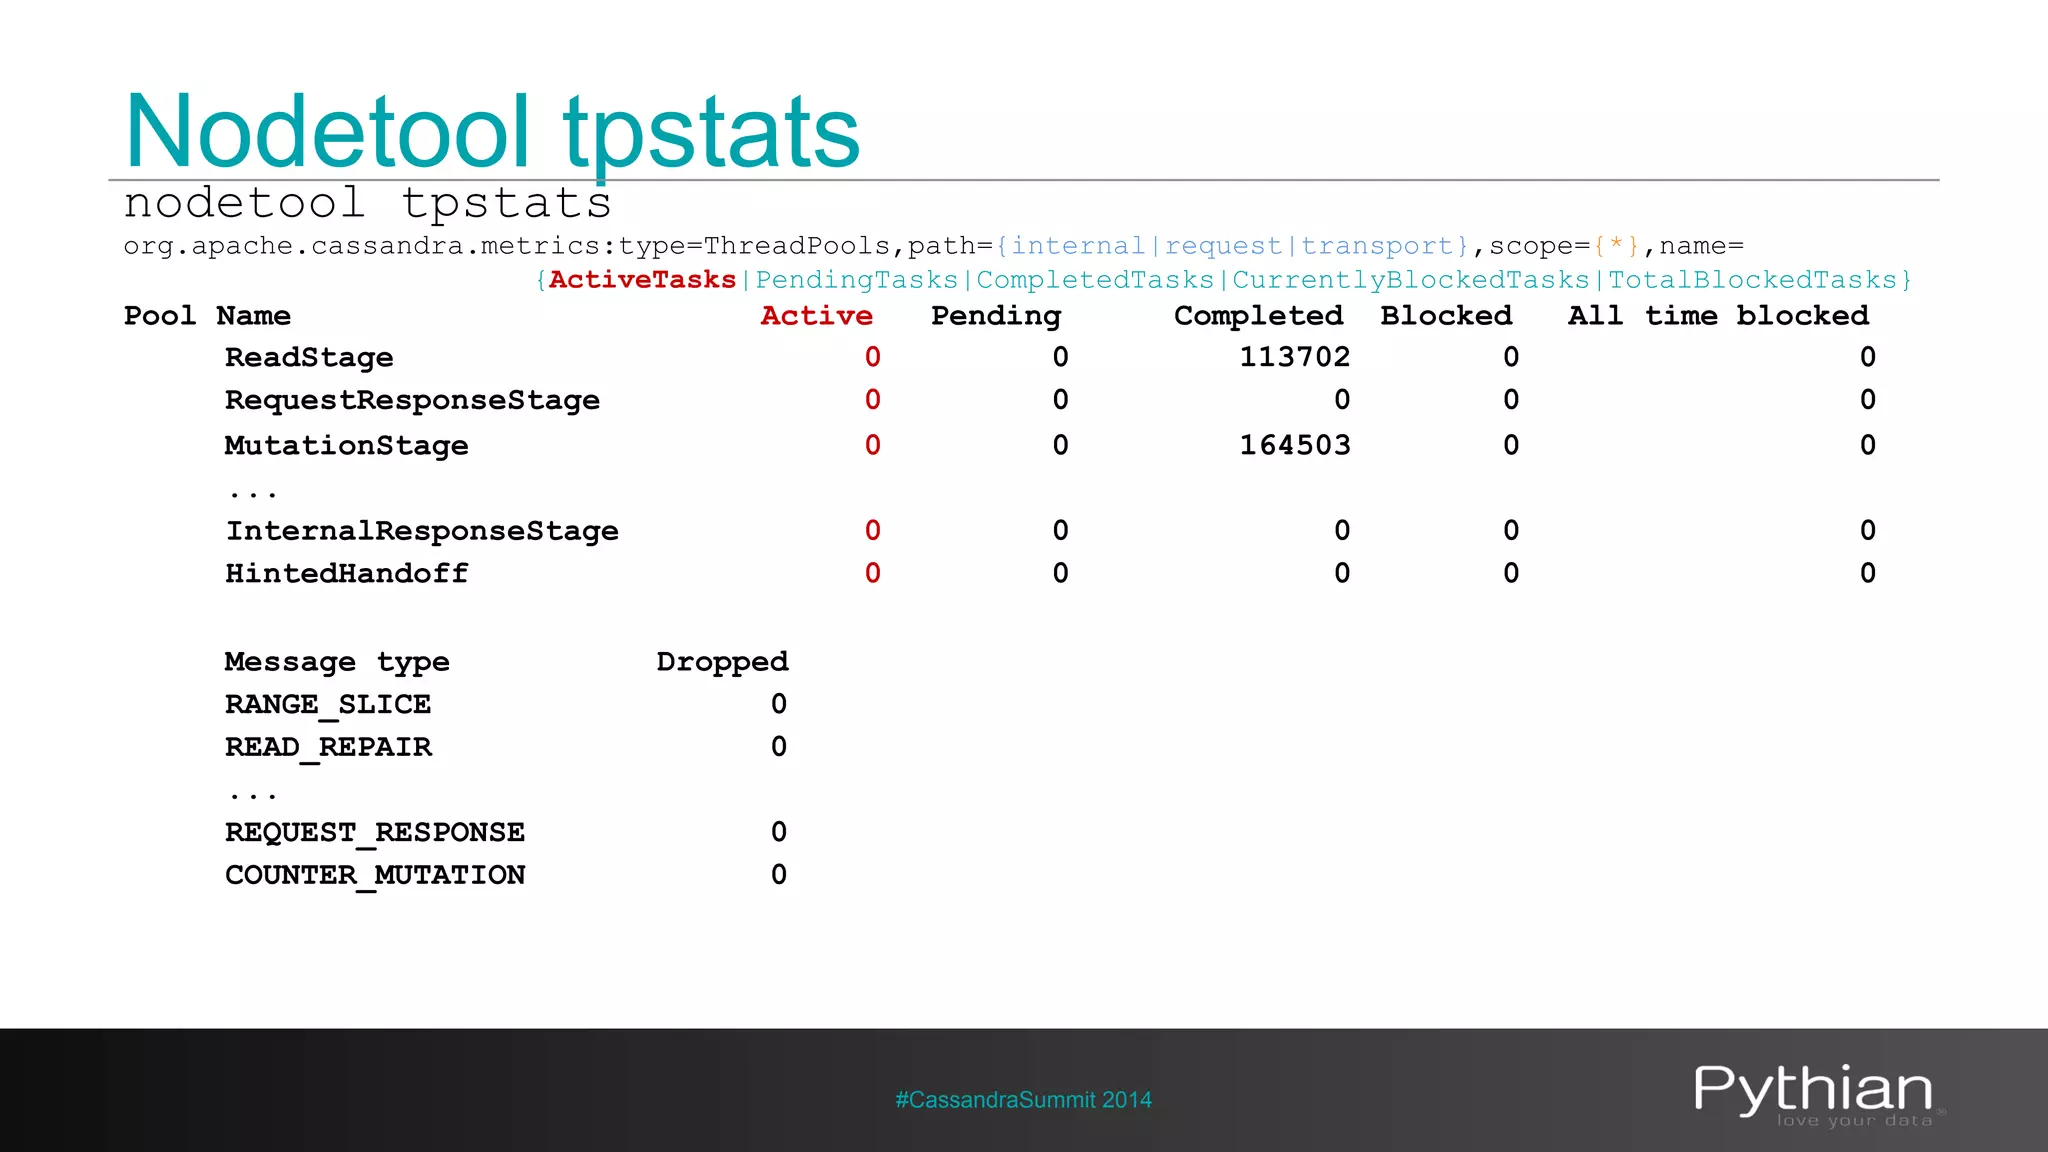


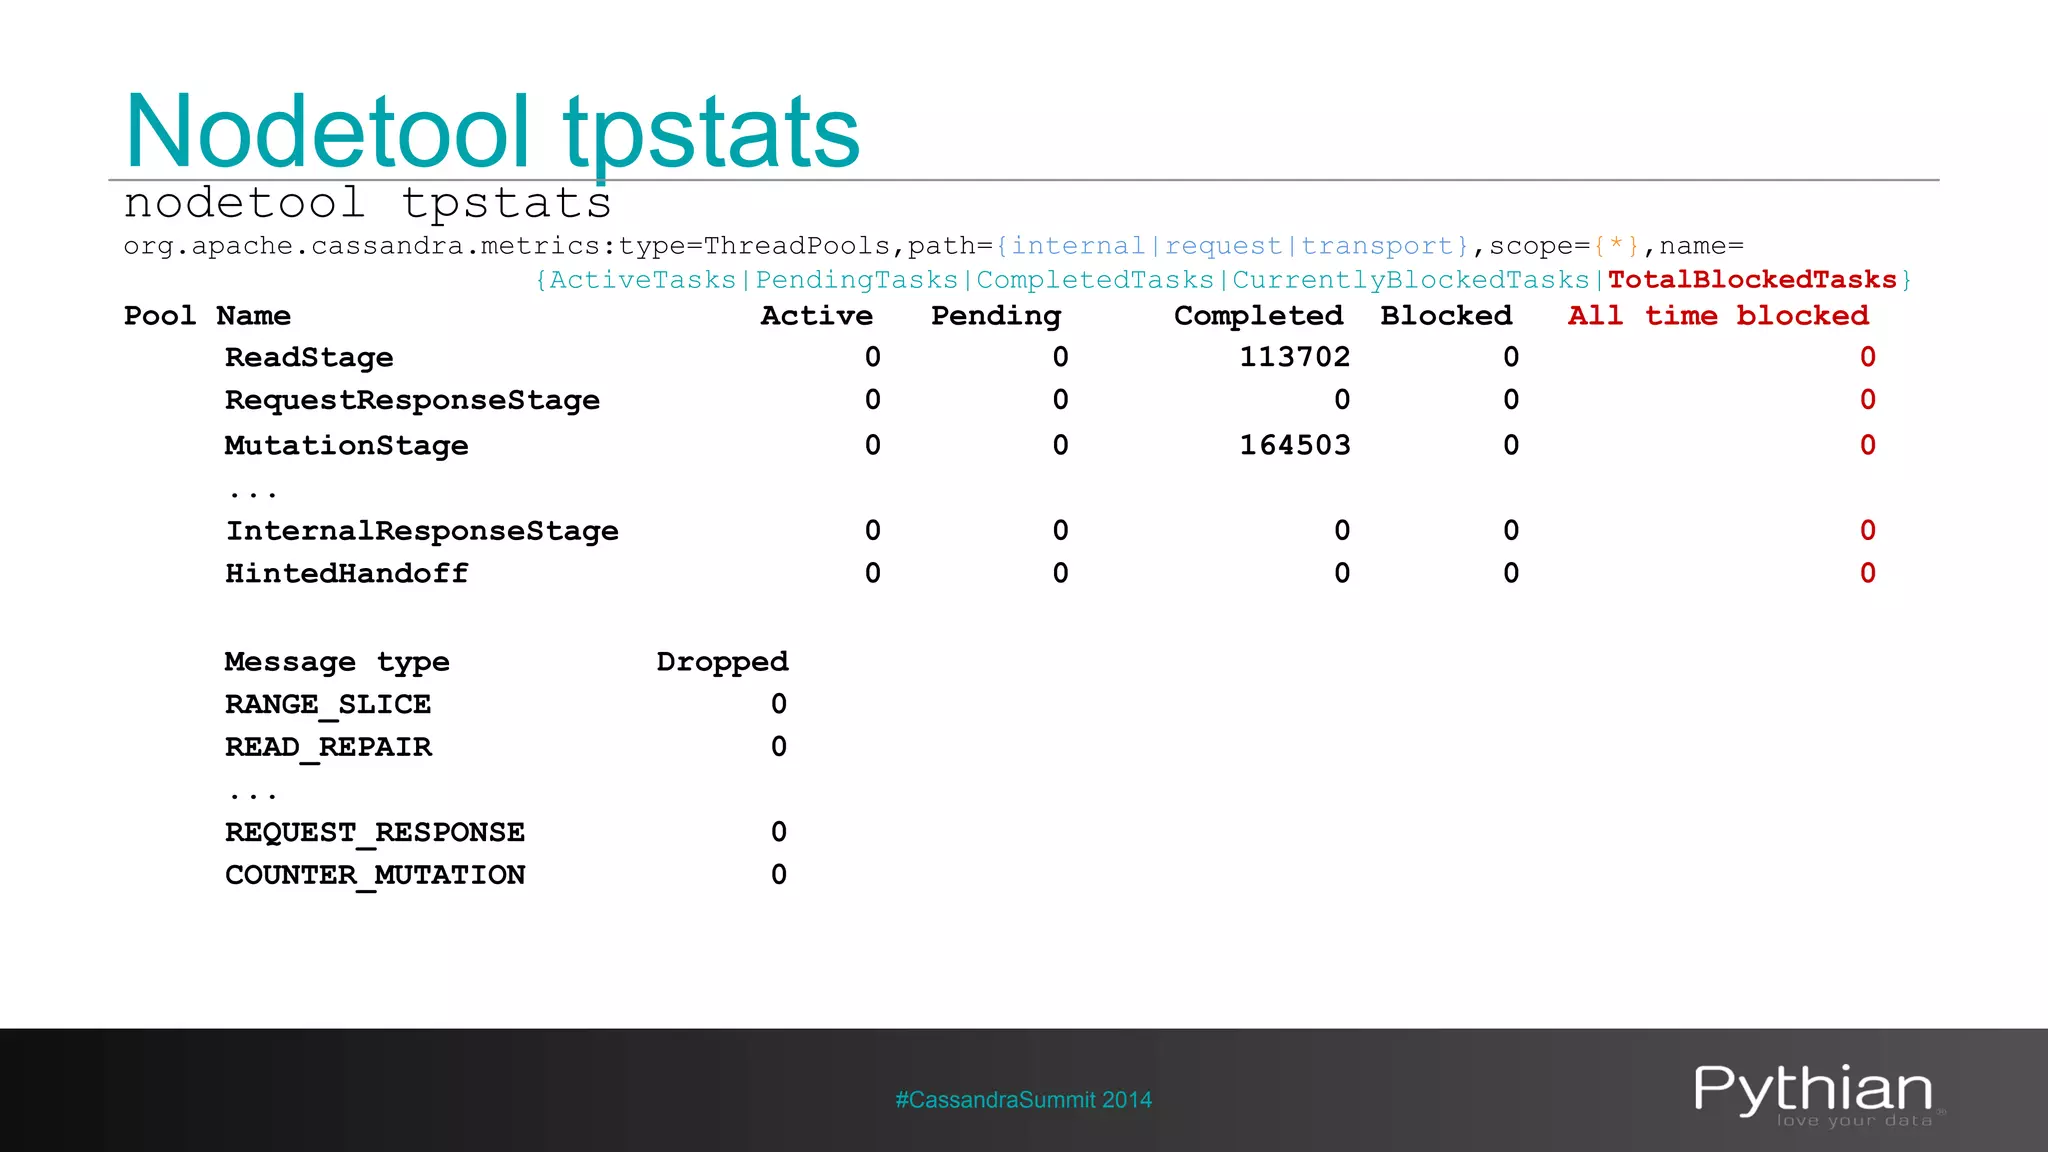
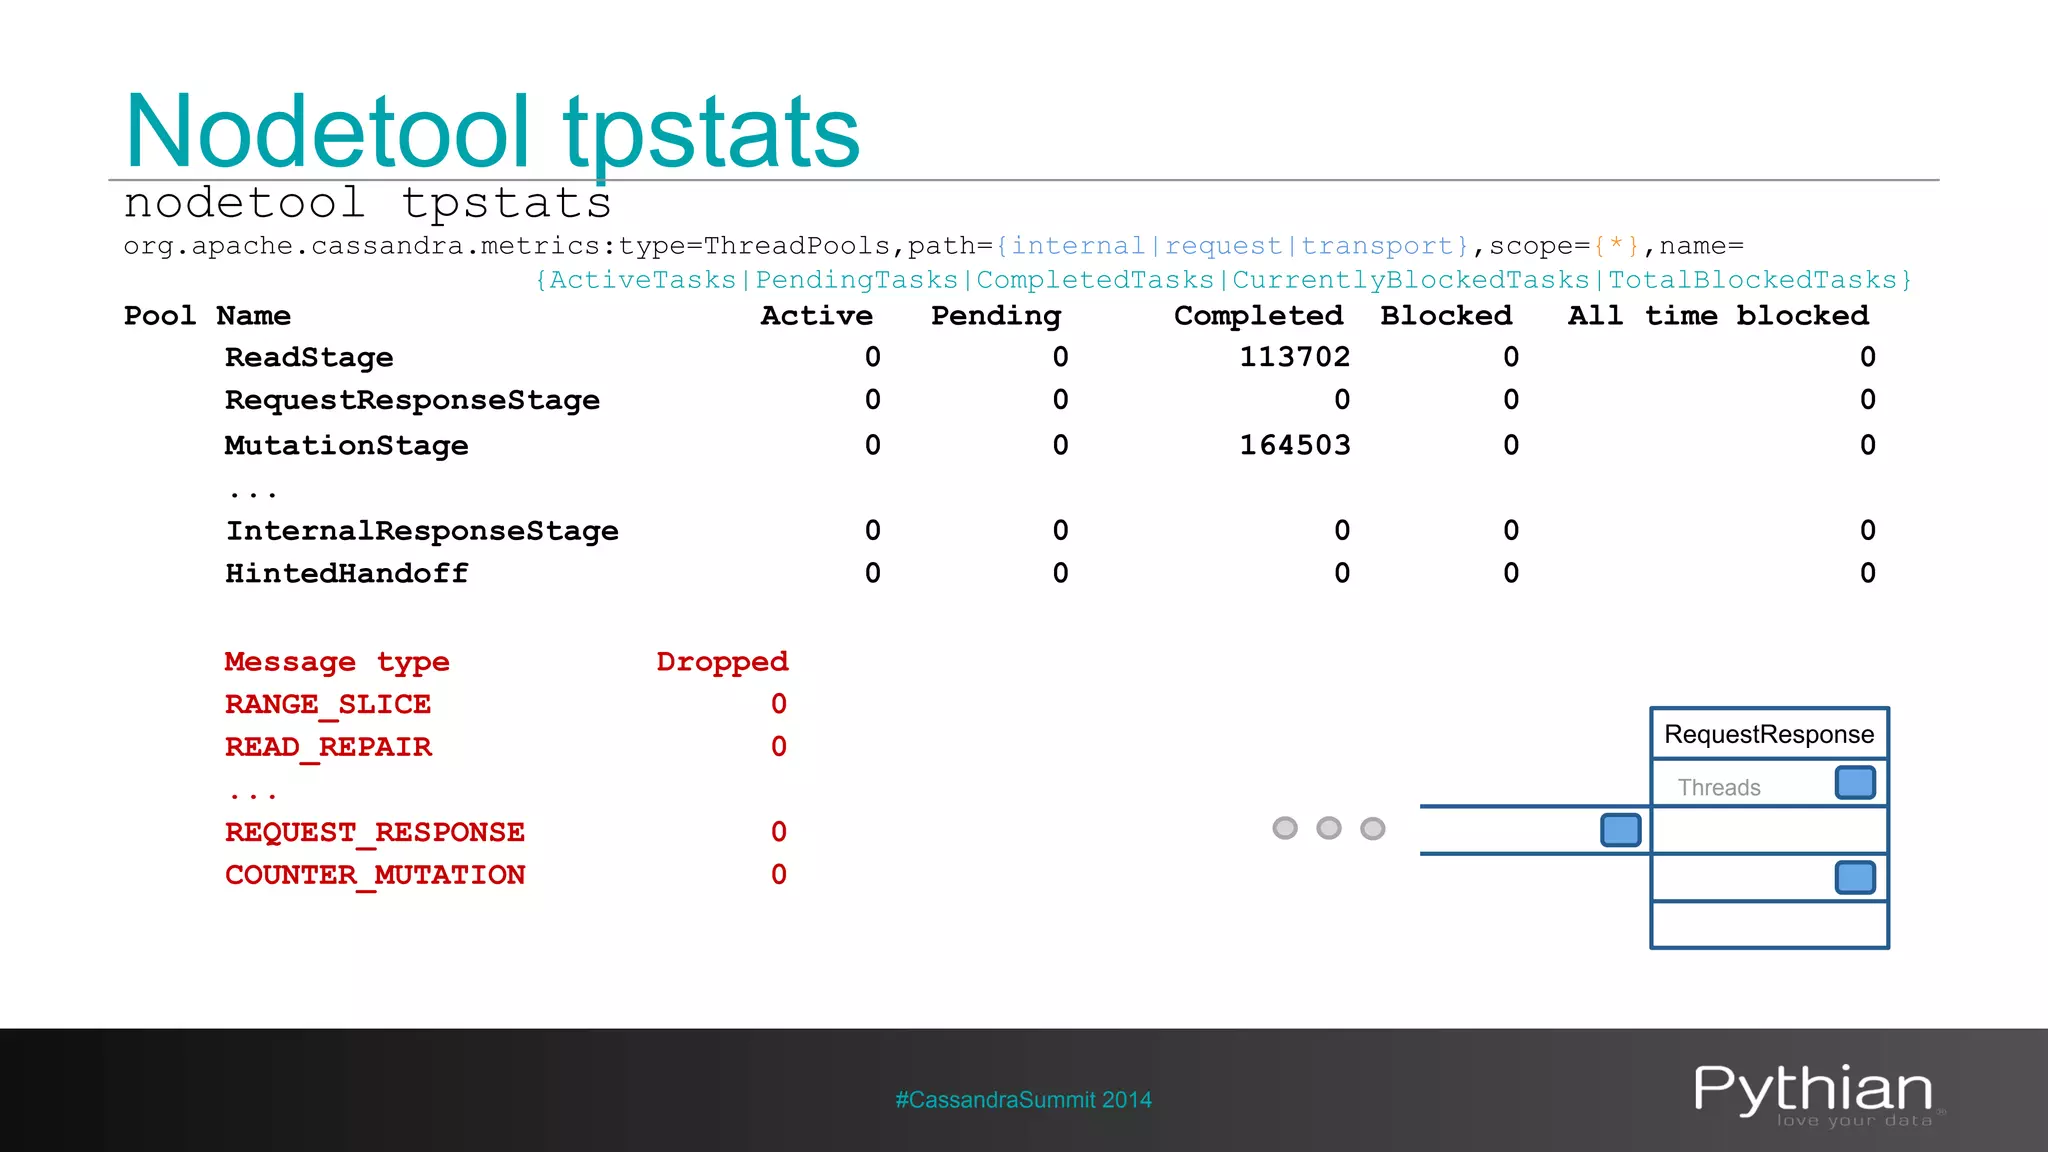


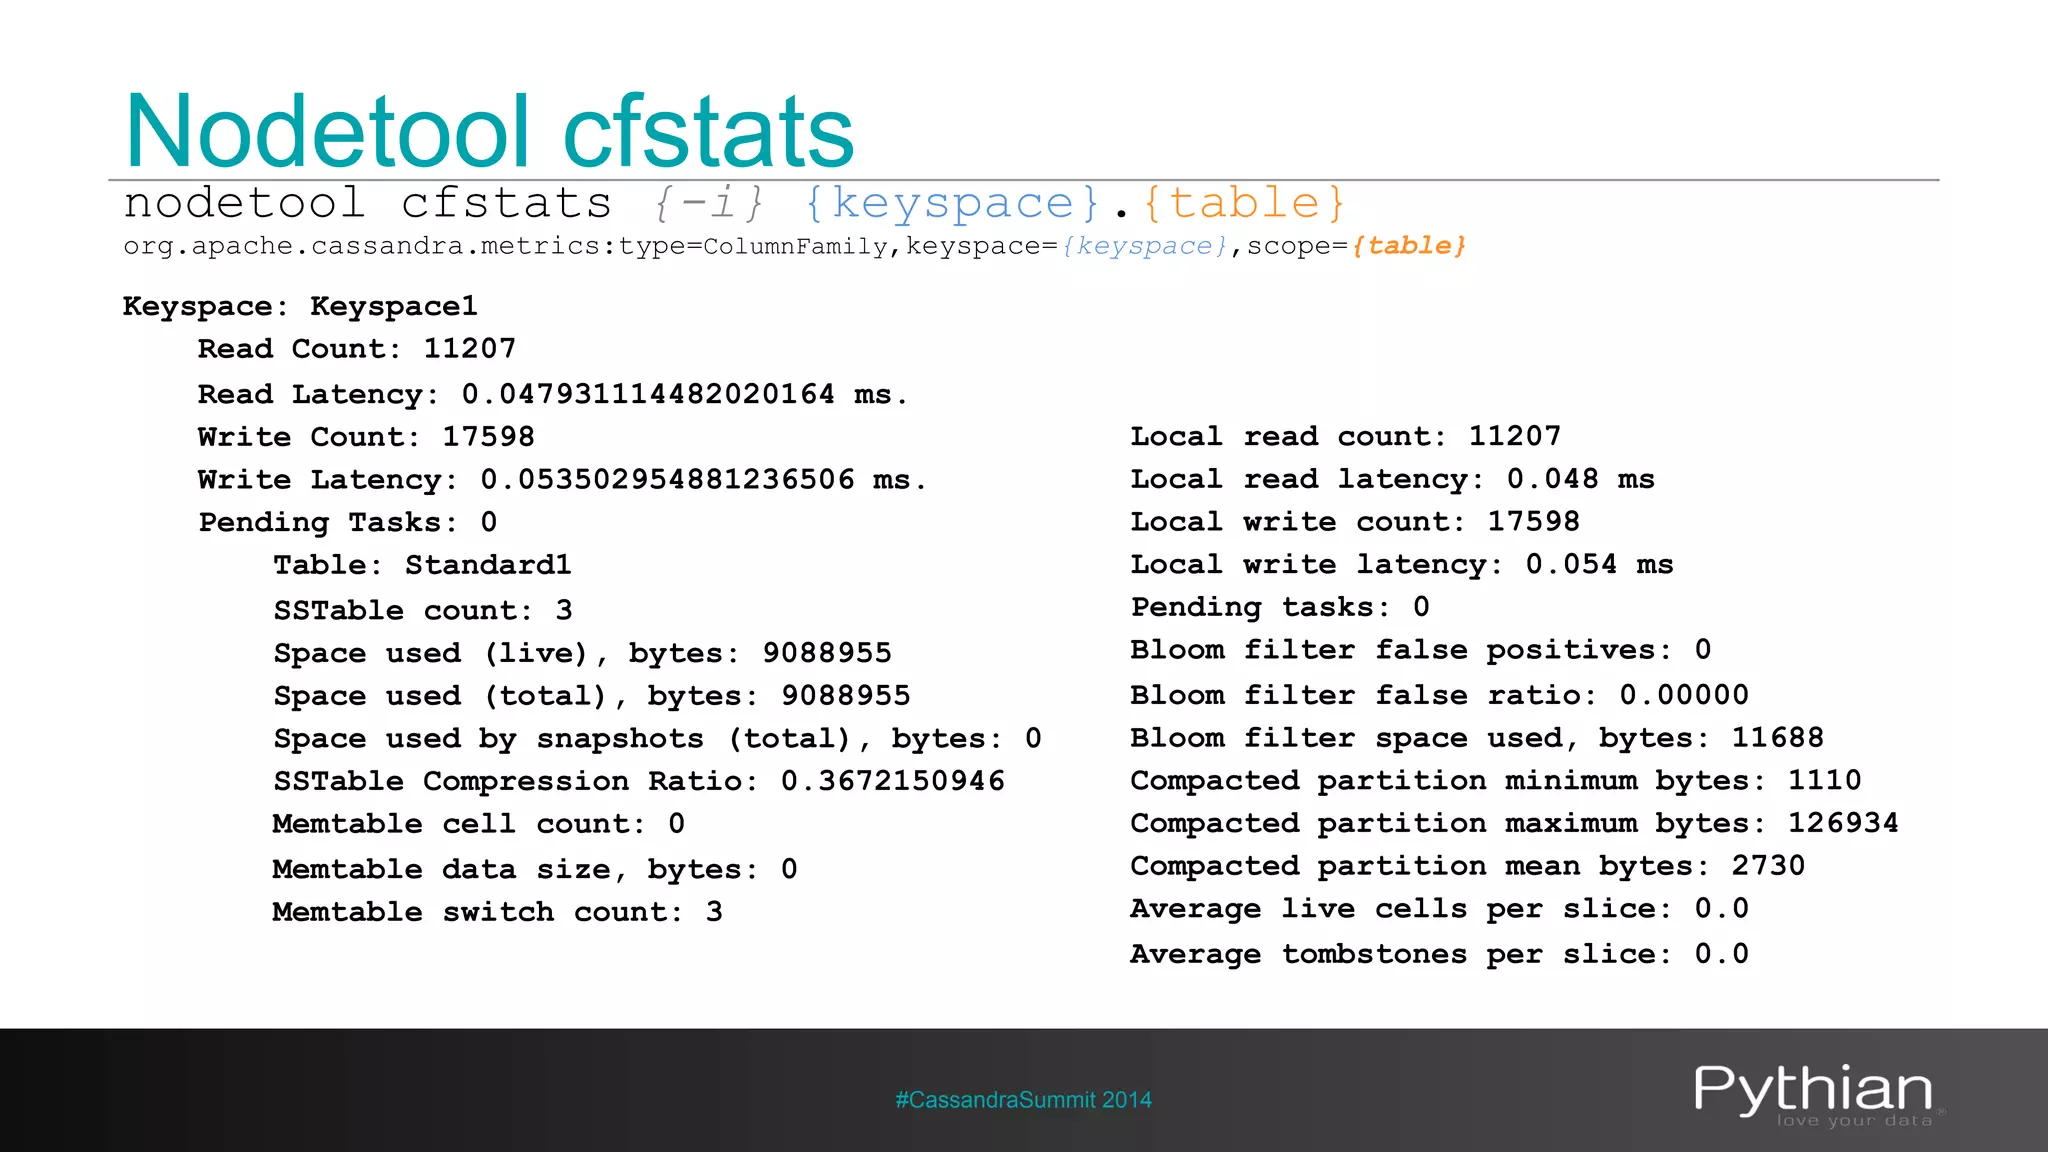
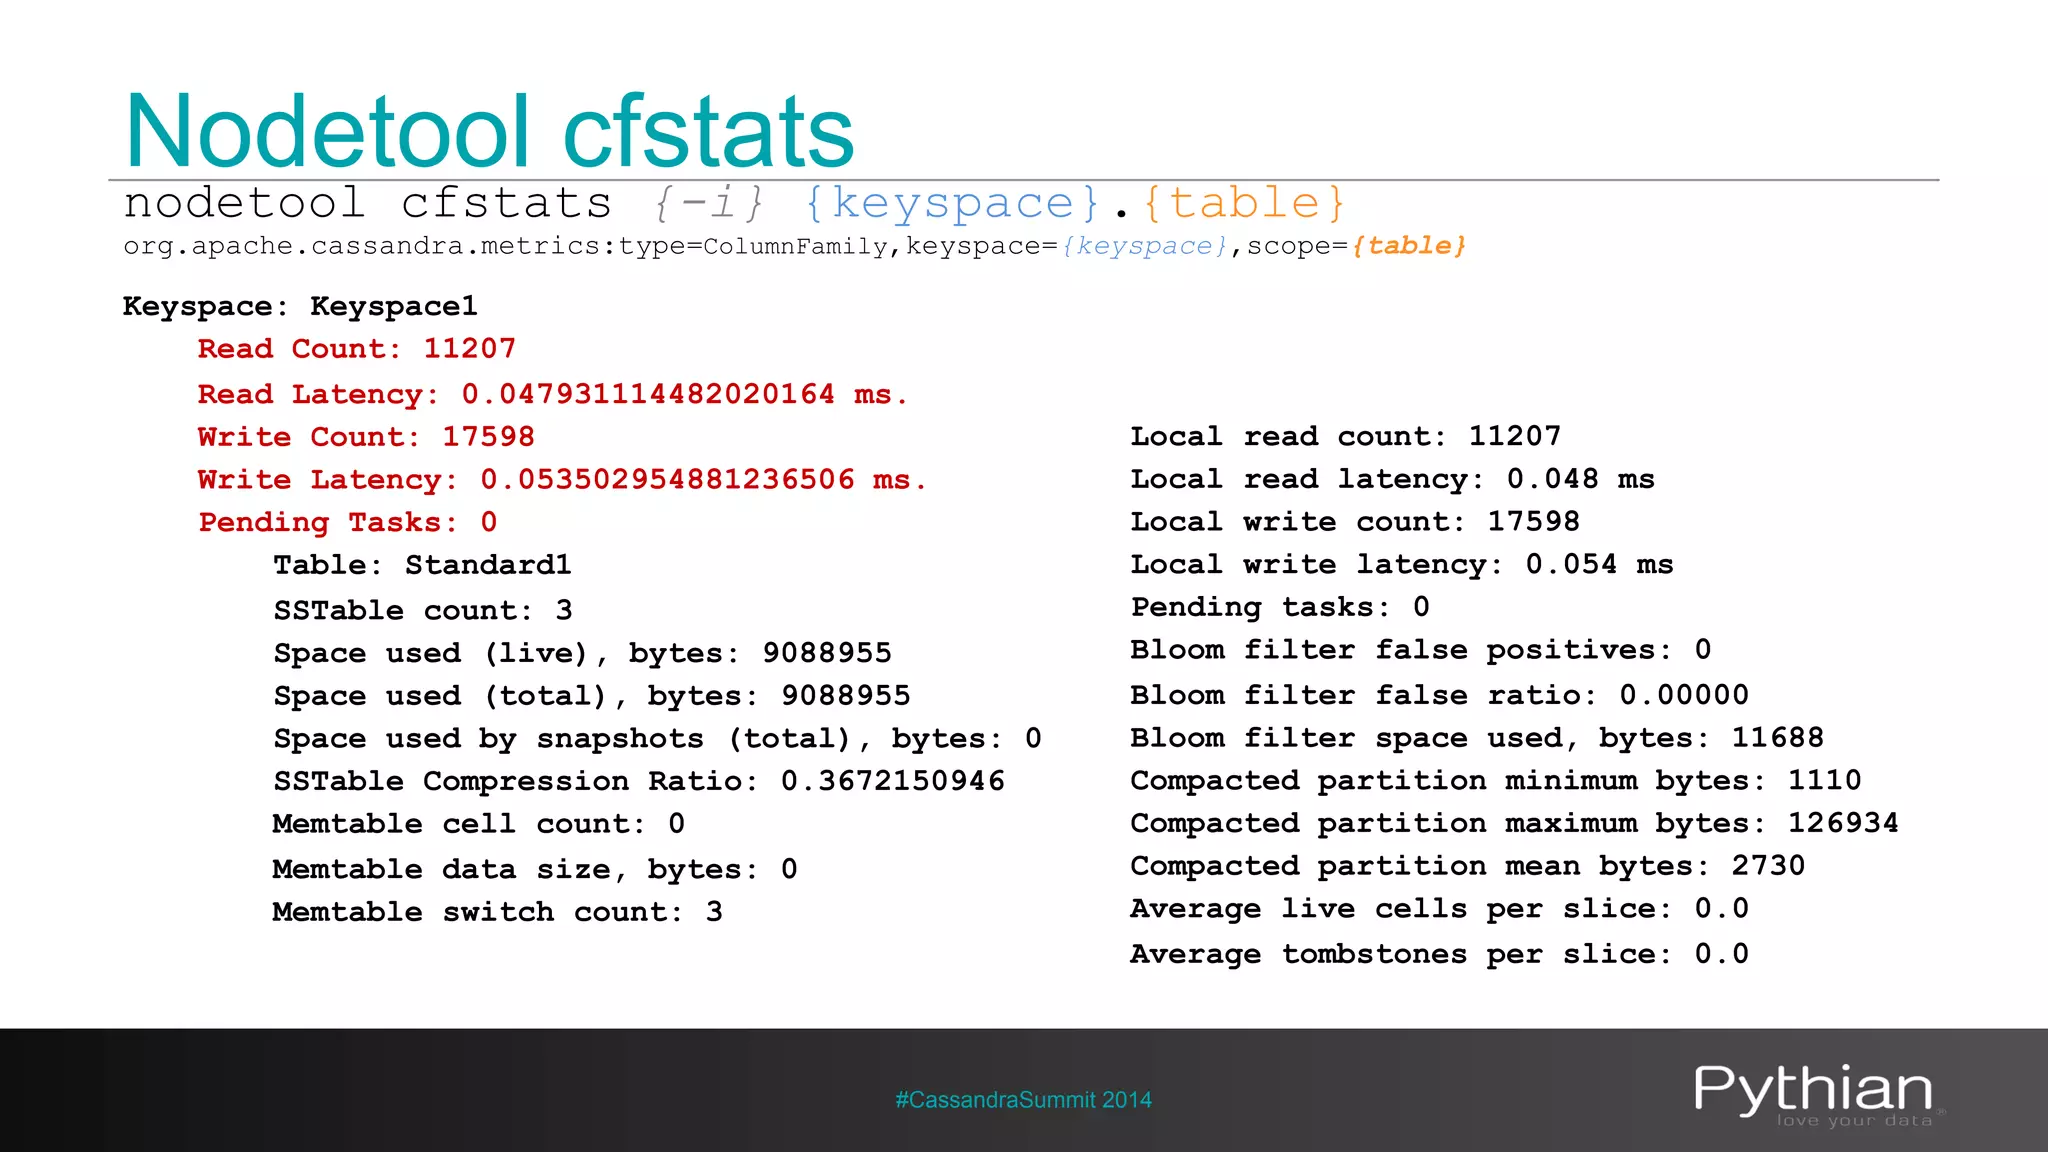

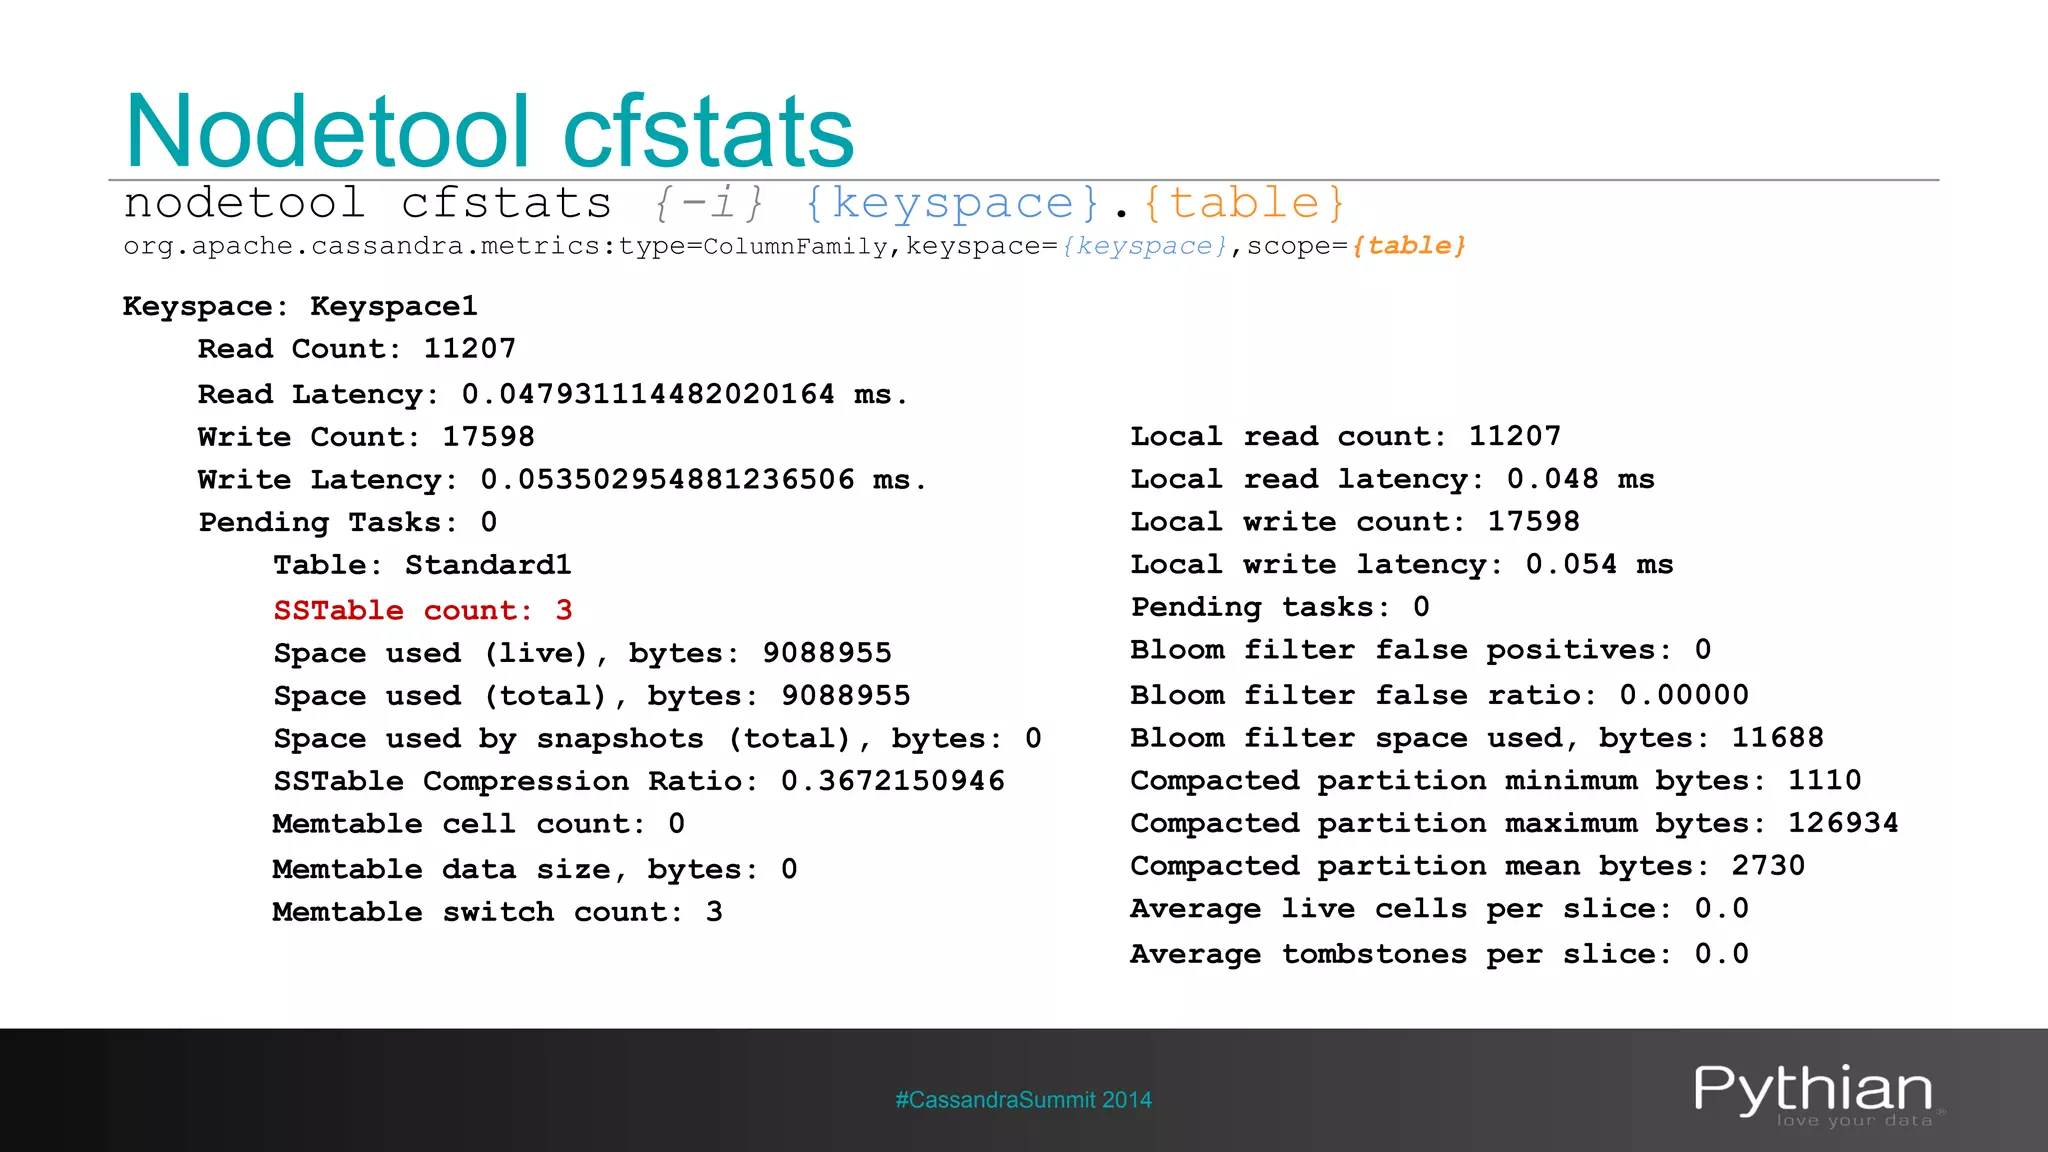
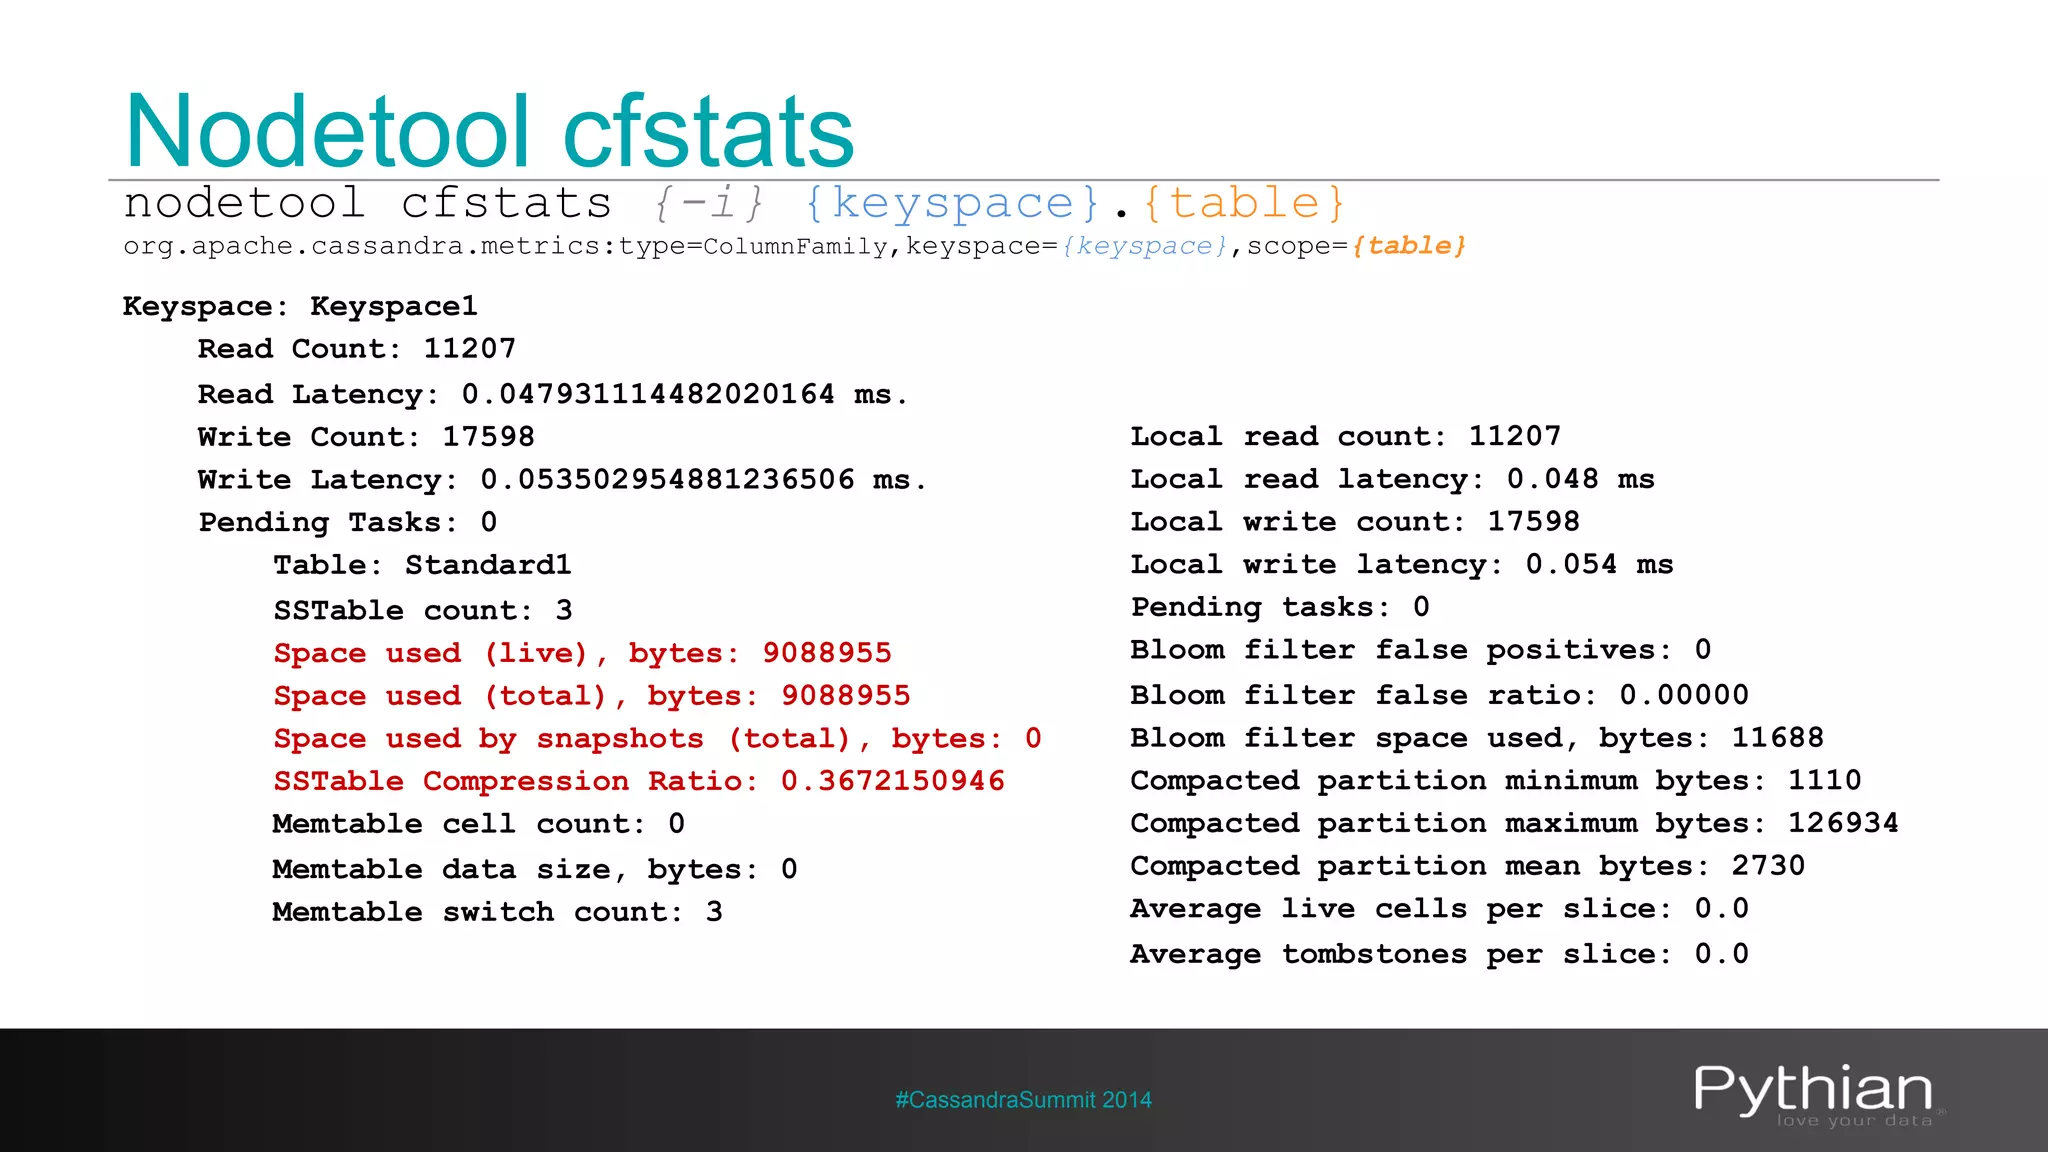
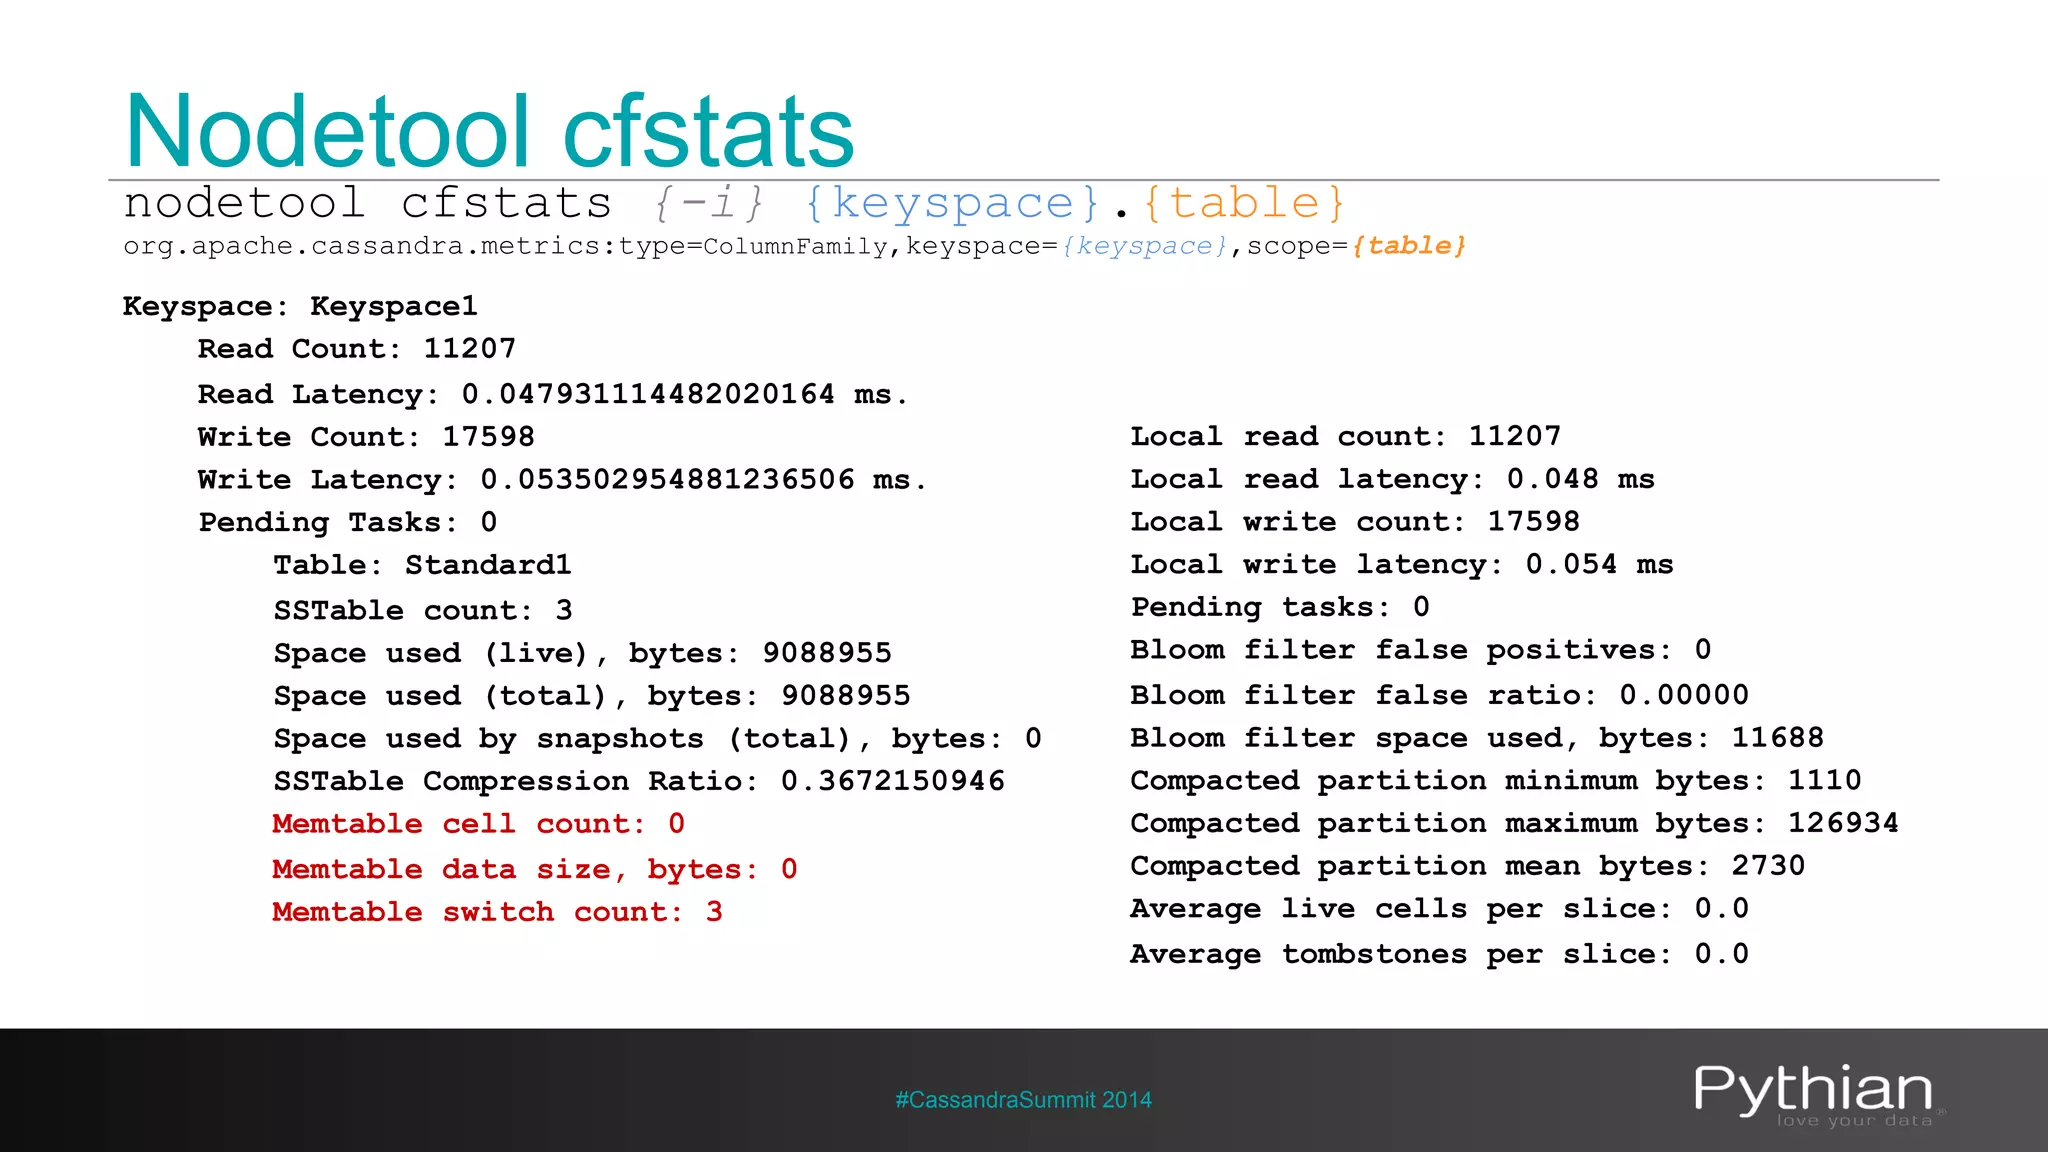
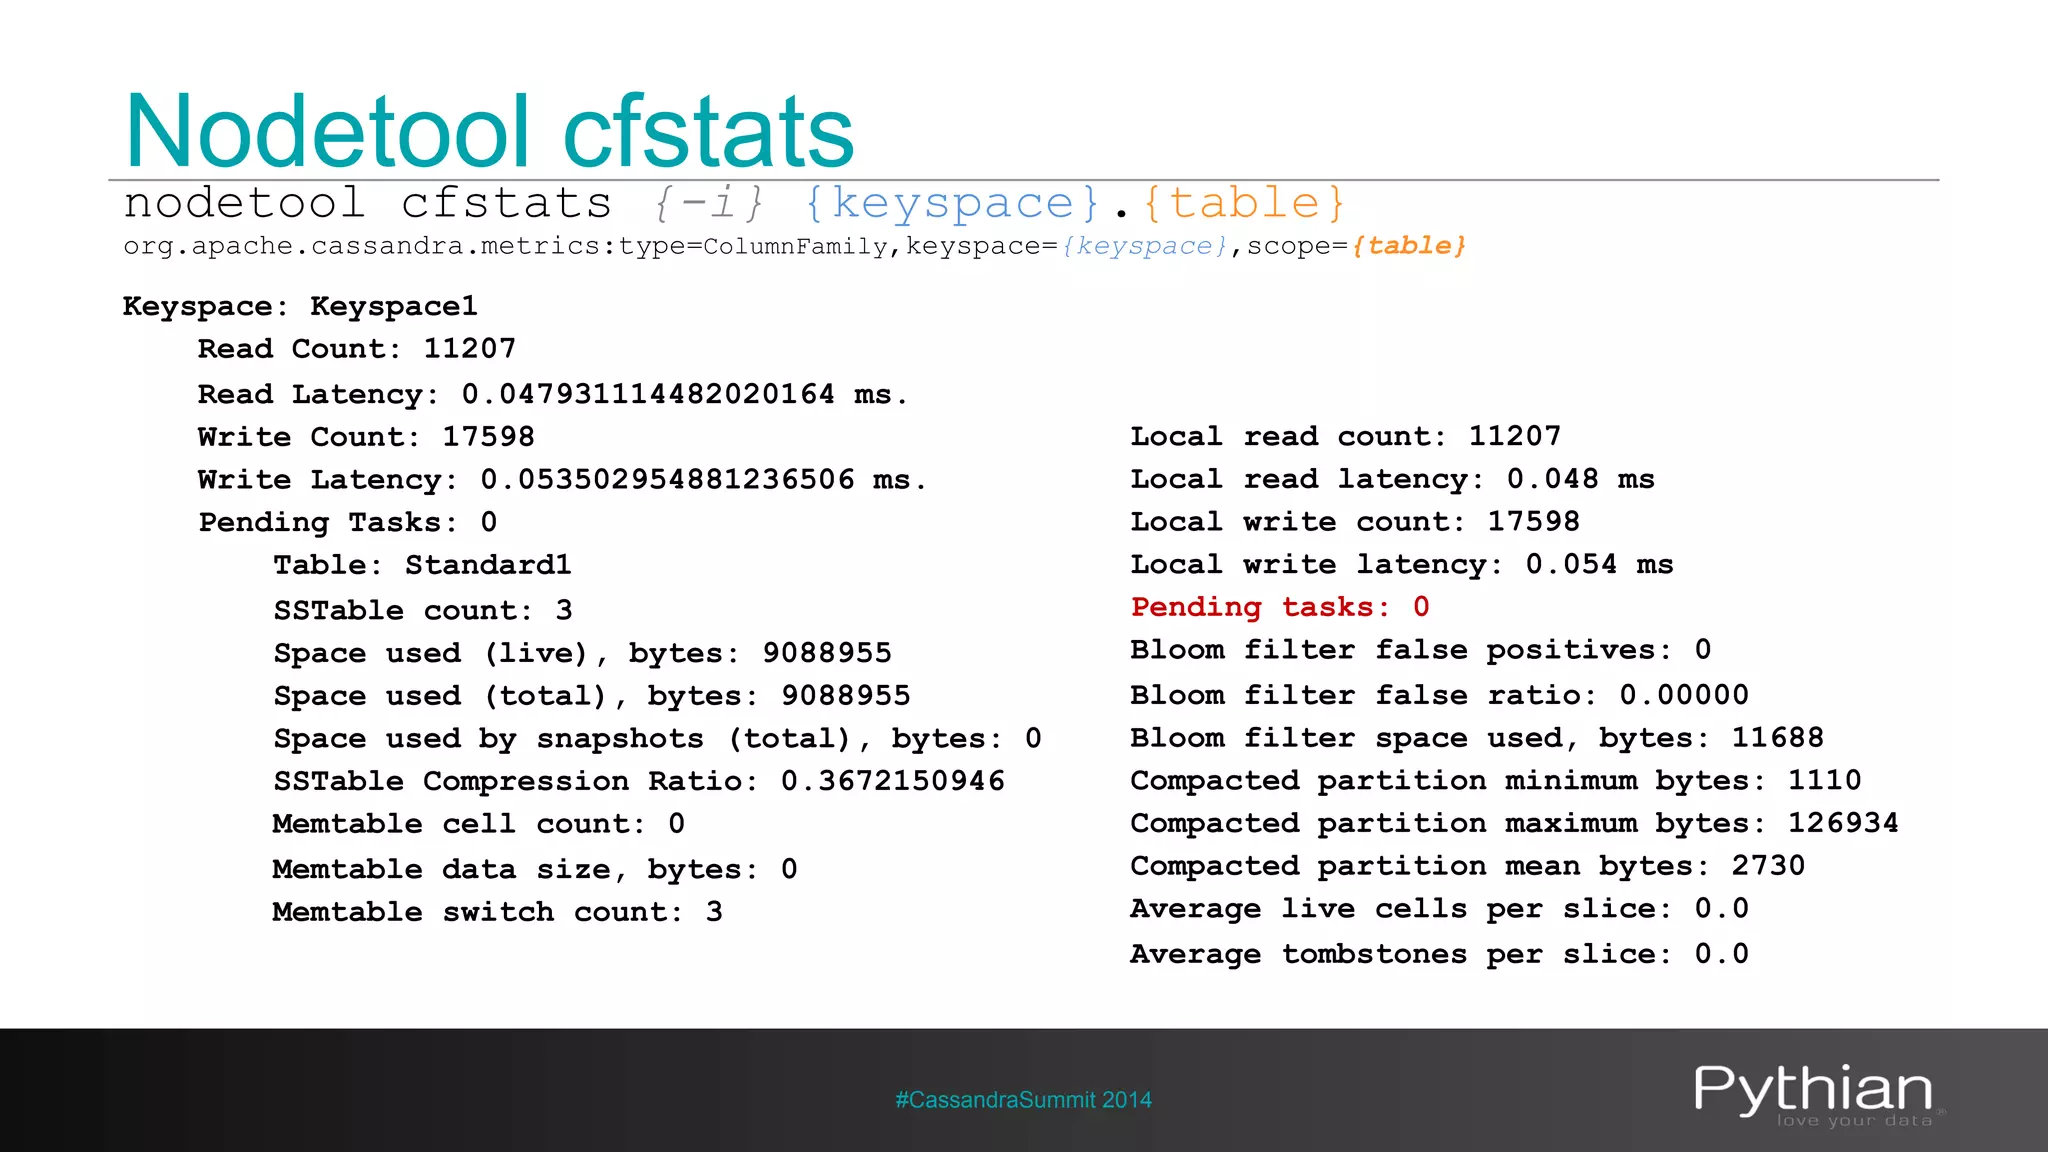
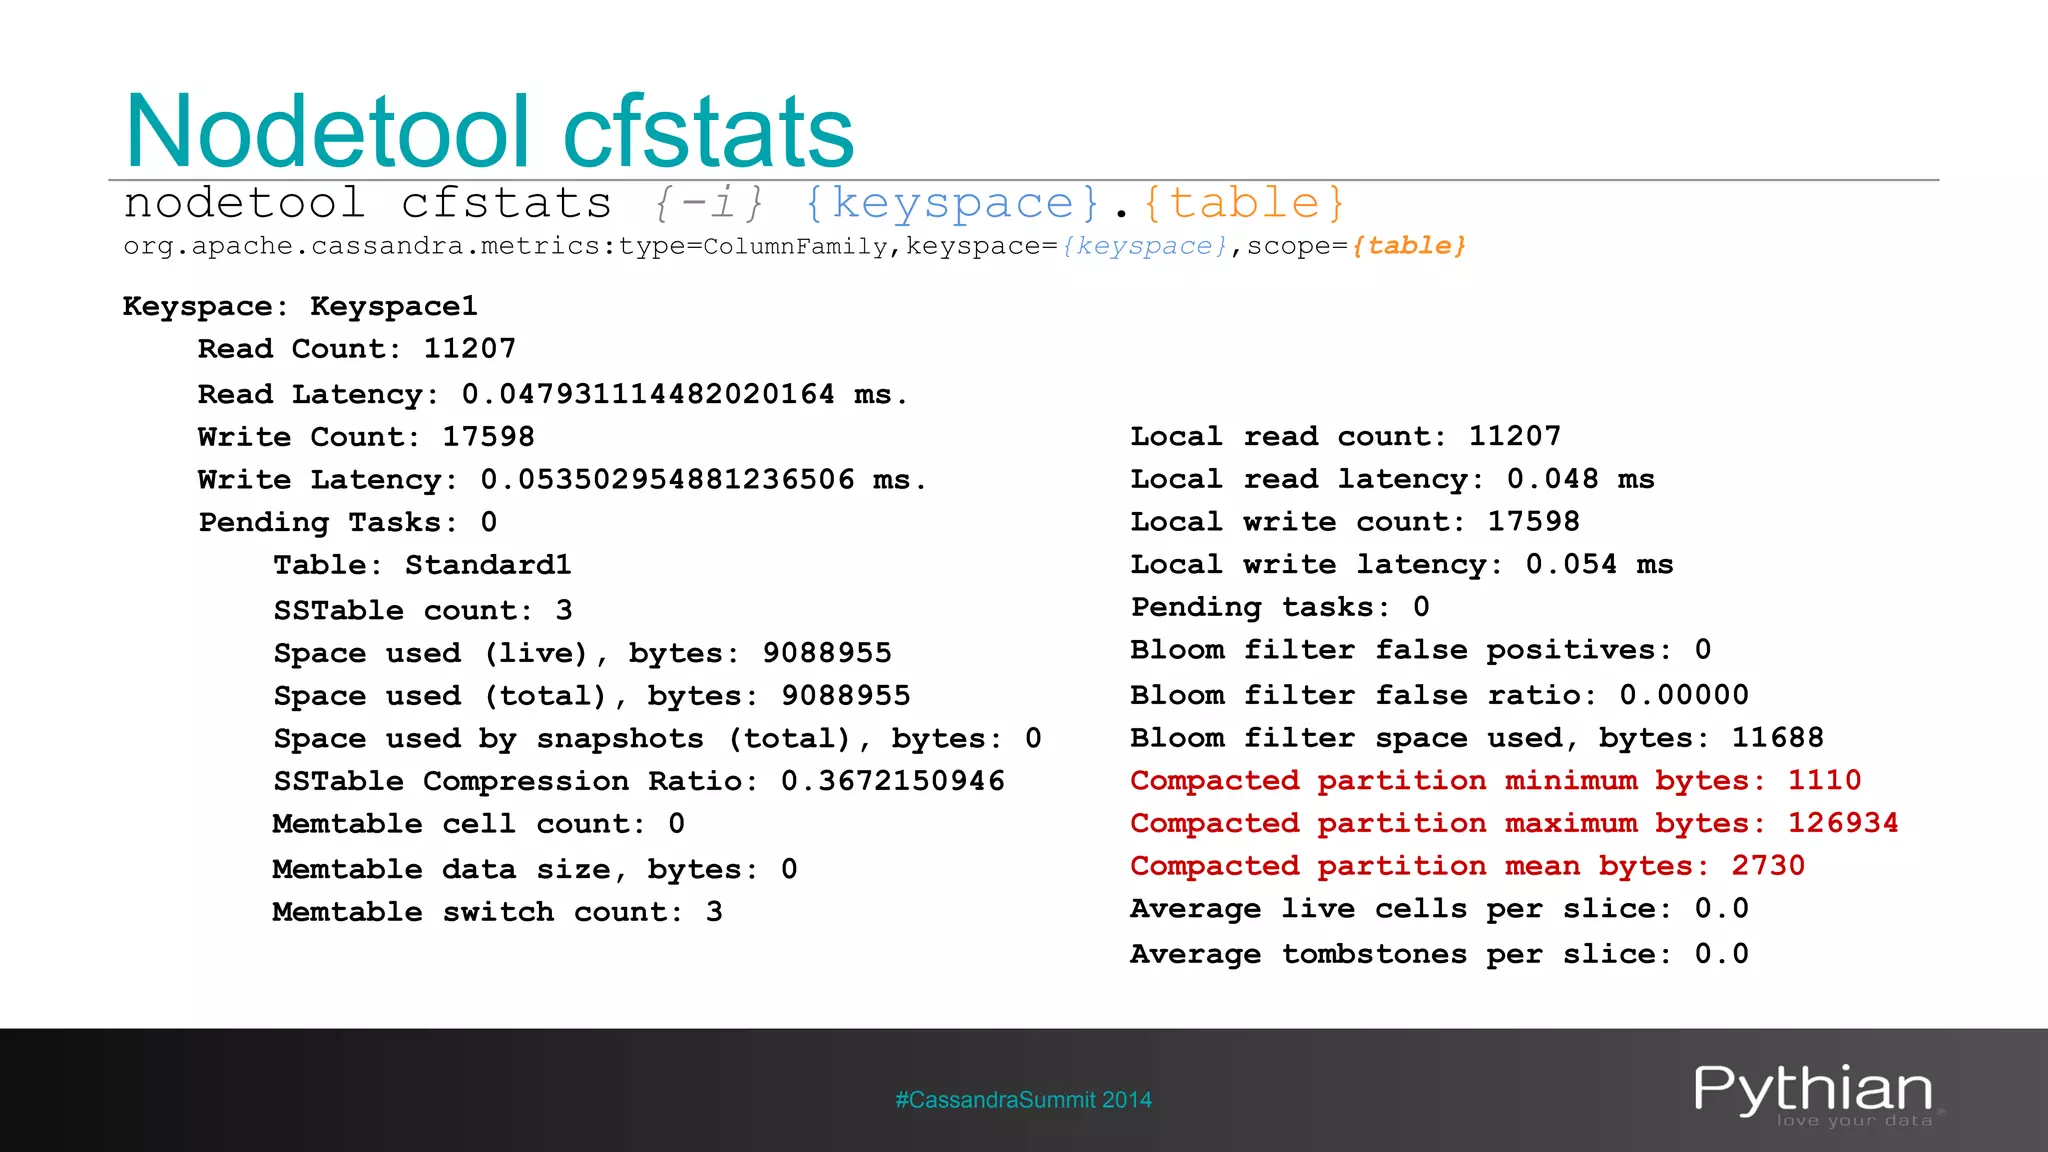
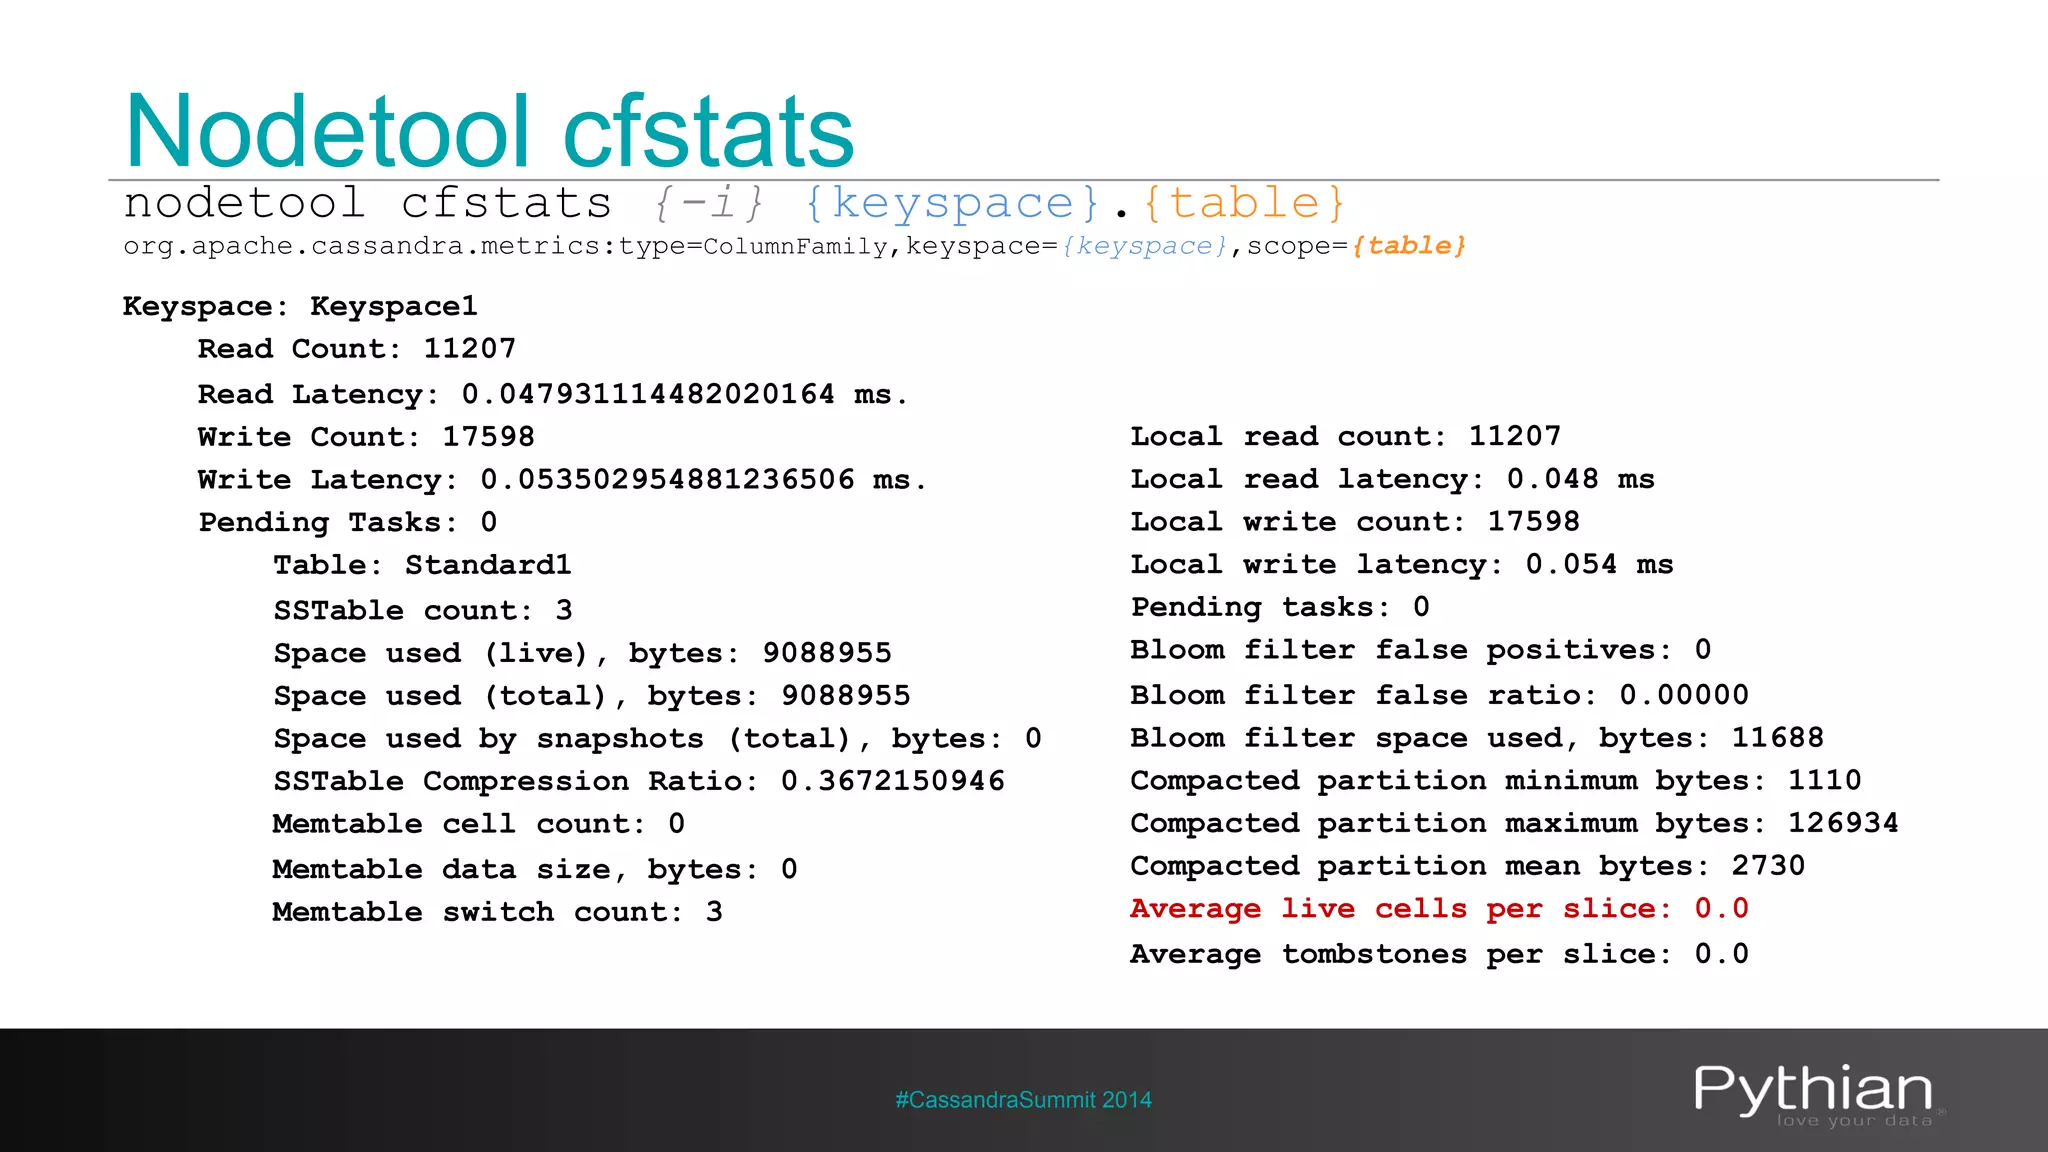
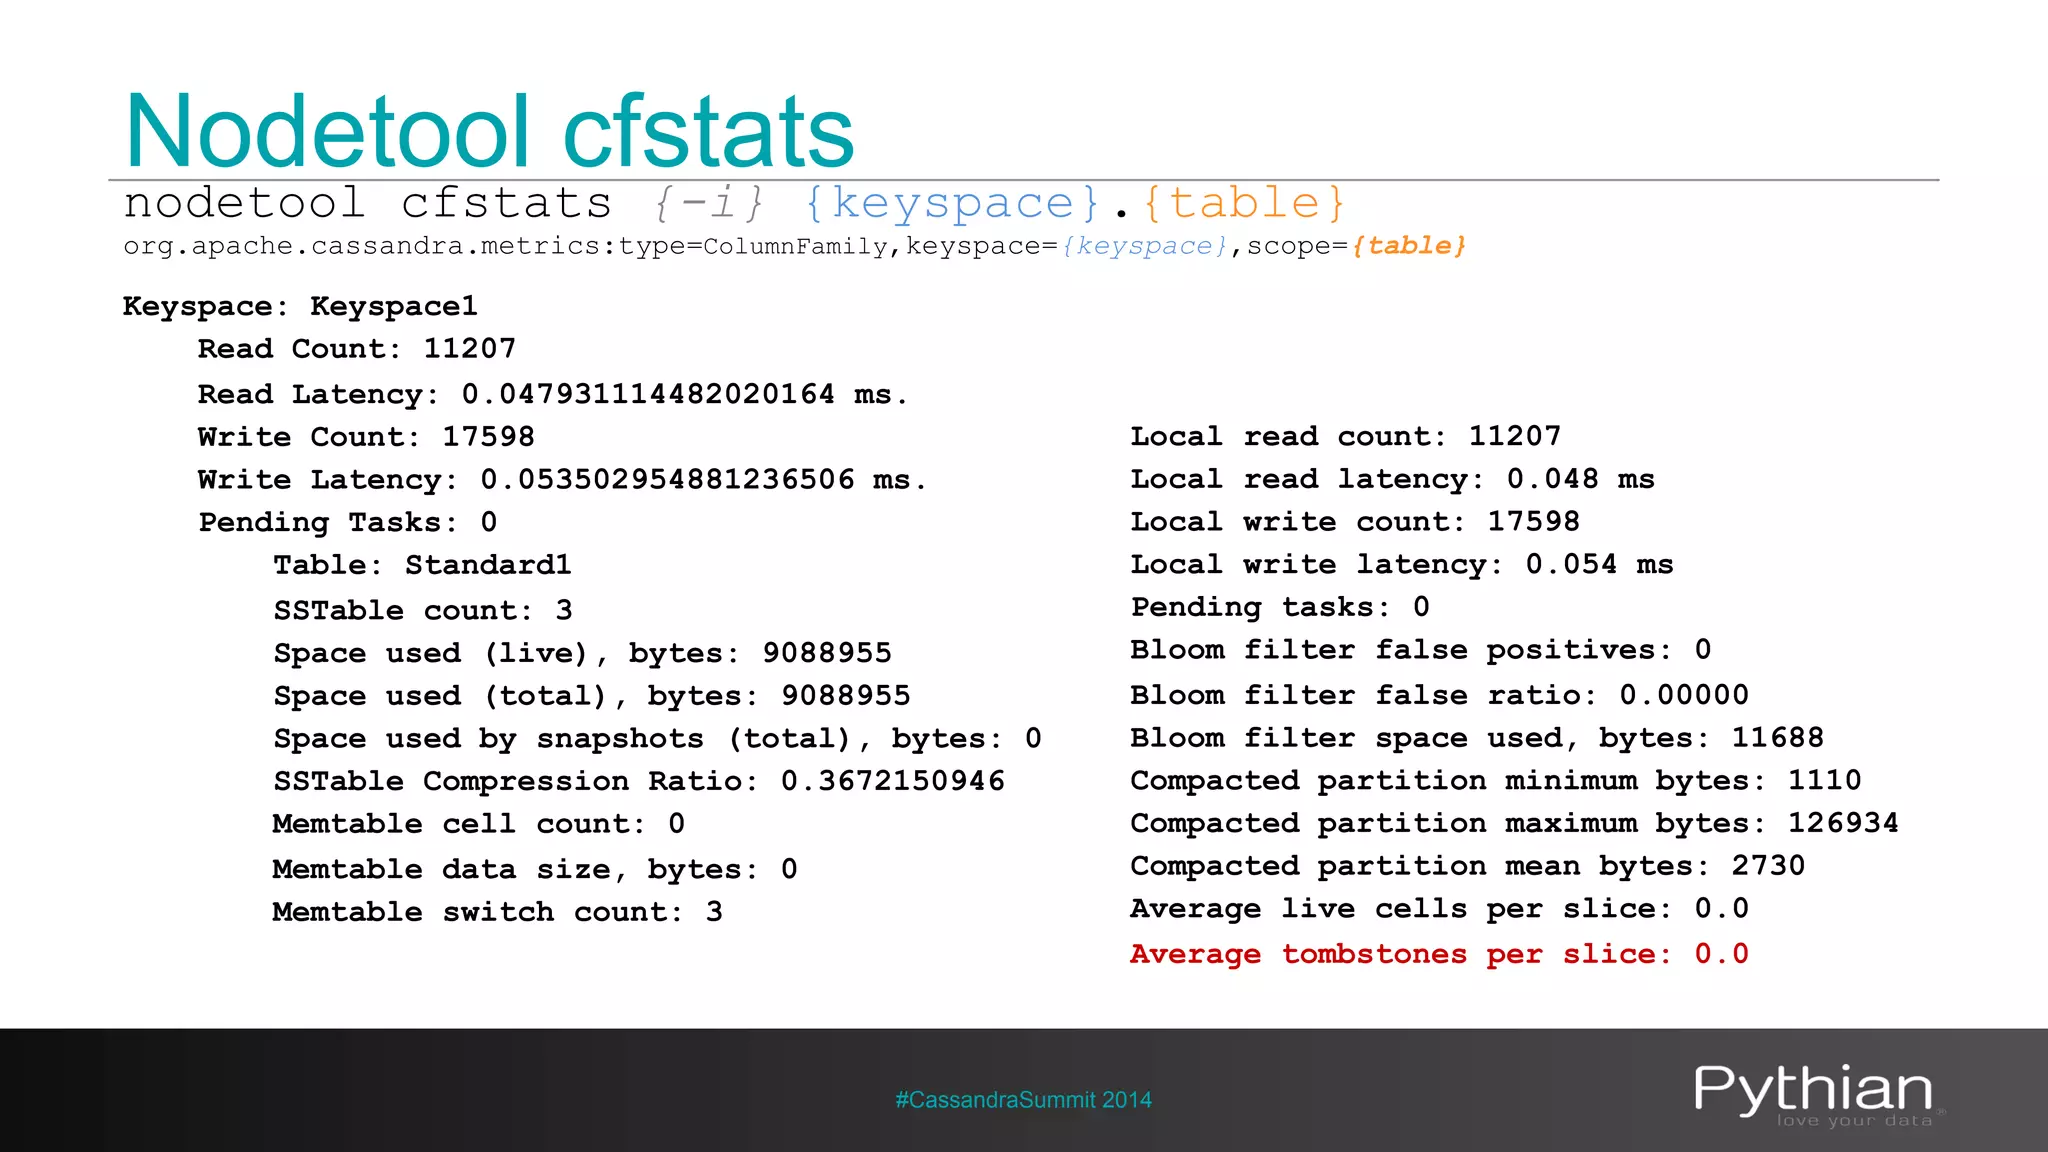
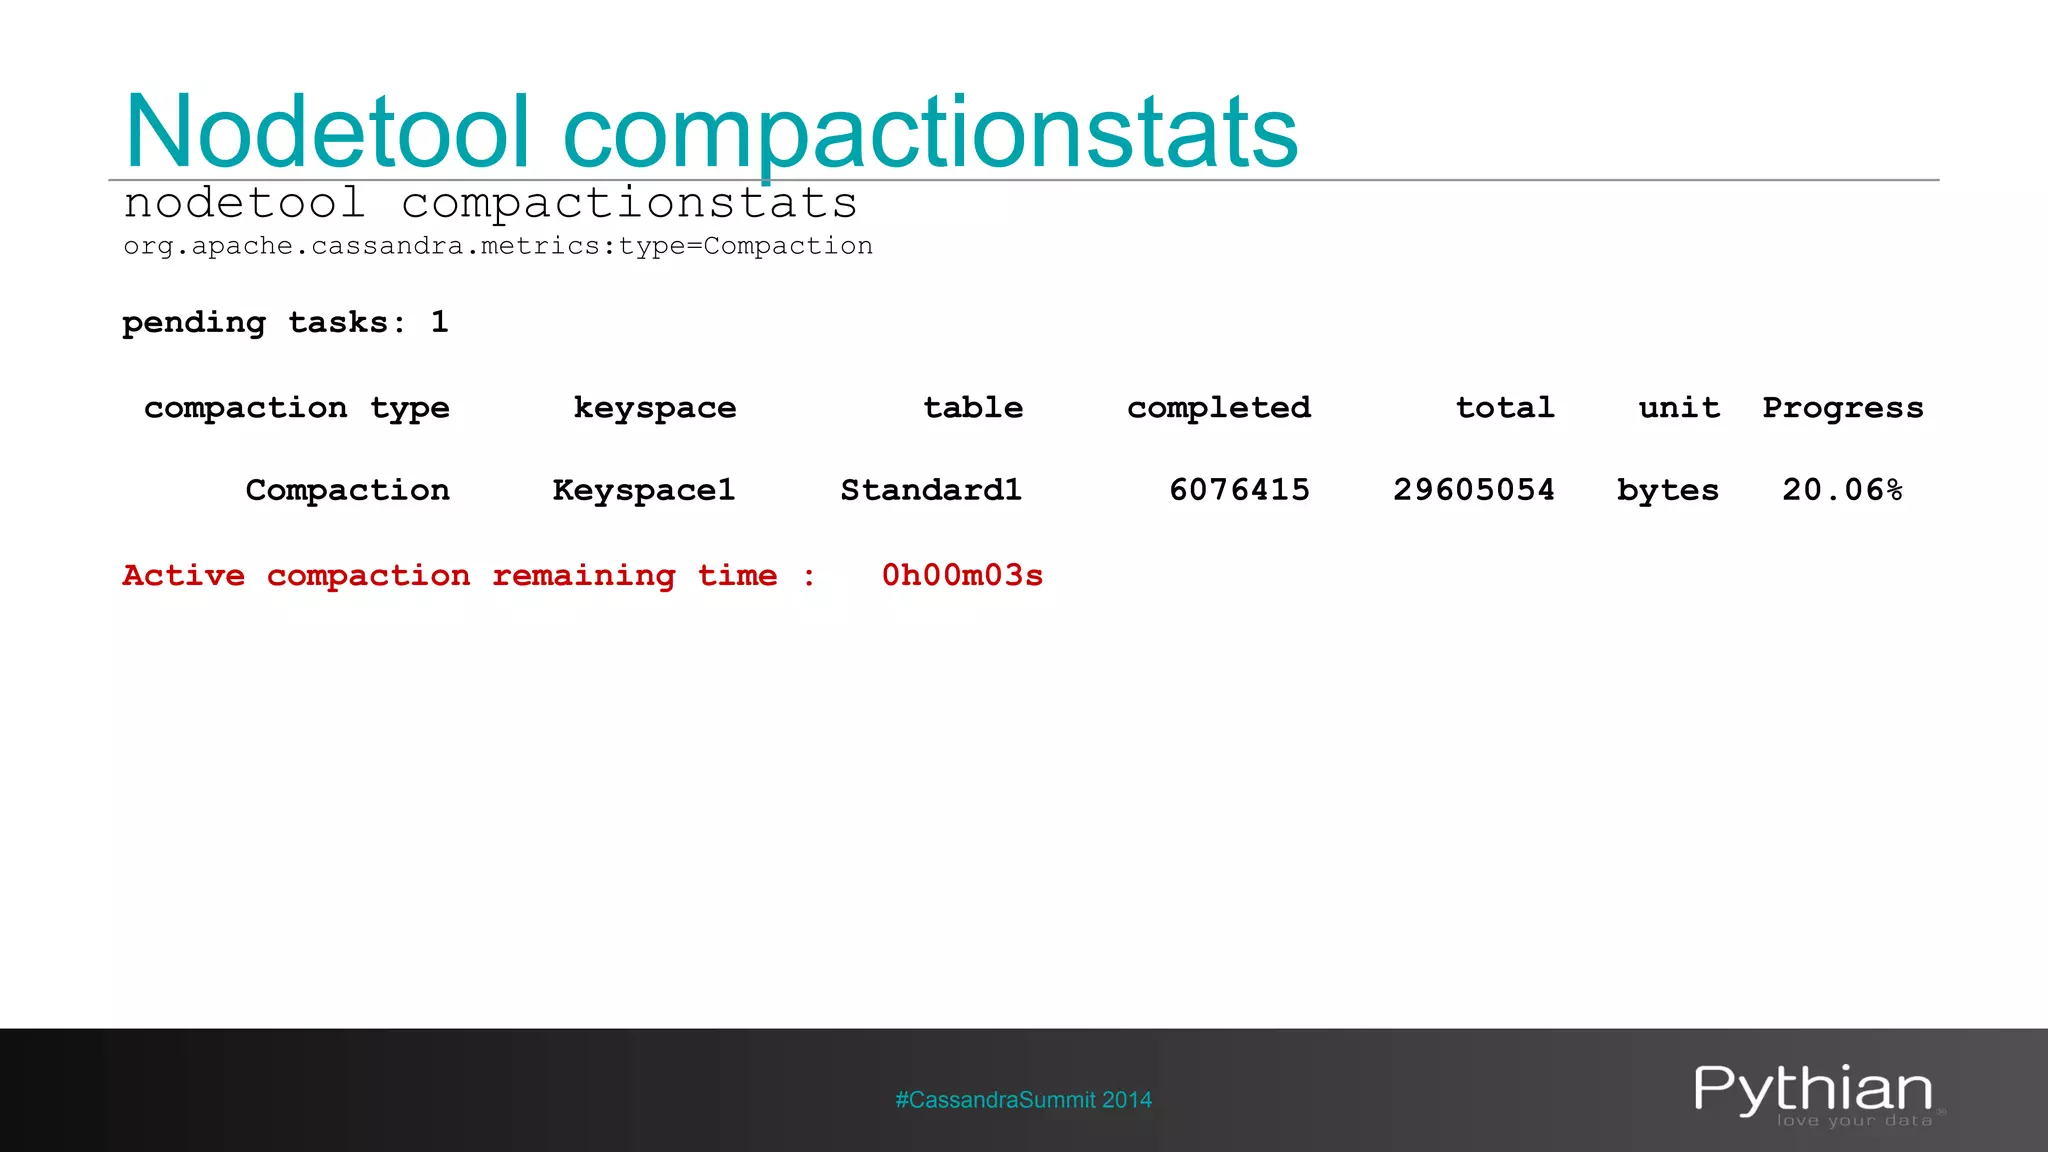
![Nodetool cfstats
nodetool cfstats {-i} {keyspace}.{table}
org.apache.cassandra.metrics:type=ColumnFamily,keyspace={keyspace},scope={table}
Keyspace: Keyspace1
Read Count: 11207
Read Latency: 0.047931114482020164 ms.
Write Count: 17598
Write Latency: 0.053502954881236506 ms.
Pending Tasks: 0
Table: Standard1
SSTable count: 3
SSTables in each level: [14/4, 1, 0, …, 0]
Space used (live), bytes: 9088955
Space used (total), bytes: 9088955
Space used by snapshots (total), bytes: 0
SSTable Compression Ratio: 0.3672150946
Memtable cell count: 0
Memtable data size, bytes: 0
Memtable switch count: 3
Local read count: 11207
Local read latency: 0.048 ms
Local write count: 17598
Local write latency: 0.054 ms
Pending tasks: 0
Bloom filter false positives: 0
Bloom filter false ratio: 0.00000
Bloom filter space used, bytes: 11688
Compacted partition minimum bytes: 1110
Compacted partition maximum bytes: 126934
Compacted partition mean bytes: 2730
Average live cells per slice: 0.0
Average tombstones per slice: 0.0
#CassandraSummit 2014](https://image.slidesharecdn.com/chrislohfinkblackbirdio-140929192436-phpapp02/75/Cassandra-Summit-2014-Monitor-Everything-55-2048.jpg)


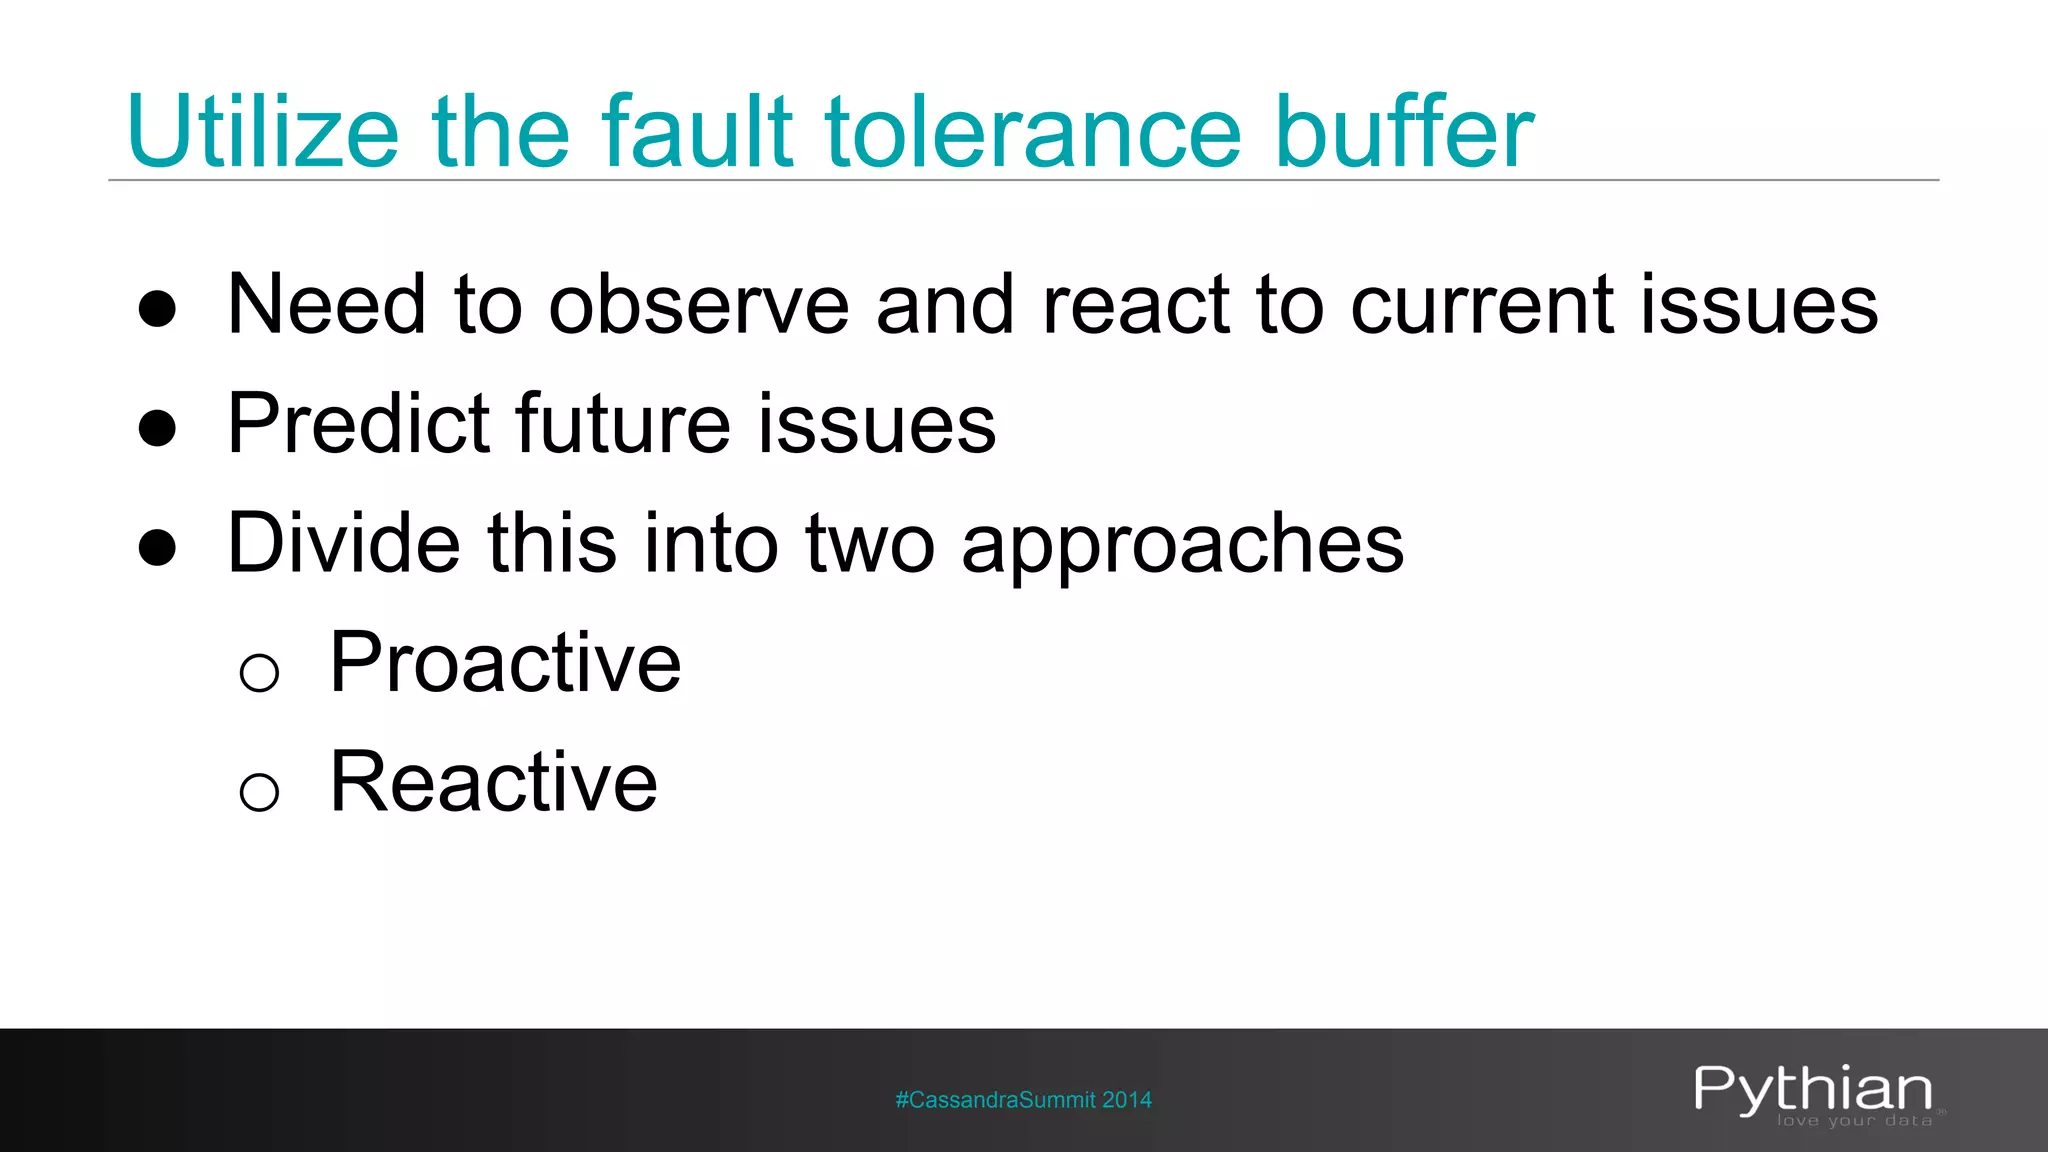
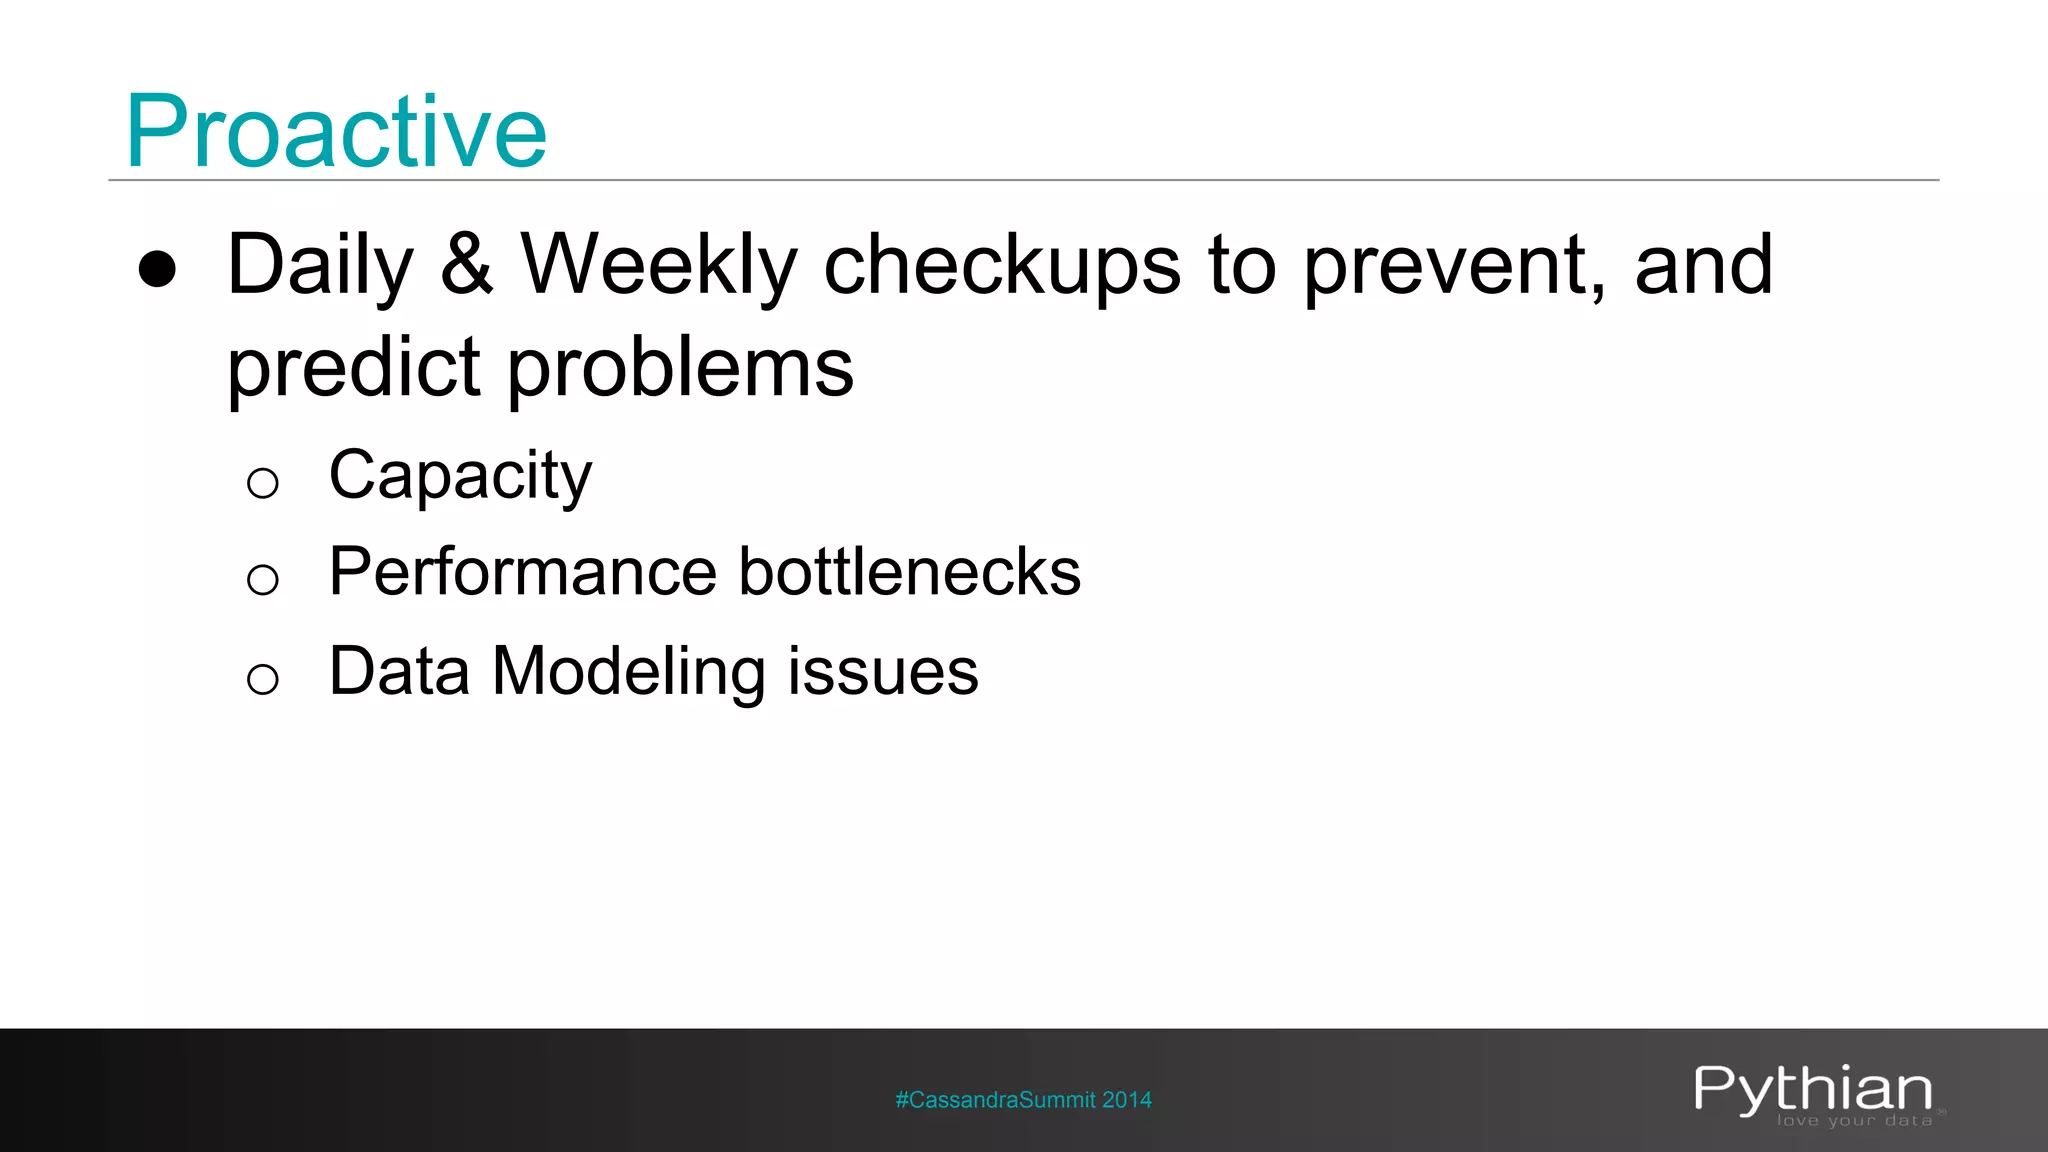
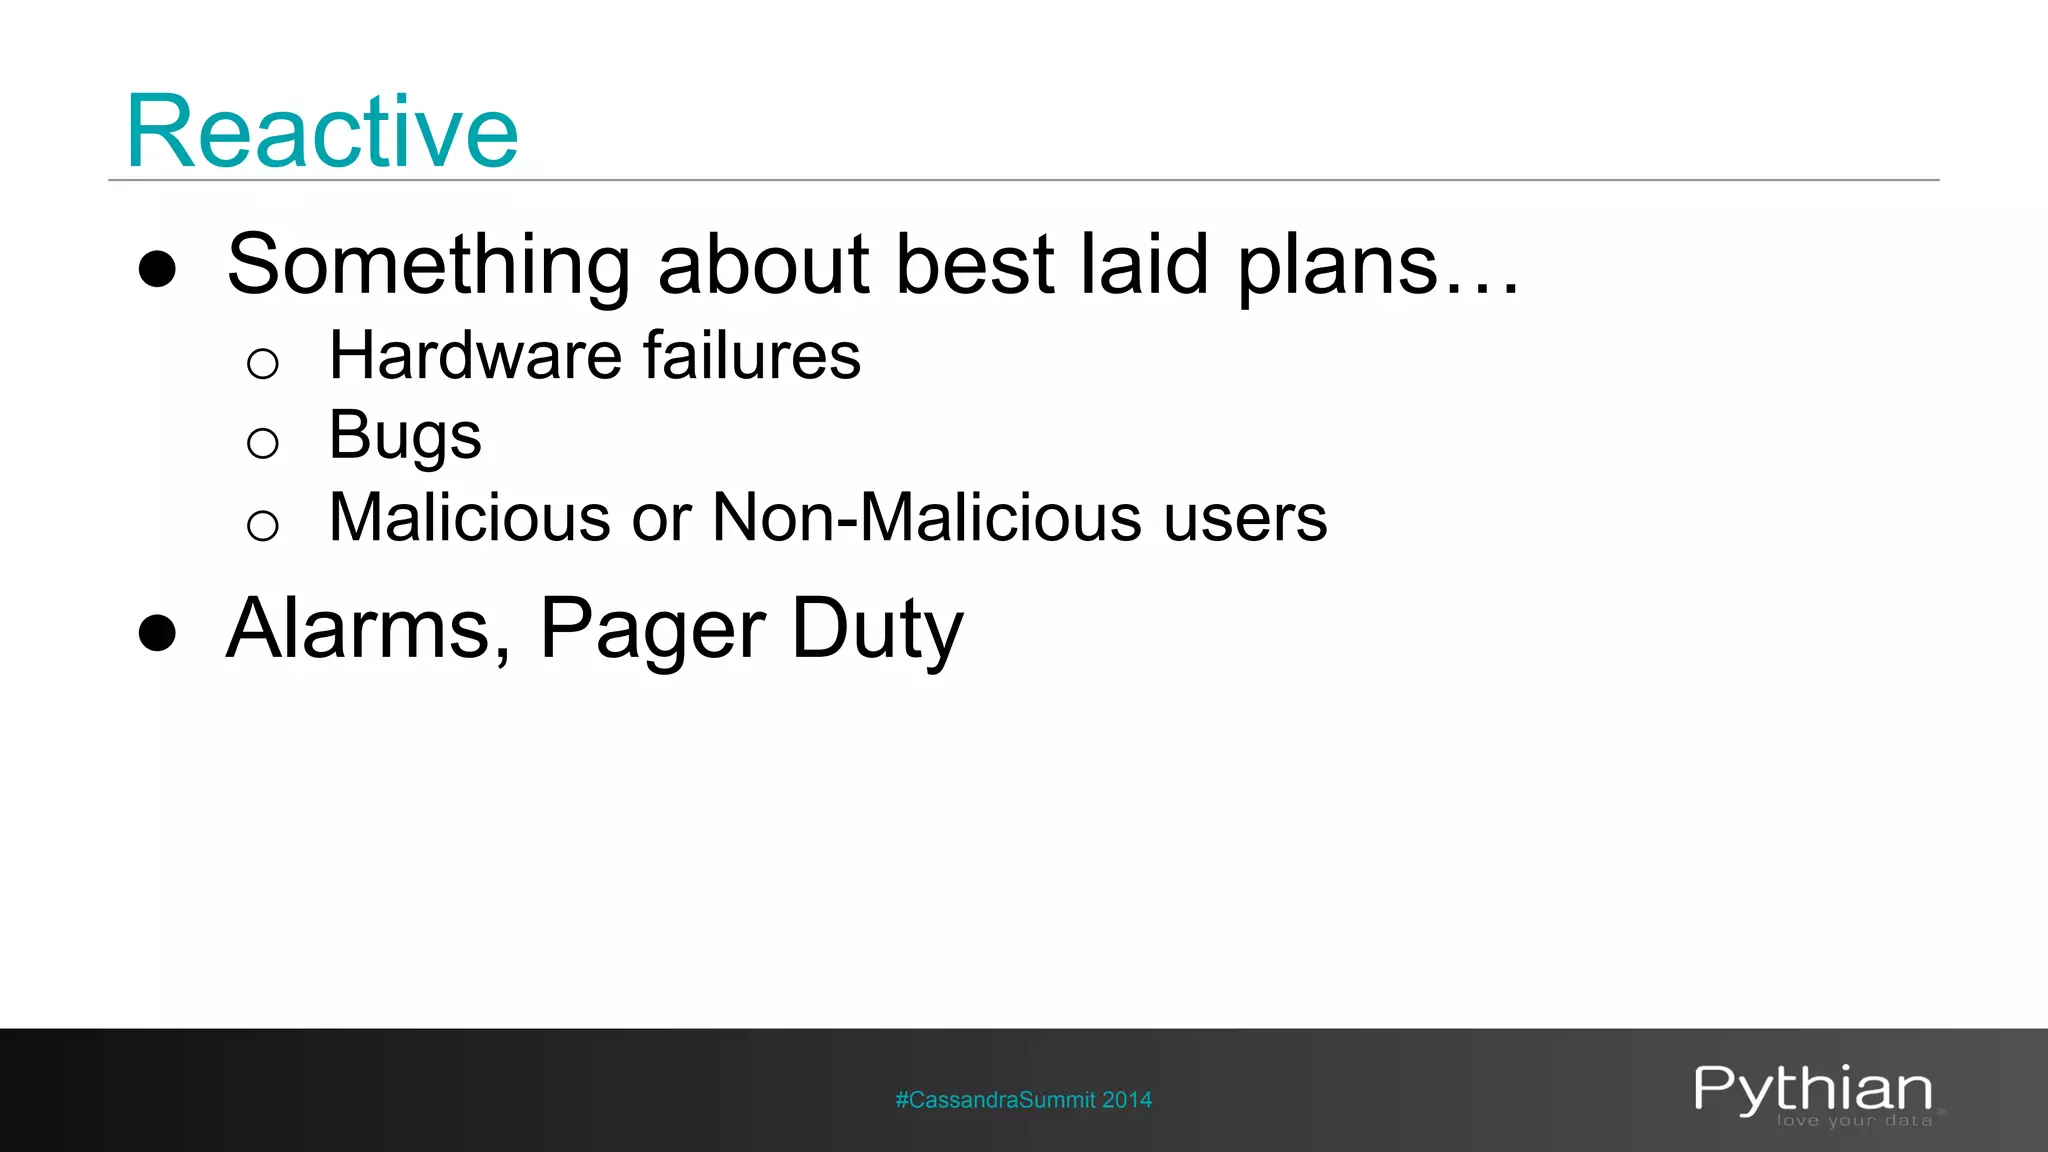
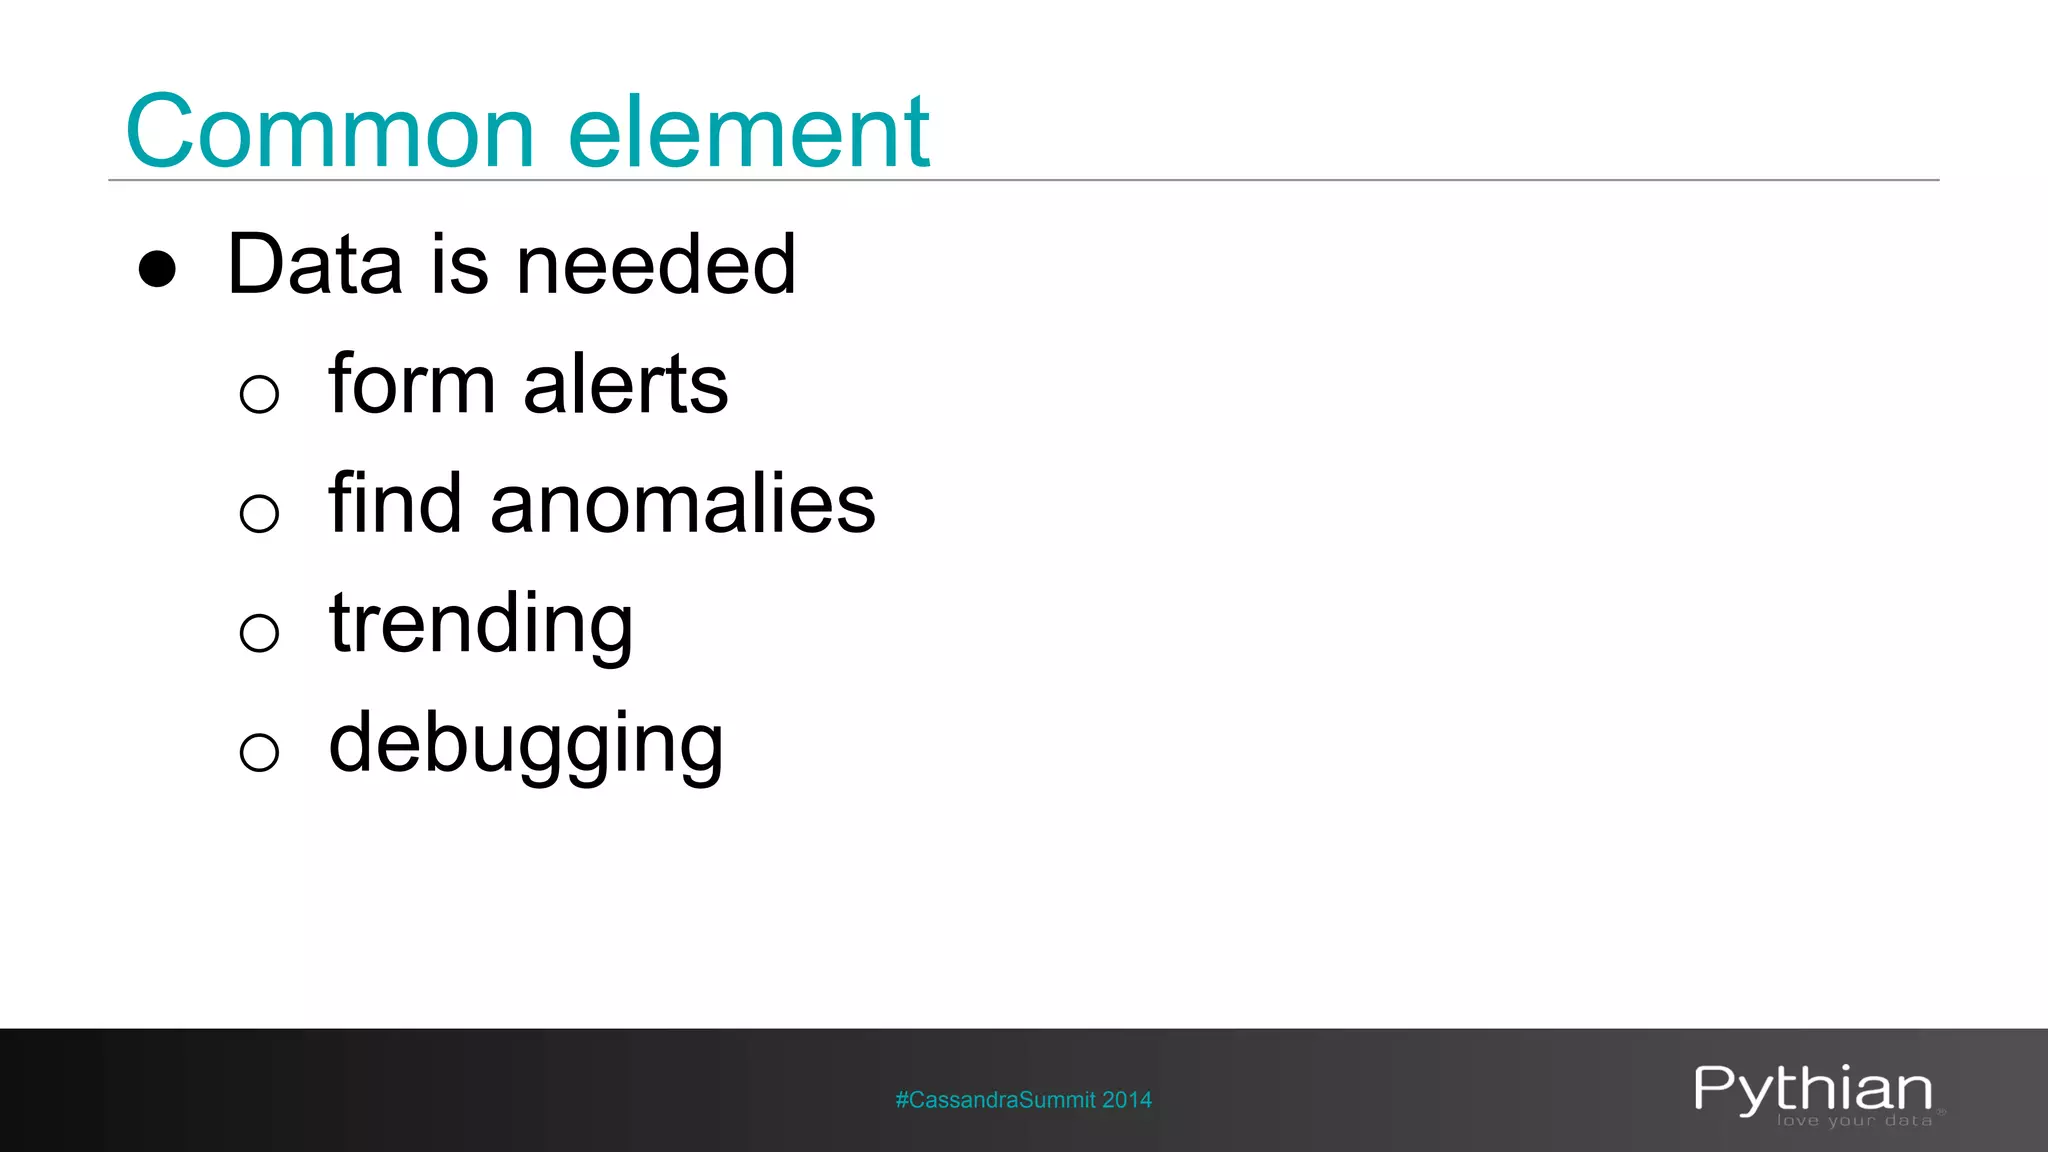
The document outlines the role of a senior engineer at Pythian, a global data outsourcing company specializing in data systems management. It discusses key practices for monitoring and maintaining Cassandra databases, emphasizing proactive and reactive strategies for handling issues in data infrastructures. Additionally, it highlights the importance of metrics and tools such as JMX and nodetool in assessing system performance and diagnosing potential problems.