Download as PDF, PPTX


![Nicolas Favre-Felix – Cassandra London July 2013
Data model 1
• One row per (sensor, day)
• Metrics columns grouped by minute within the row
• Range queries between minutes A and B within a day
CREATE TABLE sensor_data (
sensor_id text,
day integer,
hour integer,
minute integer,
metric1 integer,
[...]
metric40 integer,
PRIMARY KEY ((sensor_id, day), minute);
31](https://image.slidesharecdn.com/cassandrainternals-solvingproblems-130711175120-phpapp02/85/Understanding-Cassandra-internals-to-solve-real-world-problems-31-320.jpg)


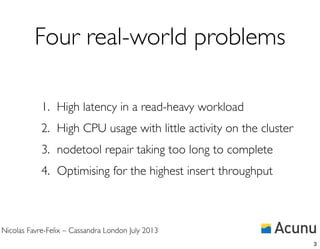
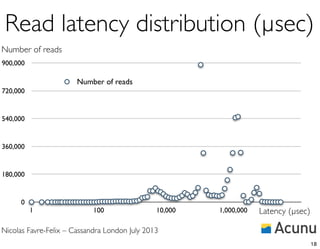
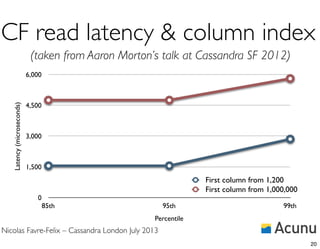
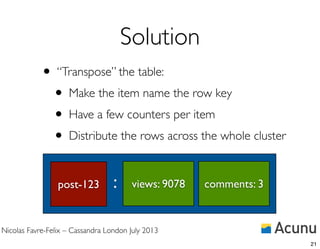
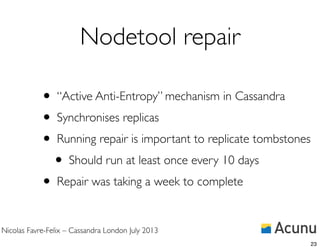
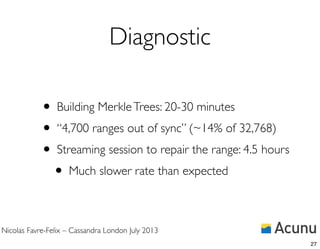
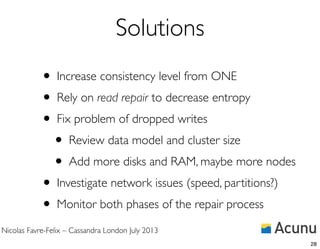
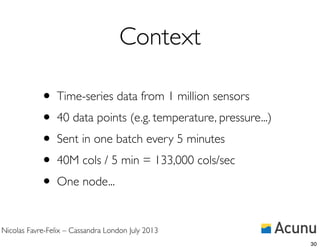
The document summarizes Nicolas Favre-Felix's presentation on Cassandra internals at a Cassandra London meetup. It discusses four common problems encountered with Cassandra - high read latency, high CPU usage with little activity, long nodetool repair times, and optimizing write throughput. For each problem, it describes symptoms, analysis using tools like nodetool, and solutions like adjusting the data model, increasing thread pool sizes, and adding hardware resources. The key takeaways are that monitoring Cassandra is important, using the right data model impacts performance, and understanding how Cassandra stores and arranges data on disk is essential to optimization.