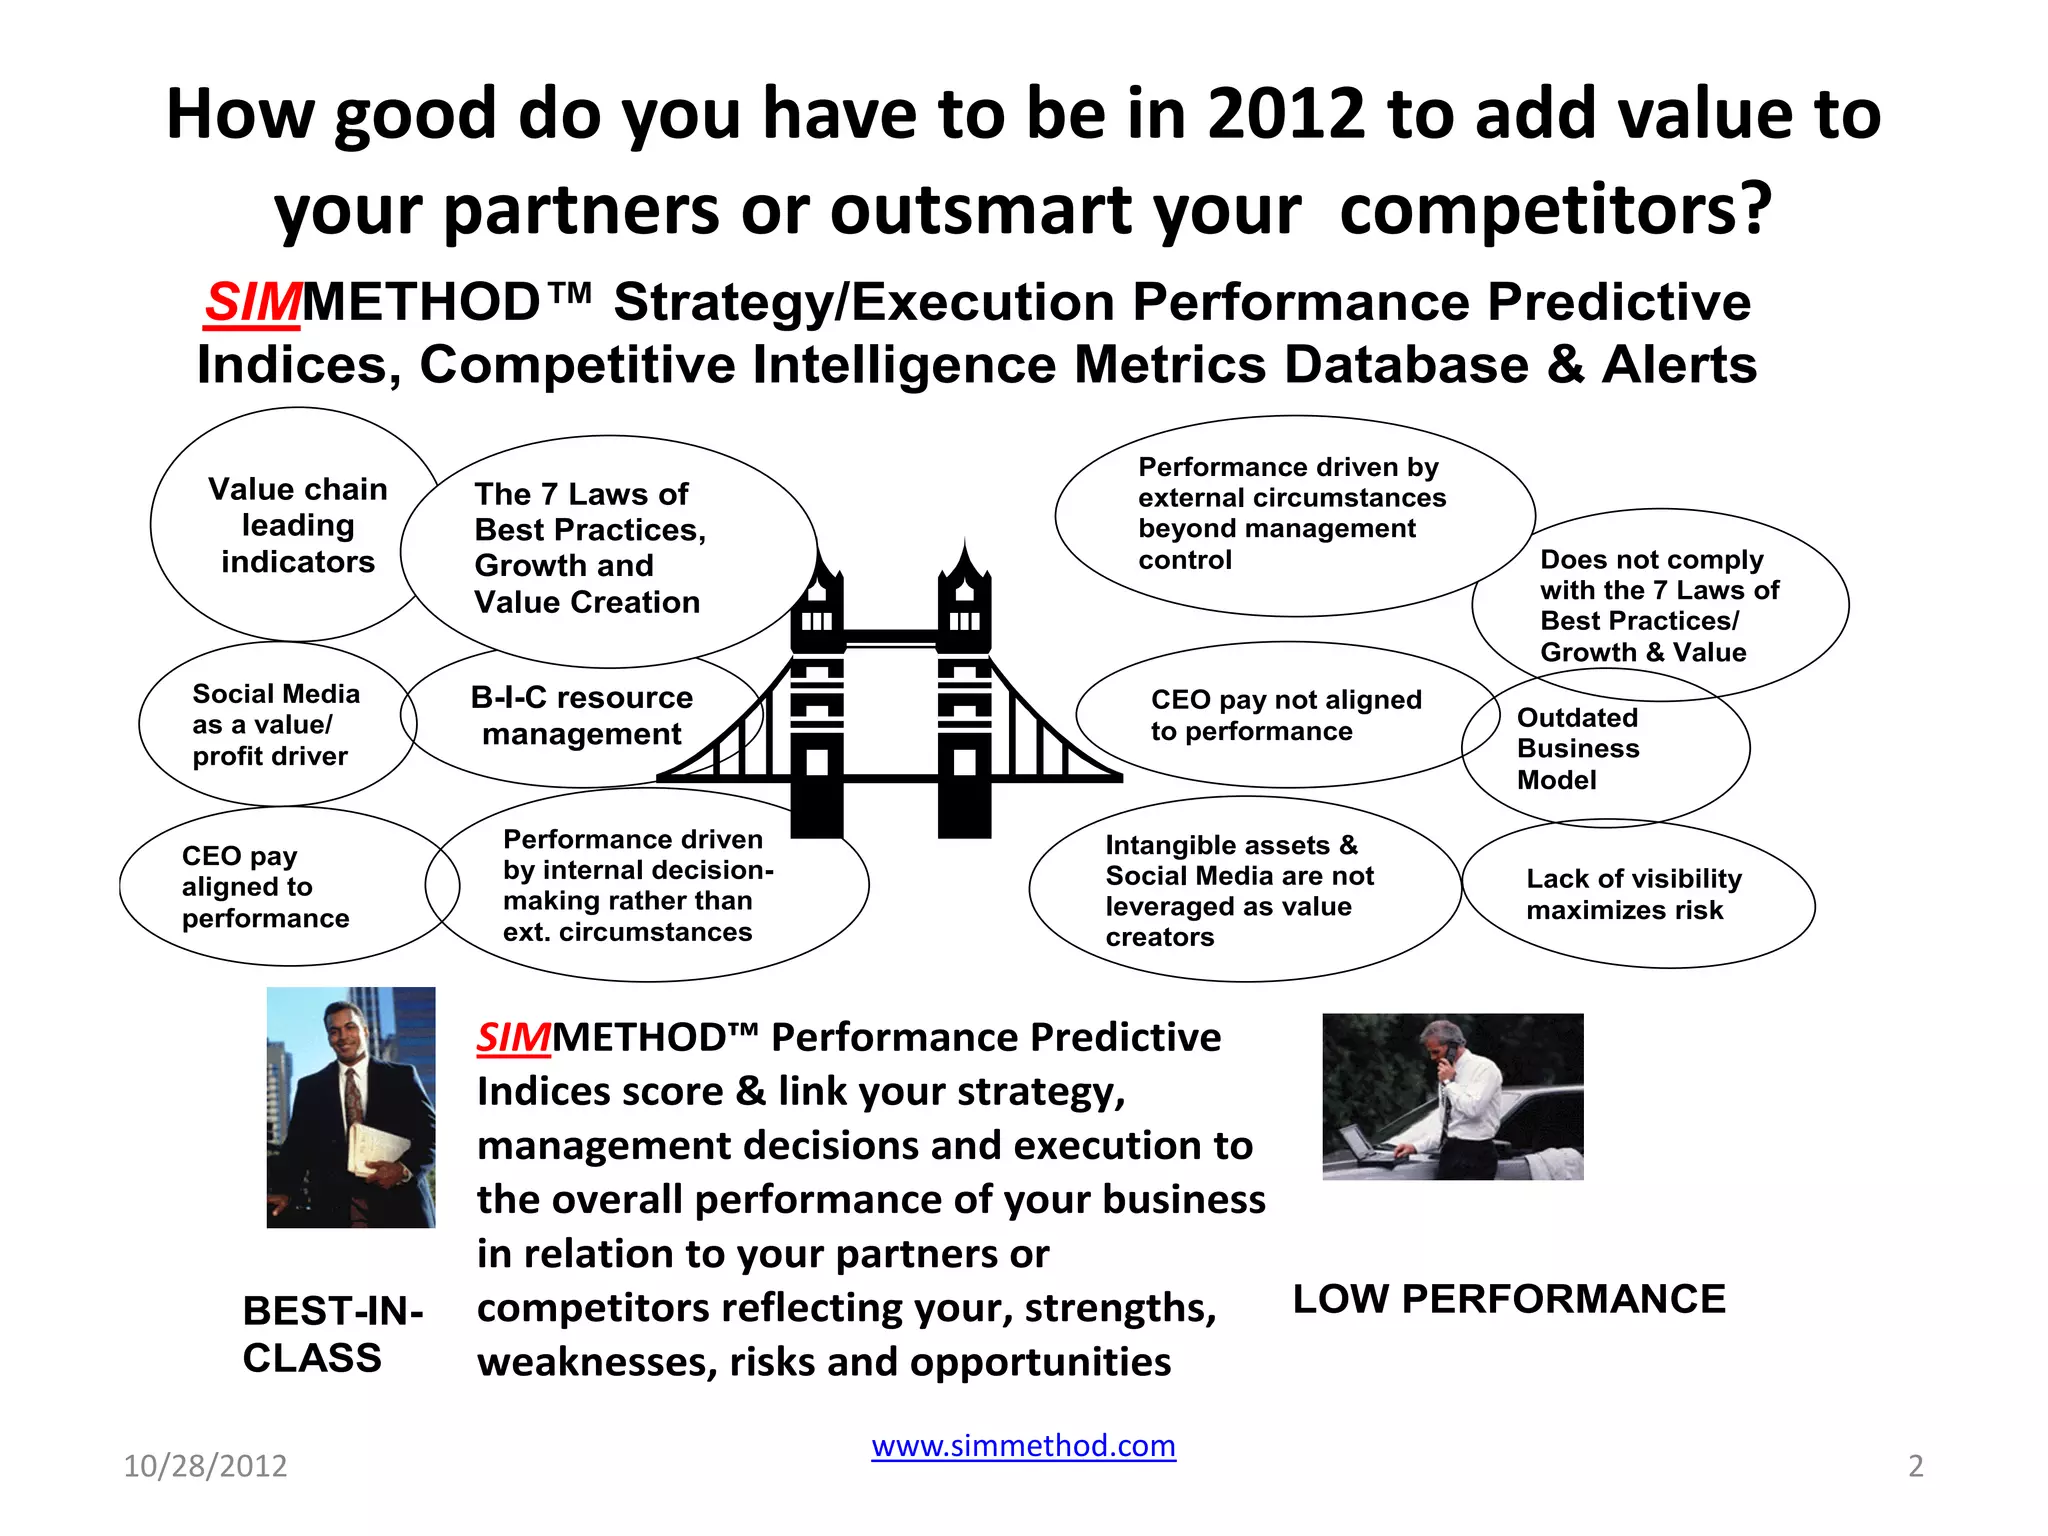
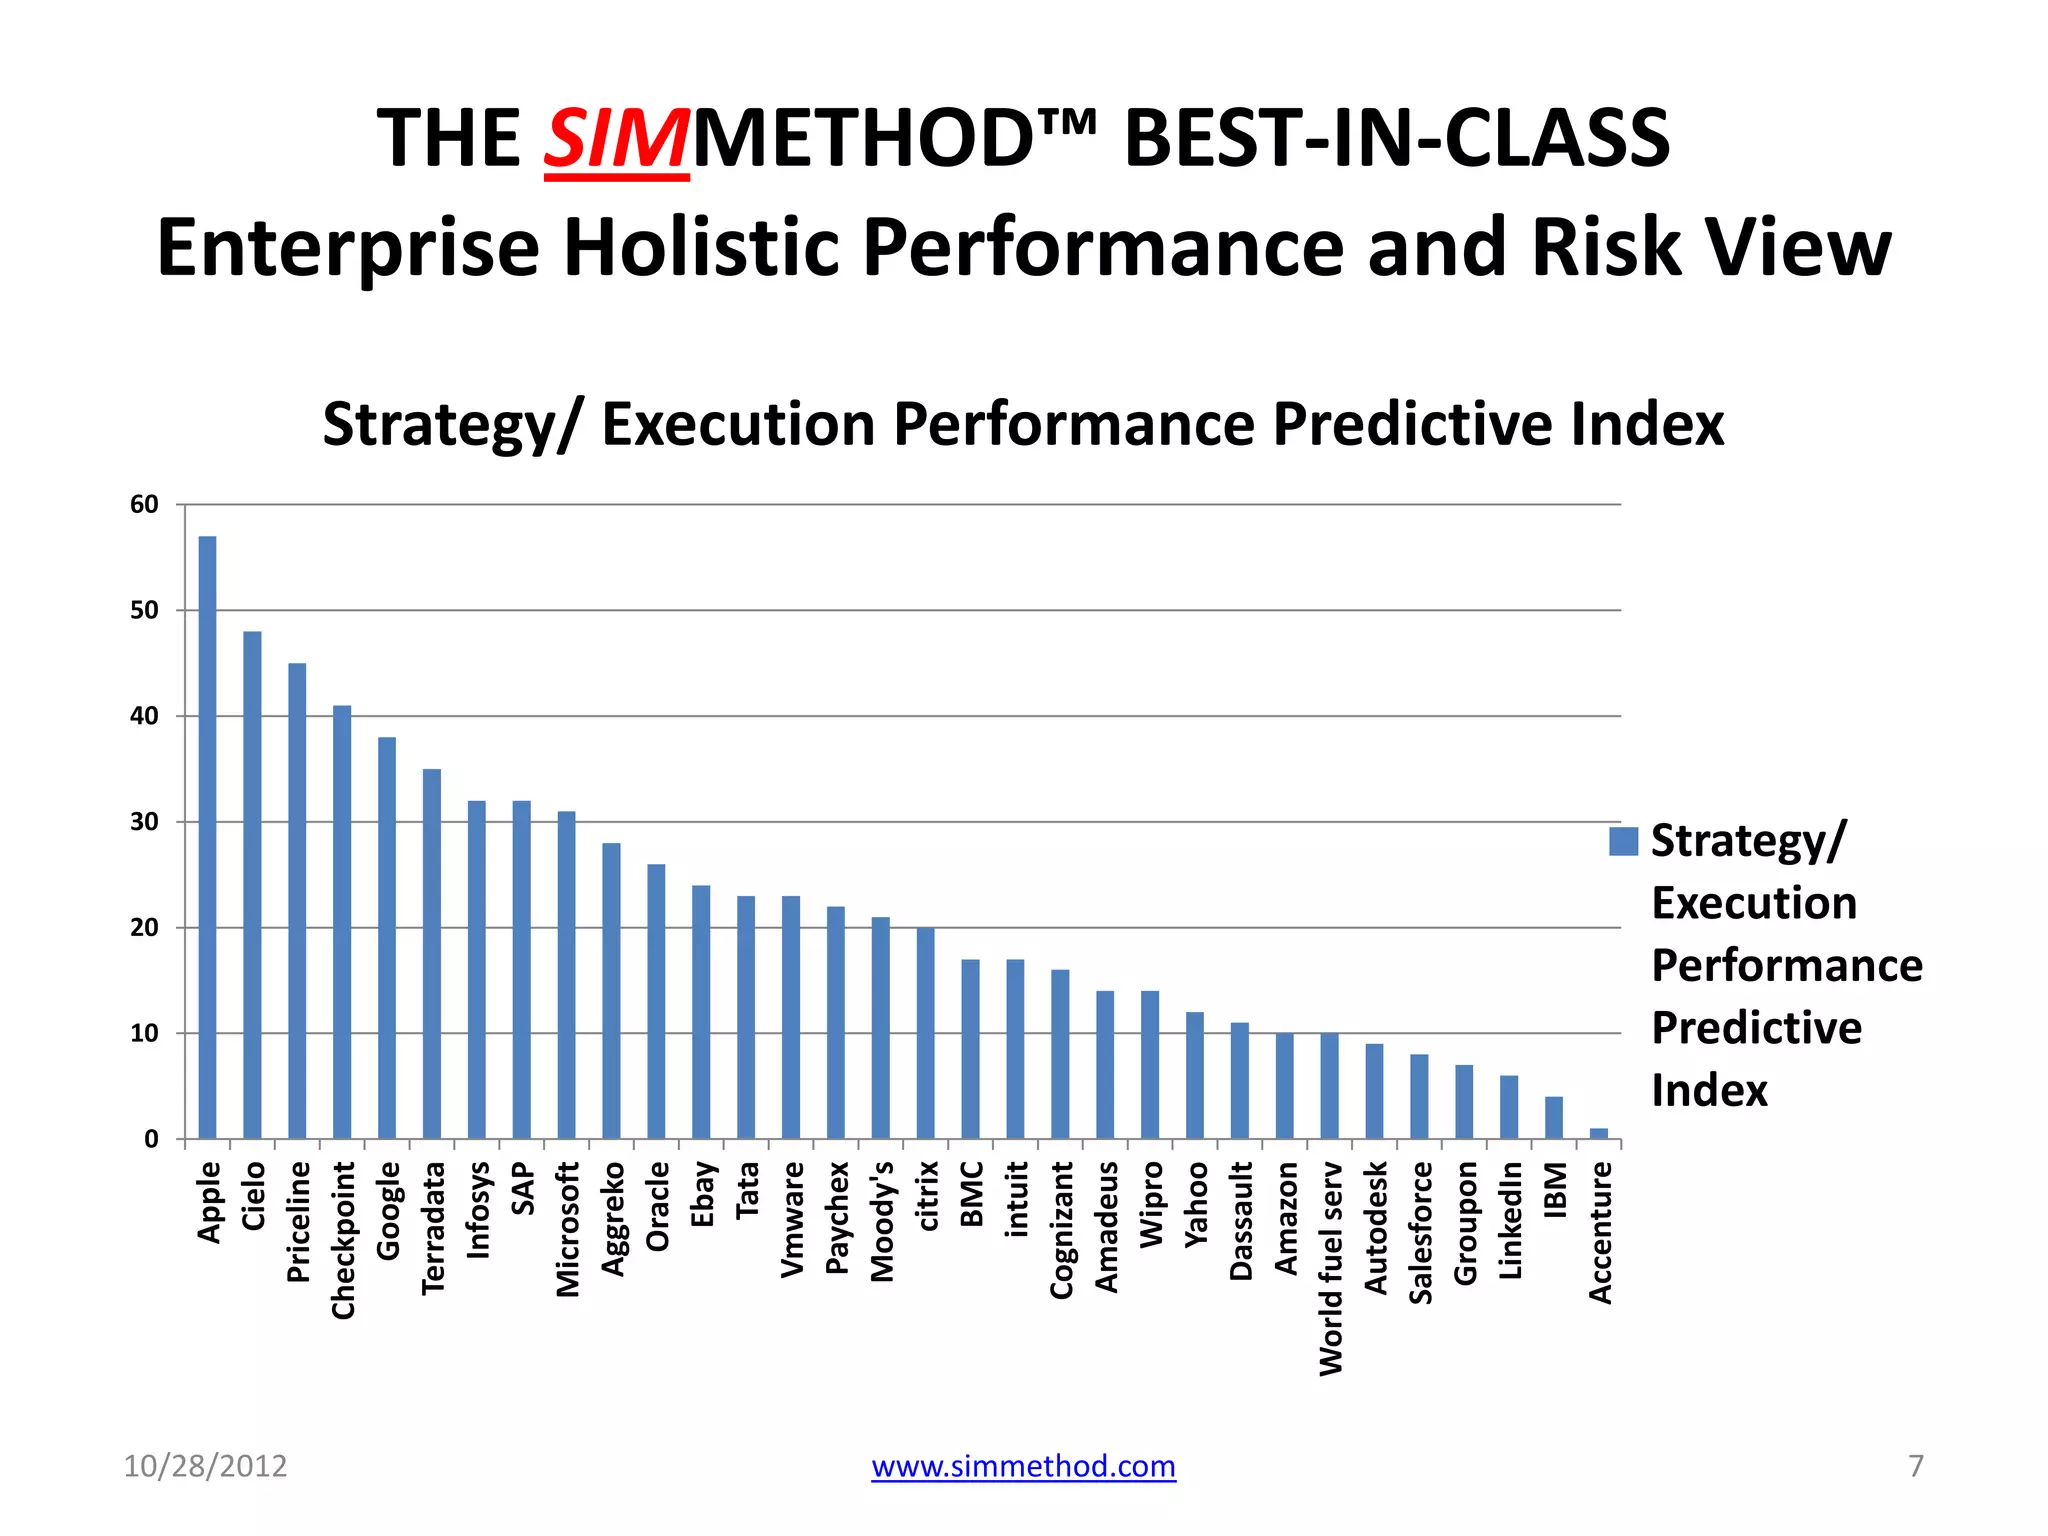
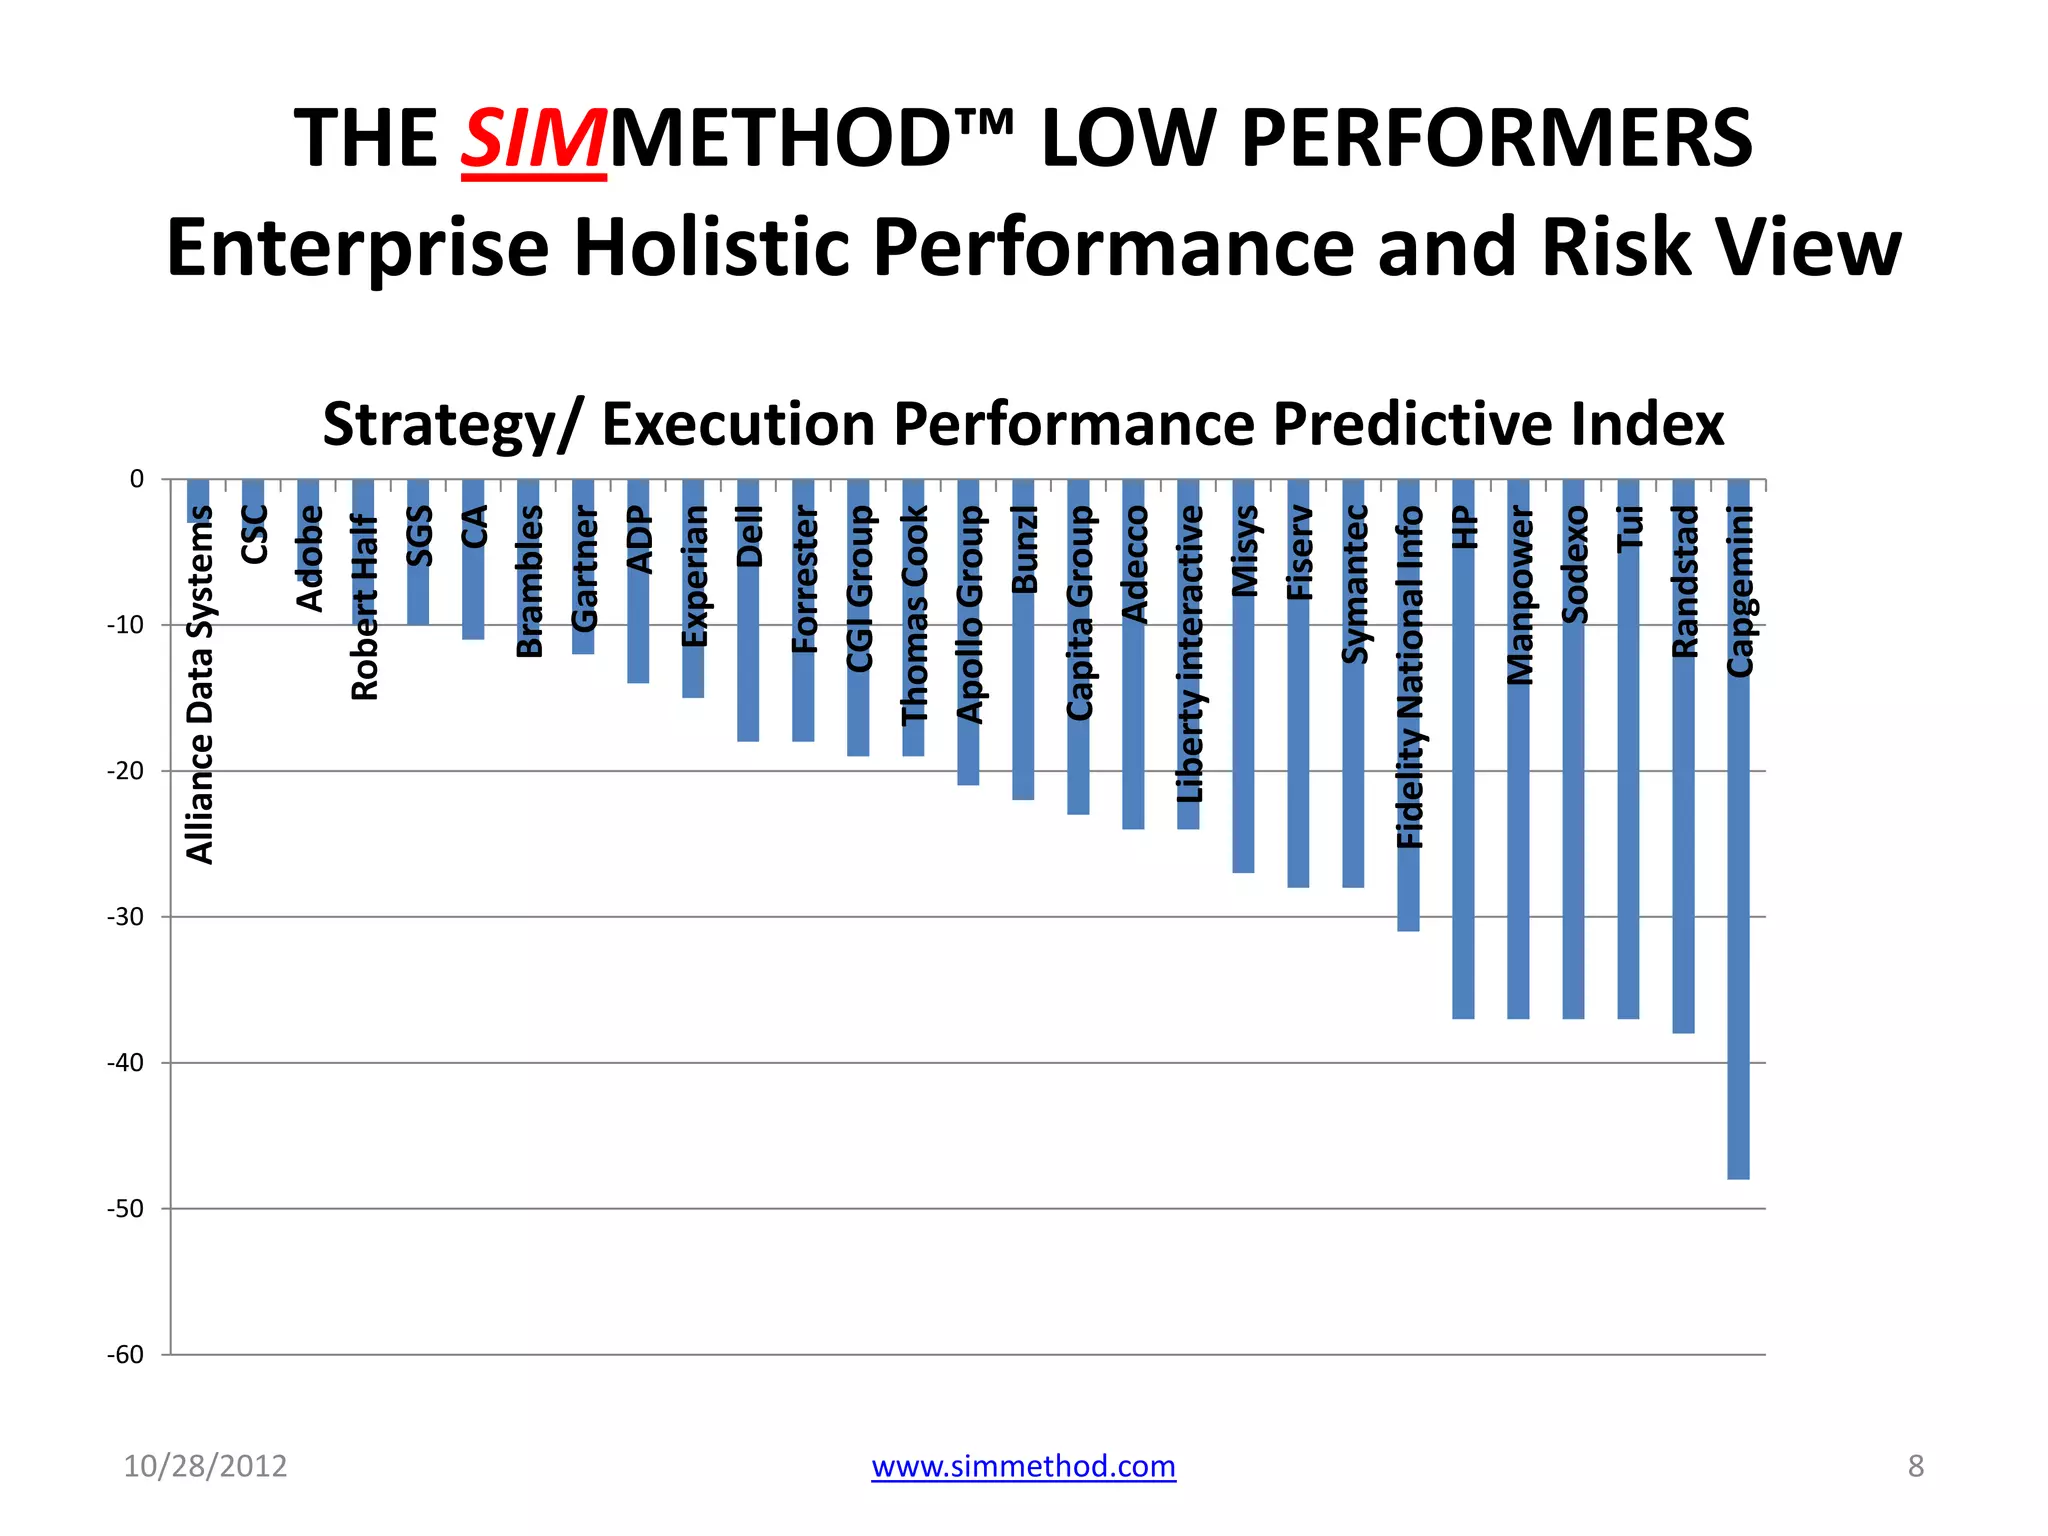
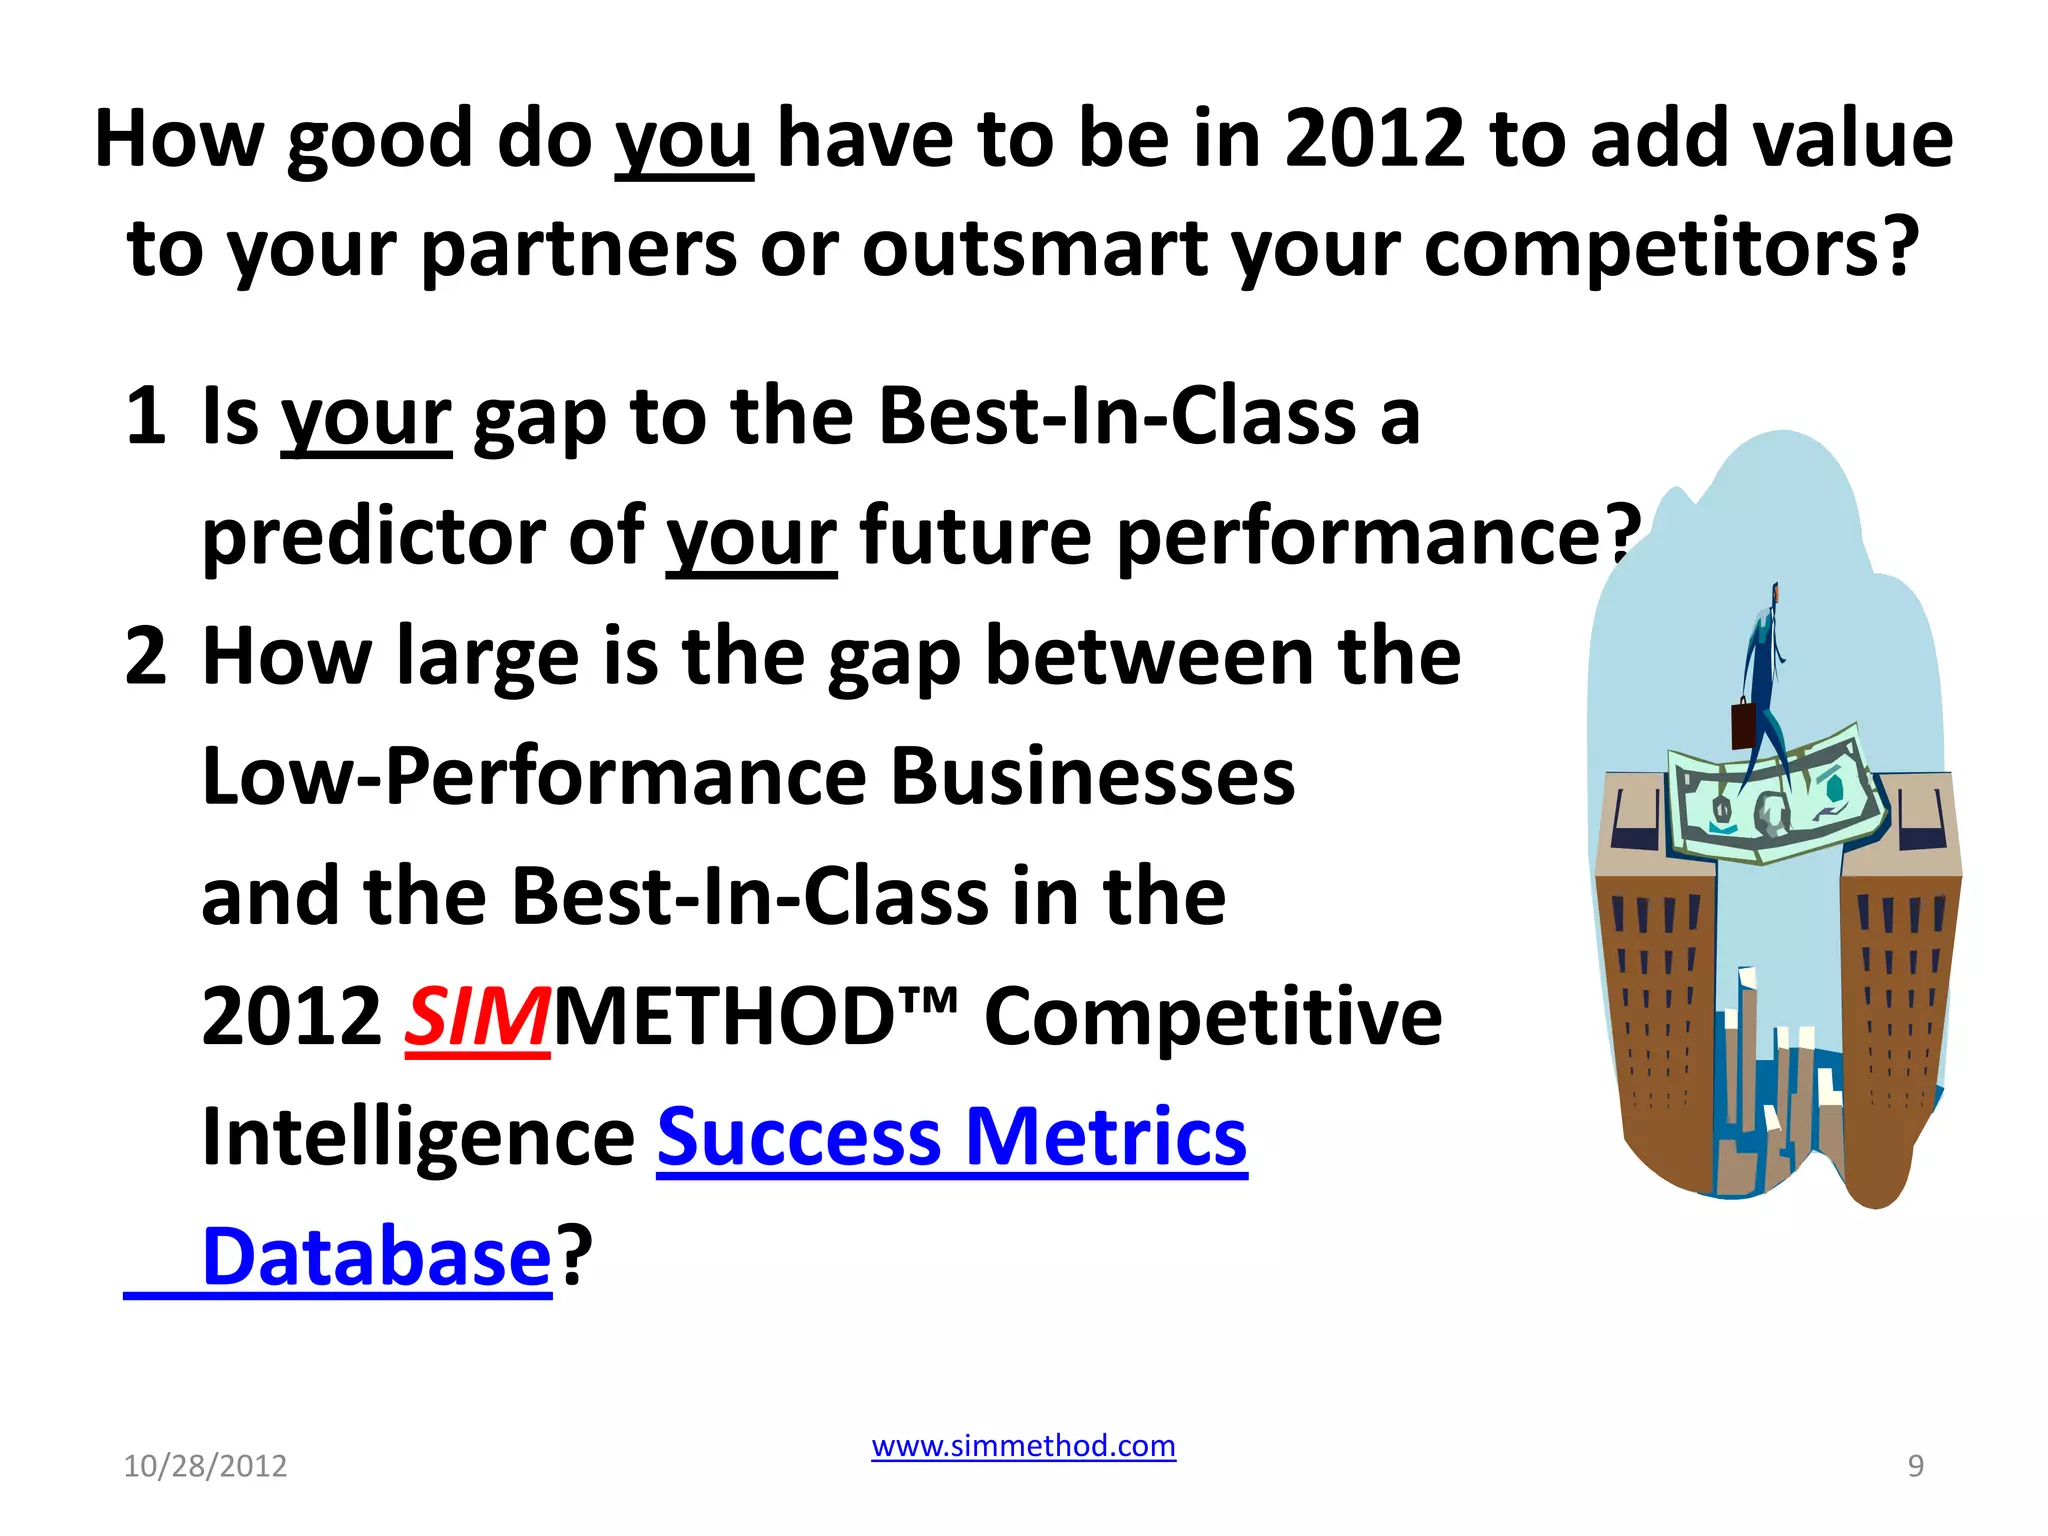
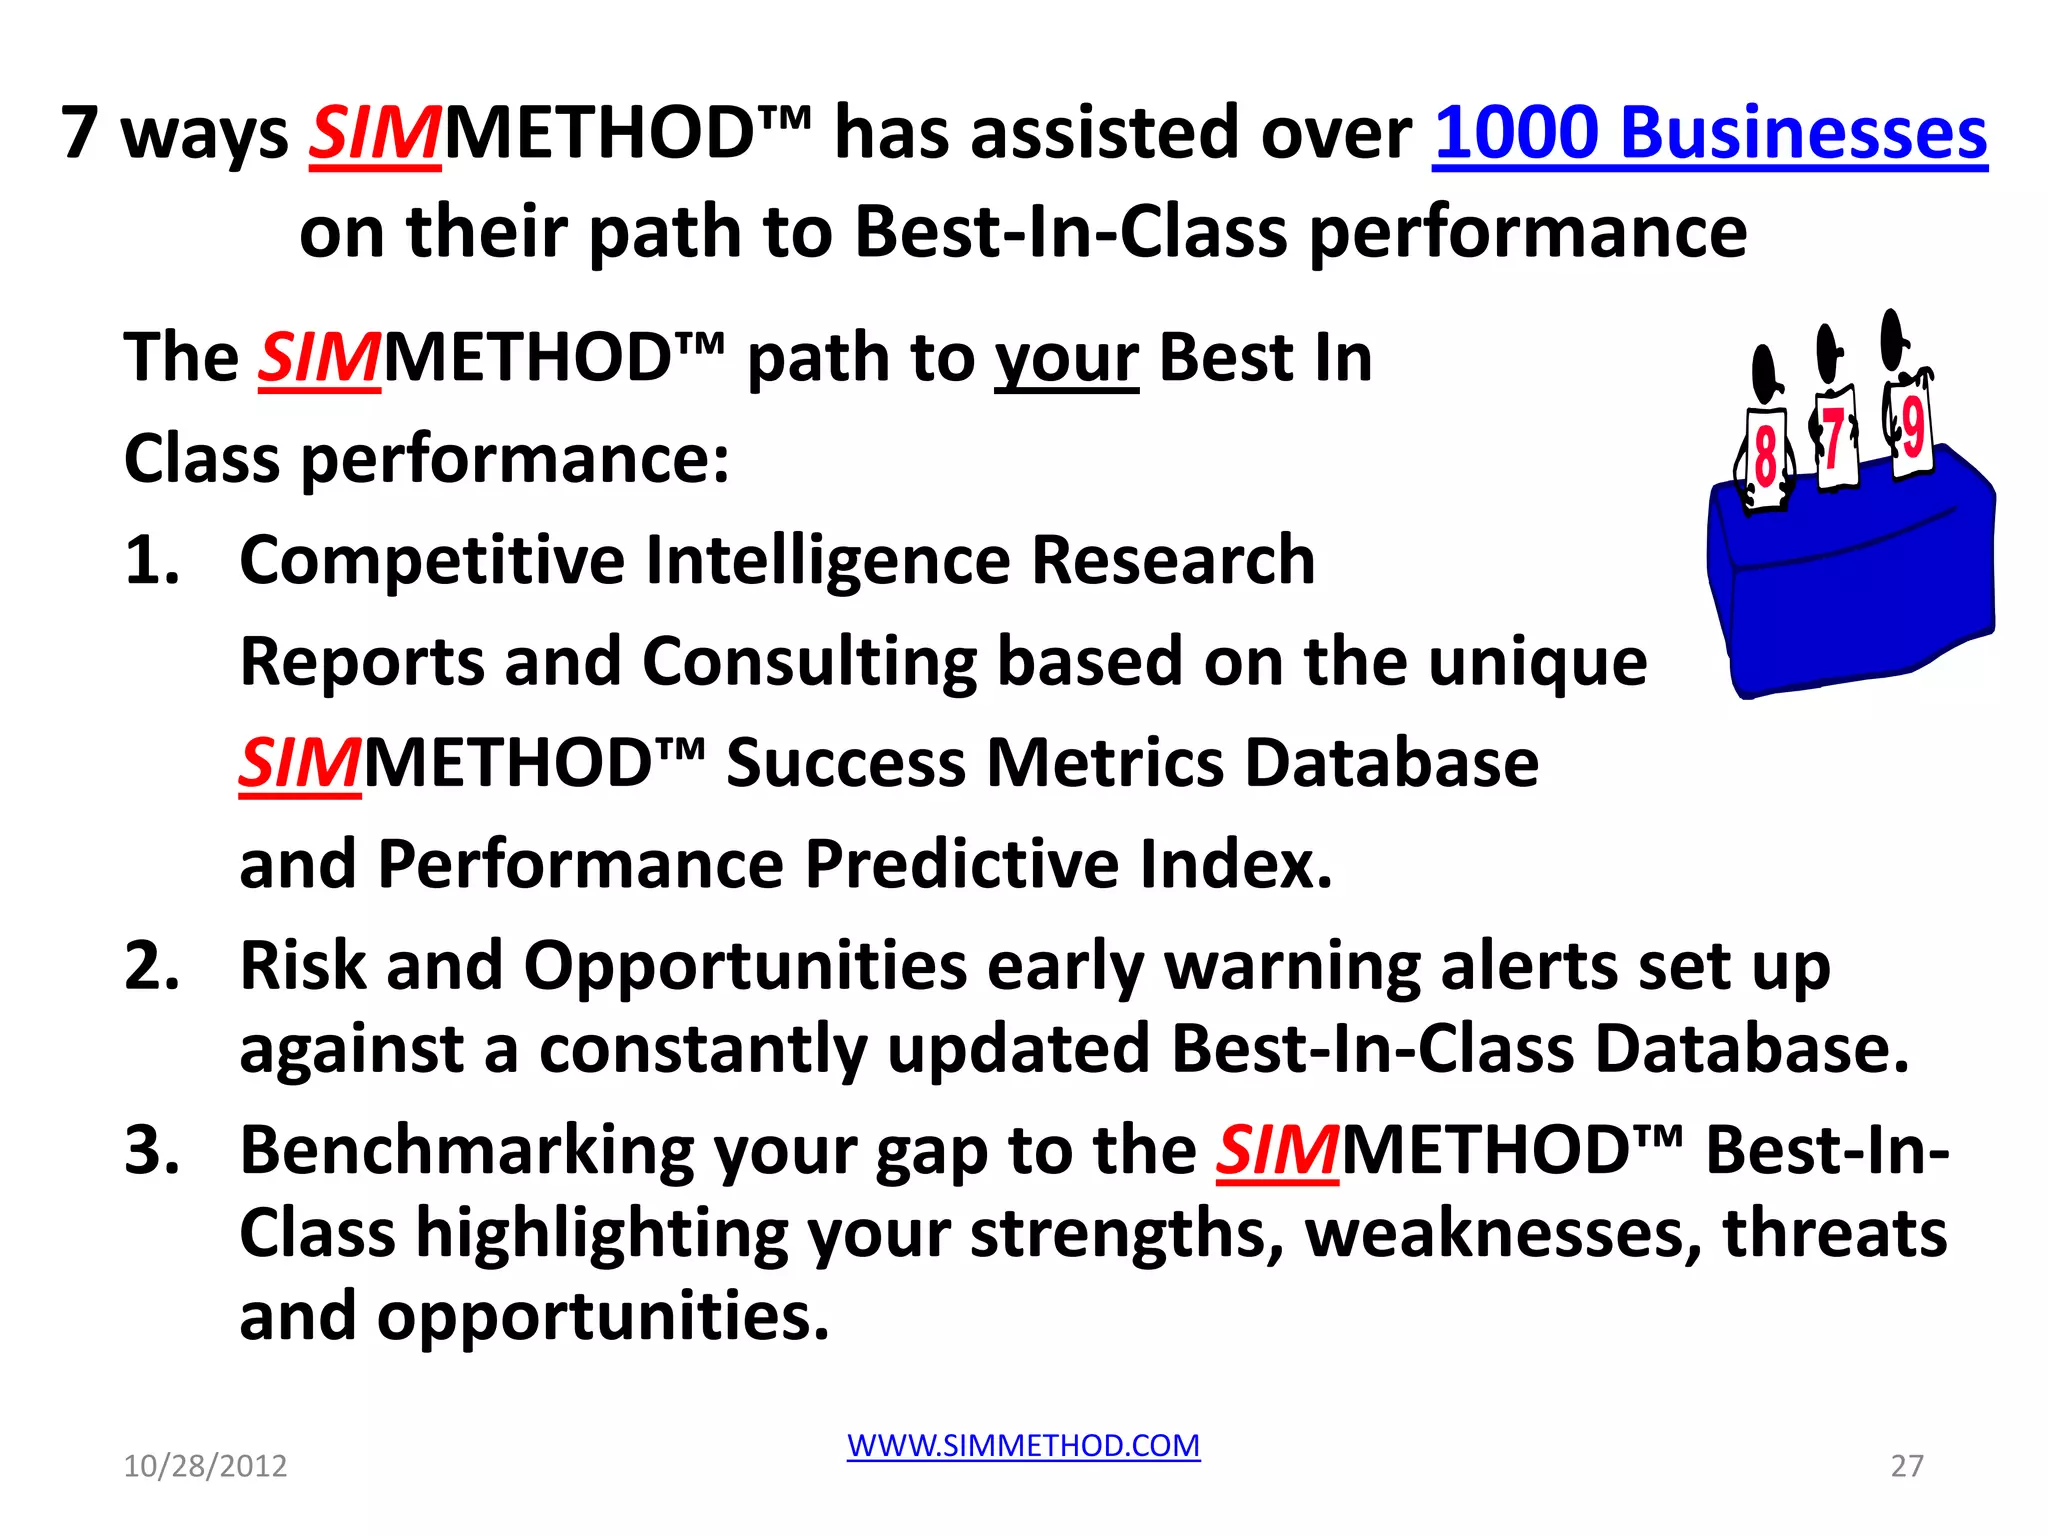
SIMMETHOD™
       Predicts the Performance of Your
        Business and Alerts You of new
          Threats and Opportunities
             How to Turn Your Business Intelligence,
              Analytics and CRM Software into Your
             CFO/CEO Most Valuable Business Tool?


                            www.simmethod.com
10/28/2012                                             1
How good do you have to be in 2012 to add value to
    your partners or outsmart your competitors?
    SIMMETHOD™ Strategy/Execution Performance Predictive
    Indices, Competitive Intelligence Metrics Database & Alerts
                                                             Performance driven by
     Value chain    The 7 Laws of                            external circumstances
        leading     Best Practices,                          beyond management
      indicators    Growth and                               control                   Does not comply
                                                                                       with the 7 Laws of
                    Value Creation
                                                                                       Best Practices/
                                                                                       Growth & Value
    Social Media    B-I-C resource                            CEO pay not aligned
    as a value/                                               to performance          Outdated
                     management                                                       Business
    profit driver
                                                                                      Model

                      Performance driven                   Intangible assets &
   CEO pay
                      by internal decision-                Social Media are not       Lack of visibility
   aligned to
                      making rather than                   leveraged as value         maximizes risk
   performance
                      ext. circumstances                   creators


                    SIMMETHOD™ Performance Predictive
                    Indices score & link your strategy,
                    management decisions and execution to
                    the overall performance of your business
                    in relation to your partners or
       BEST-IN-     competitors reflecting your, strengths,  LOW PERFORMANCE
       CLASS        weaknesses, risks and opportunities
                                              www.simmethod.com
10/28/2012                                                                                                  2
Is Your Management Excellence Predictive
        of Your Future Performance?
The following Decision-Making Insights show:
1. The transformation of 1000’s of hard-to-
   compare Business Data-Items into
   Operational, Social Media, Management and
   Financial Ratios
2. The conversion of the Ratios into Composite
   Industry-Agnostic Performance Predictive
   Indices and Risk/Opportunities Alerts.

10/28/2012         www.simmethod.com             3
Is Your Management Excellence Predictive
        of Your Future Performance?

3 Your competitive position within an
  ecosystem of Best-In-Class Enterprises and
  current and future competitors from your
  industry and from outside your industry.
4 Your capacity to add value to your value-
  chain and Business Partners.
5 The strength of your strategy and your
  Management Team in comparison to the
  Best-In-Class.
                    www.simmethod.com
10/28/2012                                     4
SIMMETHOD™ Case Study


Technology, Human Resources,
 Social Media, Research and
 Business Services Case Study


                 www.simmethod.com
10/28/2012                           5
SIMMETHOD™ Strategy/Execution
               Performance Predictive Index
• The SIMMETHOD™ Strategy/Execution
  Performance Predictive Index ranks your
  business risk and performance and your
  ability to design and execute a strategy
  within your value chain and a range of
  industries in comparison to current and
  future partners or competitors.

10/28/2012              www.simmethod.com     6
10
                                                   20
                                                        30
                                                             40
                                                                  50
                                                                       60


                                        0
                             Apple
                               Cielo


10/28/2012
                          Priceline
                       Checkpoint
                            Google
                         Terradata
                            Infosys
                                SAP
                         Microsoft
                           Aggreko
                             Oracle
                               Ebay
                                Tata
                          Vmware
                           Paychex
                          Moody's
                               citrix
                               BMC
                              intuit
                        Cognizant
                         Amadeus
                             Wipro


www.simmethod.com
                             Yahoo
                          Dassault
                           Amazon
                    World fuel serv
                         Autodesk
                        Salesforce
                          Groupon
                          LinkedIn
                                IBM
                        Accenture
                                                                                                                                    THE SIMMETHOD™ BEST-IN-CLASS


                                                                            Strategy/ Execution Performance Predictive Index


                                            Index
                                            Strategy/
                                            Execution

                                            Predictive
                                                                                                                               Enterprise Holistic Performance and Risk View


                                            Performance


7
-60
                          -50
                                -40
                                      -30
                                                 -20
                                                          -10
                                                                       0
                                            Alliance Data Systems
                                                                CSC


10/28/2012
                                                             Adobe
                                                       Robert Half
                                                               SGS
                                                                 CA
                                                          Brambles
                                                           Gartner
                                                               ADP
                                                          Experian
                                                               Dell
                                                          Forrester
                                                         CGI Group
                                                     Thomas Cook
                                                     Apollo Group
                                                              Bunzl
                                                      Capita Group
                                                            Adecco


www.simmethod.com
                                                Liberty interactive
                                                              Misys
                                                             Fiserv
                                                         Symantec
                                             Fidelity National Info
                                                                 HP
                                                        Manpower
                                                            Sodexo
                                                                 Tui
                                                          Randstad
                                                                           Strategy/ Execution Performance Predictive Index
                                                                                                                                 THE SIMMETHOD™ LOW PERFORMERS


                                                        Capgemini
                                                                                                                              Enterprise Holistic Performance and Risk View


8
How good do you have to be in 2012 to add value
 to your partners or outsmart your competitors?
1 Is your gap to the Best-In-Class a
  predictor of your future performance?
2 How large is the gap between the
  Low-Performance Businesses
  and the Best-In-Class in the
  2012 SIMMETHOD™ Competitive
  Intelligence Success Metrics
  Database?
                   www.simmethod.com
10/28/2012                                   9
How good do you have to be in 2012 to add value
 to your partners or outsmart your competitors?
3 How much value has been created by the Best-
  In-Class or destroyed by the Low Performers?
4 Is Market Asset Valuation a reflection on
  Strategy, Execution, Management, Resource
  Utilization, Business Models, Business
  Processes, Customer Relationship, Decision-
  Making Process, Performance and Risk
  Management and Growth Prospects?

                   www.simmethod.com
10/28/2012                                   10
SIMMETHOD™ 2012 Best-In-Class
         Top 25% Vs Bottom 25%
                Value above
                assets=$65B

                       Value below
                       assets=-$7.5B
                 www.simmethod.com
10/28/2012                             11
SIMMETHOD™ 2012 Best-In-Class
         Top 50% Vs Bottom 50%
                Value above
                assets=$43B

                        Value below
                        assets=-$3B
                 www.simmethod.com
10/28/2012                            12
SIMMETHOD™ 2012 Best-In-Class
         Top 25% Vs Bottom 25%
                Profit
                Margin=24%

                        Profit
                        Margin = 6%
                 www.simmethod.com
10/28/2012                            13
SIMMETHOD™ Best-In-Class
                       Top 25%
                Historical Perspective

• B-I-C Profit             2011            • B-I-C Profit
  Margin =          • B-I-C Profit           Margin =
  32%                 Margin =               24%
                      28%
             2010                               2012

                       www.simmethod.com
10/28/2012                                                  14
SIMMETHOD™ Best-In-Class
                     Bottom 25%
                Historical Perspective

• Bottom 25%                2011           • Bottom 25%
  Profit Margin     • Bottom 25%             Profit Margin =
  = 0%                Profit Margin          6%
                      = 2%
             2010                                 2012

                       www.simmethod.com
10/28/2012                                                 15
SIMMETHOD™ 2012 Best-In-Class
         Top 50% Vs Bottom 50%
                Profit
                Margin= 20%

                       Profit
                       Margin= 8.5%
                 www.simmethod.com
10/28/2012                            16
SIMMETHOD™ 2012 Best-In-Class
         Top 25% Vs Bottom 25%

                Profit/employee
                = $240,000


                       Profit/employee
                       = $16,000

                 www.simmethod.com
10/28/2012                               17
SIMMETHOD™ 2012 Best-In-Class
         Top 25% Vs Bottom 25%
• The SIMMETHOD™ Best-In-Class (Top 25%)
  delivered 15X more Profits per Employee
  than the Low Performers. In other words,
• To produce the same level of profit, the
  bottom 25% need 15X more employees than
  the top 25% in the SIMMETHOD™ Best-In-
  Class group.

                 www.simmethod.com
10/28/2012                                   18
SIMMETHOD™ Best-In-Class
                       Top 25%
                Historical Perspective

• B-I-C Profit/             2011           • B-I-C Profit/
  Employee =        • B-I-C Profit/          Employee =
  $300K               Employee =             $240K
                      $530K
             2010                                 2012

                       www.simmethod.com
10/28/2012                                                   19
SIMMETHOD™ Best-In-Class
                     Bottom 25%
                Historical Perspective

• Bottom 25%                2011           • Bottom 25%
  Profit/           • Bottom 25%             Profit/
  Employee =          Profit/                Employee =
  $850                Employee =             $16K
                      $3.2K
             2010                                2012

                       www.simmethod.com
10/28/2012                                                20
SIMMETHOD™ 2012 Best-In-Class
         Top 50% Vs Bottom 50%

                Profit/employee
                = $147,000


                       Profit/employee
                       = $24,000

                 www.simmethod.com
10/28/2012                               21
SIMMETHOD™ 2012 Best-In-Class
         Top 50% Vs Bottom 50%
• The SIMMETHOD™ Best-In-Class (Top 50%)
  delivered 6X more Profits per Employee than
  the Low Performers. In other words,
• To produce the same level of profit, the
  bottom 50% need 6X more employees than
  the Top 50% in the SIMMETHOD™ Best-In-
  Class group.


                   www.simmethod.com
10/28/2012                                  22
SIMMETHOD™ 2012 Best-In-Class
         Top 25% Vs Bottom 25%

                Value/ Employee
                = $3.9M


                       Value/ Employee
                       = $267,000

                 www.simmethod.com
10/28/2012                               23
SIMMETHOD™ 2012 Best-In-Class
         Top 50% Vs Bottom 50%

                Value/ Employee
                = $2.8M


                       Value/ Employee
                       = $420,000

10/28/2012       www.simmethod.com       24
SIMMETHOD™ Best-In-Class
                       Top 25%
                Historical Perspective

• B-I-C Value/              2011           • B-I-C Value/
                                             Employee =
  Employee =        • B-I-C Value/
  $4.3M                                      $3.9M
                      Employee =
                      $6.1M
             2010                                 2012

                       www.simmethod.com
10/28/2012                                                  25
SIMMETHOD™ Best-In-Class
                     Bottom 25%
                Historical Perspective

                                           • Bottom 25%
• Bottom 25%               2011              Value/
  Value/            • Bottom 25%             Employee =
  Employee =          Value/                 $267K
  $60K                Employee =
                      $59.5K
             2010                               2012

                       www.simmethod.com
10/28/2012                                                26
7 ways SIMMETHOD™ has assisted over 1000 Businesses
      on their path to Best-In-Class performance
 The SIMMETHOD™ path to your Best In
 Class performance:
 1. Competitive Intelligence Research
     Reports and Consulting based on the unique
     SIMMETHOD™ Success Metrics Database
     and Performance Predictive Index.
 2. Risk and Opportunities early warning alerts set up
     against a constantly updated Best-In-Class Database.
 3. Benchmarking your gap to the SIMMETHOD™ Best-In-
     Class highlighting your strengths, weaknesses, threats
     and opportunities.
                       WWW.SIMMETHOD.COM
 10/28/2012                                              27
7 ways SIMMETHOD™ has assisted over 1000 Businesses
      on their path to Best-In-Class performance

 4. Rating your Strategy/Execution, your
    Management Excellence and Predicting the
    performance of your Business and Management
    Team in relation to your competitors.
 5. Measuring and aligning the contribution of hard-
    to-measure resources or projects such as Social
    Media or Analytics to Business performance.
 6. Adding hard-to-obtain analytics to your
    Business Proposals thus, creating a point of
    differentiation and competitive advantage.

                     WWW.SIMMETHOD.COM
 10/28/2012                                        28
7 ways SIMMETHOD™ has assisted over 1000
Businesses on their path to Best-In-Class performance

7. Holistically benchmarking :
• Your Business Model,
• The alignment and contribution of your
   resources to your bottom-line,
• The added-value of your Sales Organization,
• Your cost structure and overheads,
• The added-value of your Human Capital
• your degree of Competitive Risk and
• your gap to the Best-In-Class Enterprises.
                     www.simmethod.com
10/28/2012                                         29
Jorge Oscar Tabacman
             jtabacman@gmail.com
             Twitter ID: SIMMETHOD

                 SIMMETHOD™
       Predicts the Performance of Your
        Business and Alerts You of new
       Threats and Opportunities from
       inside and outside your industry
                     WWW.SIMMETHOD.COM
10/28/2012                                30

Is your business intelligence, bigdata analytics and crm software your cfo, ceo and cmo most valuable business performance improvement tool

  • 1.
    SIMMETHOD™ Predicts the Performance of Your Business and Alerts You of new Threats and Opportunities How to Turn Your Business Intelligence, Analytics and CRM Software into Your CFO/CEO Most Valuable Business Tool? www.simmethod.com 10/28/2012 1
  • 2.
    How good doyou have to be in 2012 to add value to your partners or outsmart your competitors? SIMMETHOD™ Strategy/Execution Performance Predictive Indices, Competitive Intelligence Metrics Database & Alerts Performance driven by Value chain The 7 Laws of external circumstances leading Best Practices, beyond management indicators Growth and control Does not comply with the 7 Laws of Value Creation Best Practices/ Growth & Value Social Media B-I-C resource CEO pay not aligned as a value/ to performance Outdated management Business profit driver Model Performance driven Intangible assets & CEO pay by internal decision- Social Media are not Lack of visibility aligned to making rather than leveraged as value maximizes risk performance ext. circumstances creators SIMMETHOD™ Performance Predictive Indices score & link your strategy, management decisions and execution to the overall performance of your business in relation to your partners or BEST-IN- competitors reflecting your, strengths, LOW PERFORMANCE CLASS weaknesses, risks and opportunities www.simmethod.com 10/28/2012 2
  • 3.
    Is Your ManagementExcellence Predictive of Your Future Performance? The following Decision-Making Insights show: 1. The transformation of 1000’s of hard-to- compare Business Data-Items into Operational, Social Media, Management and Financial Ratios 2. The conversion of the Ratios into Composite Industry-Agnostic Performance Predictive Indices and Risk/Opportunities Alerts. 10/28/2012 www.simmethod.com 3
  • 4.
    Is Your ManagementExcellence Predictive of Your Future Performance? 3 Your competitive position within an ecosystem of Best-In-Class Enterprises and current and future competitors from your industry and from outside your industry. 4 Your capacity to add value to your value- chain and Business Partners. 5 The strength of your strategy and your Management Team in comparison to the Best-In-Class. www.simmethod.com 10/28/2012 4
  • 5.
    SIMMETHOD™ Case Study Technology,Human Resources, Social Media, Research and Business Services Case Study www.simmethod.com 10/28/2012 5
  • 6.
    SIMMETHOD™ Strategy/Execution Performance Predictive Index • The SIMMETHOD™ Strategy/Execution Performance Predictive Index ranks your business risk and performance and your ability to design and execute a strategy within your value chain and a range of industries in comparison to current and future partners or competitors. 10/28/2012 www.simmethod.com 6
  • 7.
    10 20 30 40 50 60 0 Apple Cielo 10/28/2012 Priceline Checkpoint Google Terradata Infosys SAP Microsoft Aggreko Oracle Ebay Tata Vmware Paychex Moody's citrix BMC intuit Cognizant Amadeus Wipro www.simmethod.com Yahoo Dassault Amazon World fuel serv Autodesk Salesforce Groupon LinkedIn IBM Accenture THE SIMMETHOD™ BEST-IN-CLASS Strategy/ Execution Performance Predictive Index Index Strategy/ Execution Predictive Enterprise Holistic Performance and Risk View Performance 7
  • 8.
    -60 -50 -40 -30 -20 -10 0 Alliance Data Systems CSC 10/28/2012 Adobe Robert Half SGS CA Brambles Gartner ADP Experian Dell Forrester CGI Group Thomas Cook Apollo Group Bunzl Capita Group Adecco www.simmethod.com Liberty interactive Misys Fiserv Symantec Fidelity National Info HP Manpower Sodexo Tui Randstad Strategy/ Execution Performance Predictive Index THE SIMMETHOD™ LOW PERFORMERS Capgemini Enterprise Holistic Performance and Risk View 8
  • 9.
    How good doyou have to be in 2012 to add value to your partners or outsmart your competitors? 1 Is your gap to the Best-In-Class a predictor of your future performance? 2 How large is the gap between the Low-Performance Businesses and the Best-In-Class in the 2012 SIMMETHOD™ Competitive Intelligence Success Metrics Database? www.simmethod.com 10/28/2012 9
  • 10.
    How good doyou have to be in 2012 to add value to your partners or outsmart your competitors? 3 How much value has been created by the Best- In-Class or destroyed by the Low Performers? 4 Is Market Asset Valuation a reflection on Strategy, Execution, Management, Resource Utilization, Business Models, Business Processes, Customer Relationship, Decision- Making Process, Performance and Risk Management and Growth Prospects? www.simmethod.com 10/28/2012 10
  • 11.
    SIMMETHOD™ 2012 Best-In-Class Top 25% Vs Bottom 25% Value above assets=$65B Value below assets=-$7.5B www.simmethod.com 10/28/2012 11
  • 12.
    SIMMETHOD™ 2012 Best-In-Class Top 50% Vs Bottom 50% Value above assets=$43B Value below assets=-$3B www.simmethod.com 10/28/2012 12
  • 13.
    SIMMETHOD™ 2012 Best-In-Class Top 25% Vs Bottom 25% Profit Margin=24% Profit Margin = 6% www.simmethod.com 10/28/2012 13
  • 14.
    SIMMETHOD™ Best-In-Class Top 25% Historical Perspective • B-I-C Profit 2011 • B-I-C Profit Margin = • B-I-C Profit Margin = 32% Margin = 24% 28% 2010 2012 www.simmethod.com 10/28/2012 14
  • 15.
    SIMMETHOD™ Best-In-Class Bottom 25% Historical Perspective • Bottom 25% 2011 • Bottom 25% Profit Margin • Bottom 25% Profit Margin = = 0% Profit Margin 6% = 2% 2010 2012 www.simmethod.com 10/28/2012 15
  • 16.
    SIMMETHOD™ 2012 Best-In-Class Top 50% Vs Bottom 50% Profit Margin= 20% Profit Margin= 8.5% www.simmethod.com 10/28/2012 16
  • 17.
    SIMMETHOD™ 2012 Best-In-Class Top 25% Vs Bottom 25% Profit/employee = $240,000 Profit/employee = $16,000 www.simmethod.com 10/28/2012 17
  • 18.
    SIMMETHOD™ 2012 Best-In-Class Top 25% Vs Bottom 25% • The SIMMETHOD™ Best-In-Class (Top 25%) delivered 15X more Profits per Employee than the Low Performers. In other words, • To produce the same level of profit, the bottom 25% need 15X more employees than the top 25% in the SIMMETHOD™ Best-In- Class group. www.simmethod.com 10/28/2012 18
  • 19.
    SIMMETHOD™ Best-In-Class Top 25% Historical Perspective • B-I-C Profit/ 2011 • B-I-C Profit/ Employee = • B-I-C Profit/ Employee = $300K Employee = $240K $530K 2010 2012 www.simmethod.com 10/28/2012 19
  • 20.
    SIMMETHOD™ Best-In-Class Bottom 25% Historical Perspective • Bottom 25% 2011 • Bottom 25% Profit/ • Bottom 25% Profit/ Employee = Profit/ Employee = $850 Employee = $16K $3.2K 2010 2012 www.simmethod.com 10/28/2012 20
  • 21.
    SIMMETHOD™ 2012 Best-In-Class Top 50% Vs Bottom 50% Profit/employee = $147,000 Profit/employee = $24,000 www.simmethod.com 10/28/2012 21
  • 22.
    SIMMETHOD™ 2012 Best-In-Class Top 50% Vs Bottom 50% • The SIMMETHOD™ Best-In-Class (Top 50%) delivered 6X more Profits per Employee than the Low Performers. In other words, • To produce the same level of profit, the bottom 50% need 6X more employees than the Top 50% in the SIMMETHOD™ Best-In- Class group. www.simmethod.com 10/28/2012 22
  • 23.
    SIMMETHOD™ 2012 Best-In-Class Top 25% Vs Bottom 25% Value/ Employee = $3.9M Value/ Employee = $267,000 www.simmethod.com 10/28/2012 23
  • 24.
    SIMMETHOD™ 2012 Best-In-Class Top 50% Vs Bottom 50% Value/ Employee = $2.8M Value/ Employee = $420,000 10/28/2012 www.simmethod.com 24
  • 25.
    SIMMETHOD™ Best-In-Class Top 25% Historical Perspective • B-I-C Value/ 2011 • B-I-C Value/ Employee = Employee = • B-I-C Value/ $4.3M $3.9M Employee = $6.1M 2010 2012 www.simmethod.com 10/28/2012 25
  • 26.
    SIMMETHOD™ Best-In-Class Bottom 25% Historical Perspective • Bottom 25% • Bottom 25% 2011 Value/ Value/ • Bottom 25% Employee = Employee = Value/ $267K $60K Employee = $59.5K 2010 2012 www.simmethod.com 10/28/2012 26
  • 27.
    7 ways SIMMETHOD™has assisted over 1000 Businesses on their path to Best-In-Class performance The SIMMETHOD™ path to your Best In Class performance: 1. Competitive Intelligence Research Reports and Consulting based on the unique SIMMETHOD™ Success Metrics Database and Performance Predictive Index. 2. Risk and Opportunities early warning alerts set up against a constantly updated Best-In-Class Database. 3. Benchmarking your gap to the SIMMETHOD™ Best-In- Class highlighting your strengths, weaknesses, threats and opportunities. WWW.SIMMETHOD.COM 10/28/2012 27
  • 28.
    7 ways SIMMETHOD™has assisted over 1000 Businesses on their path to Best-In-Class performance 4. Rating your Strategy/Execution, your Management Excellence and Predicting the performance of your Business and Management Team in relation to your competitors. 5. Measuring and aligning the contribution of hard- to-measure resources or projects such as Social Media or Analytics to Business performance. 6. Adding hard-to-obtain analytics to your Business Proposals thus, creating a point of differentiation and competitive advantage. WWW.SIMMETHOD.COM 10/28/2012 28
  • 29.
    7 ways SIMMETHOD™has assisted over 1000 Businesses on their path to Best-In-Class performance 7. Holistically benchmarking : • Your Business Model, • The alignment and contribution of your resources to your bottom-line, • The added-value of your Sales Organization, • Your cost structure and overheads, • The added-value of your Human Capital • your degree of Competitive Risk and • your gap to the Best-In-Class Enterprises. www.simmethod.com 10/28/2012 29
  • 30.
    Jorge Oscar Tabacman jtabacman@gmail.com Twitter ID: SIMMETHOD SIMMETHOD™ Predicts the Performance of Your Business and Alerts You of new Threats and Opportunities from inside and outside your industry WWW.SIMMETHOD.COM 10/28/2012 30