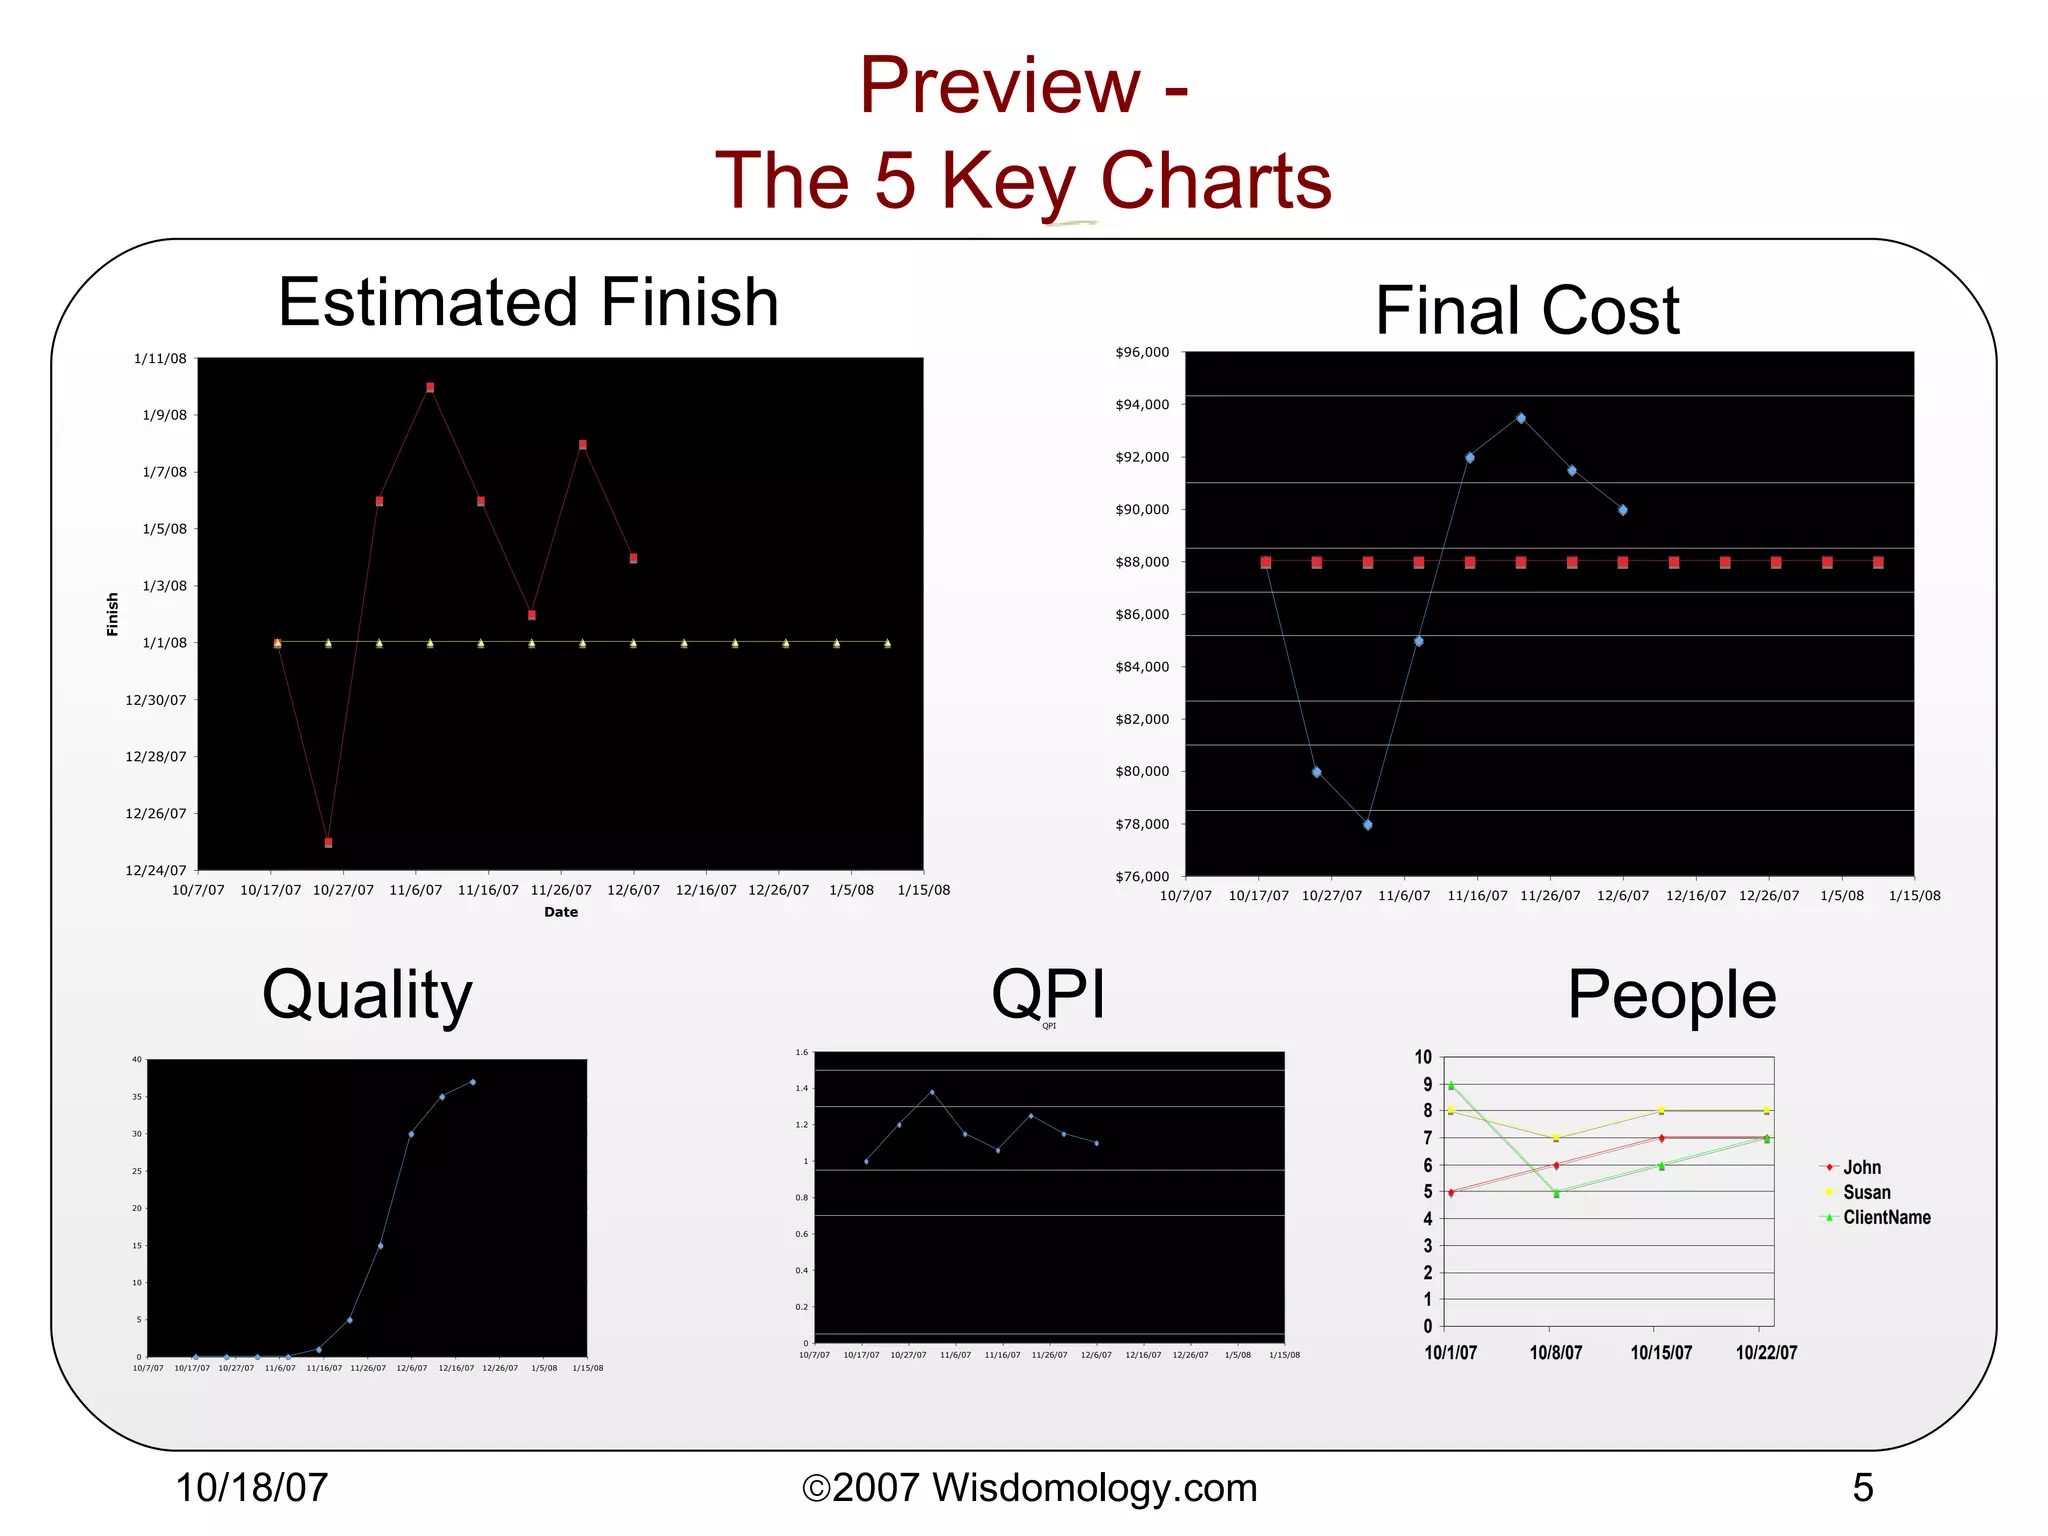
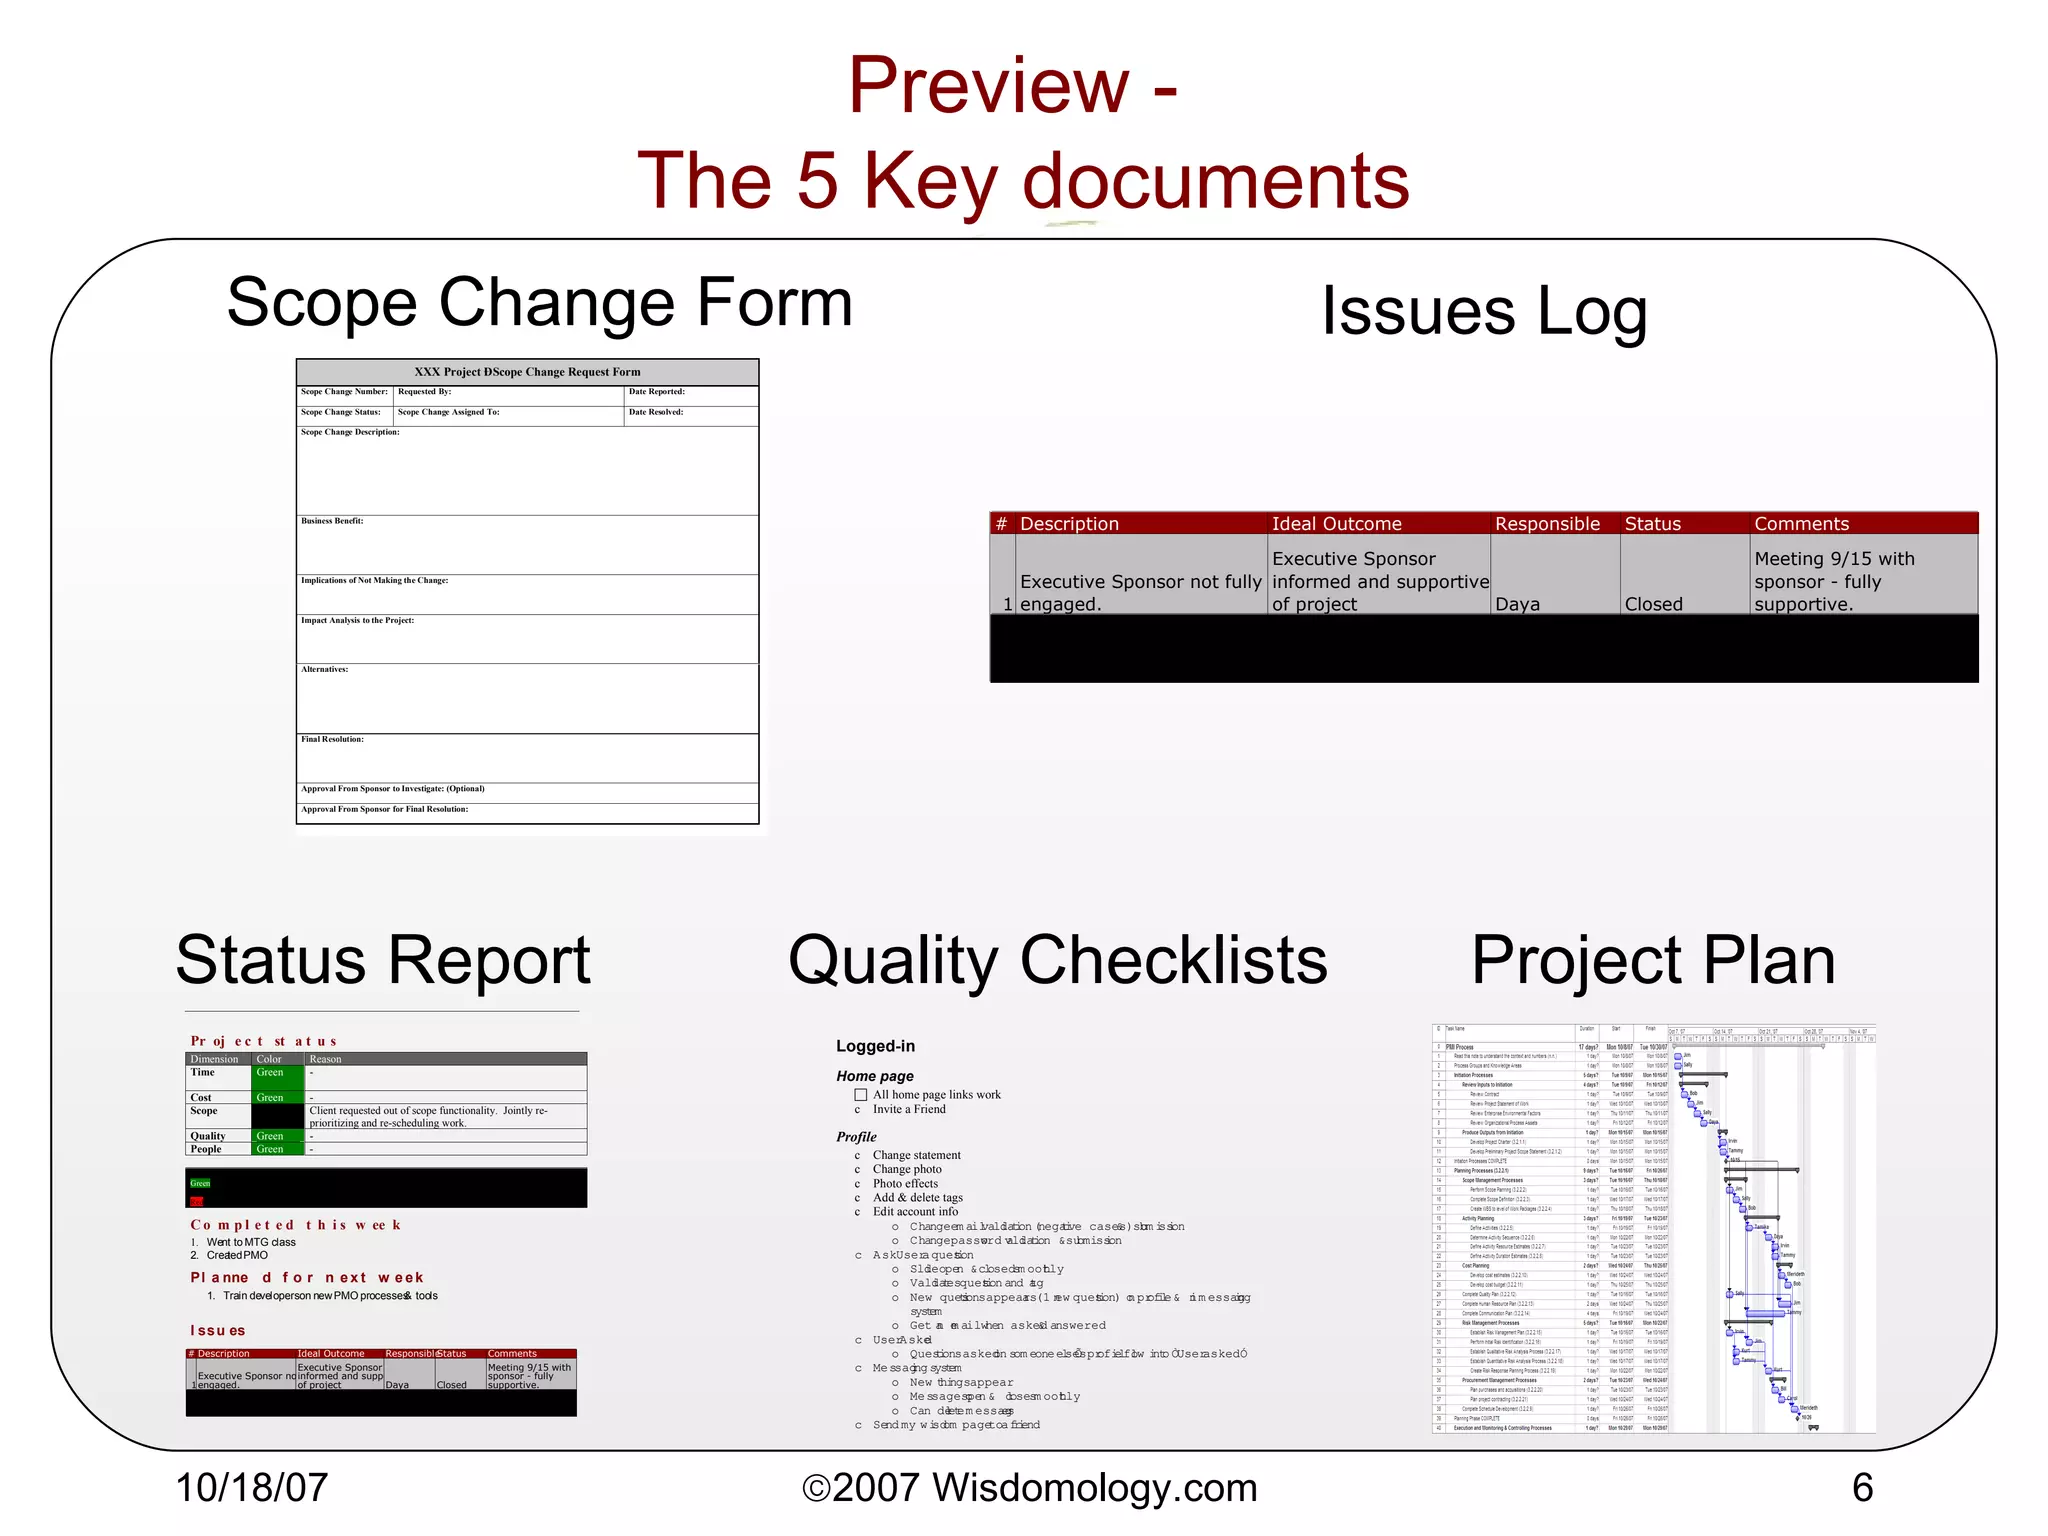
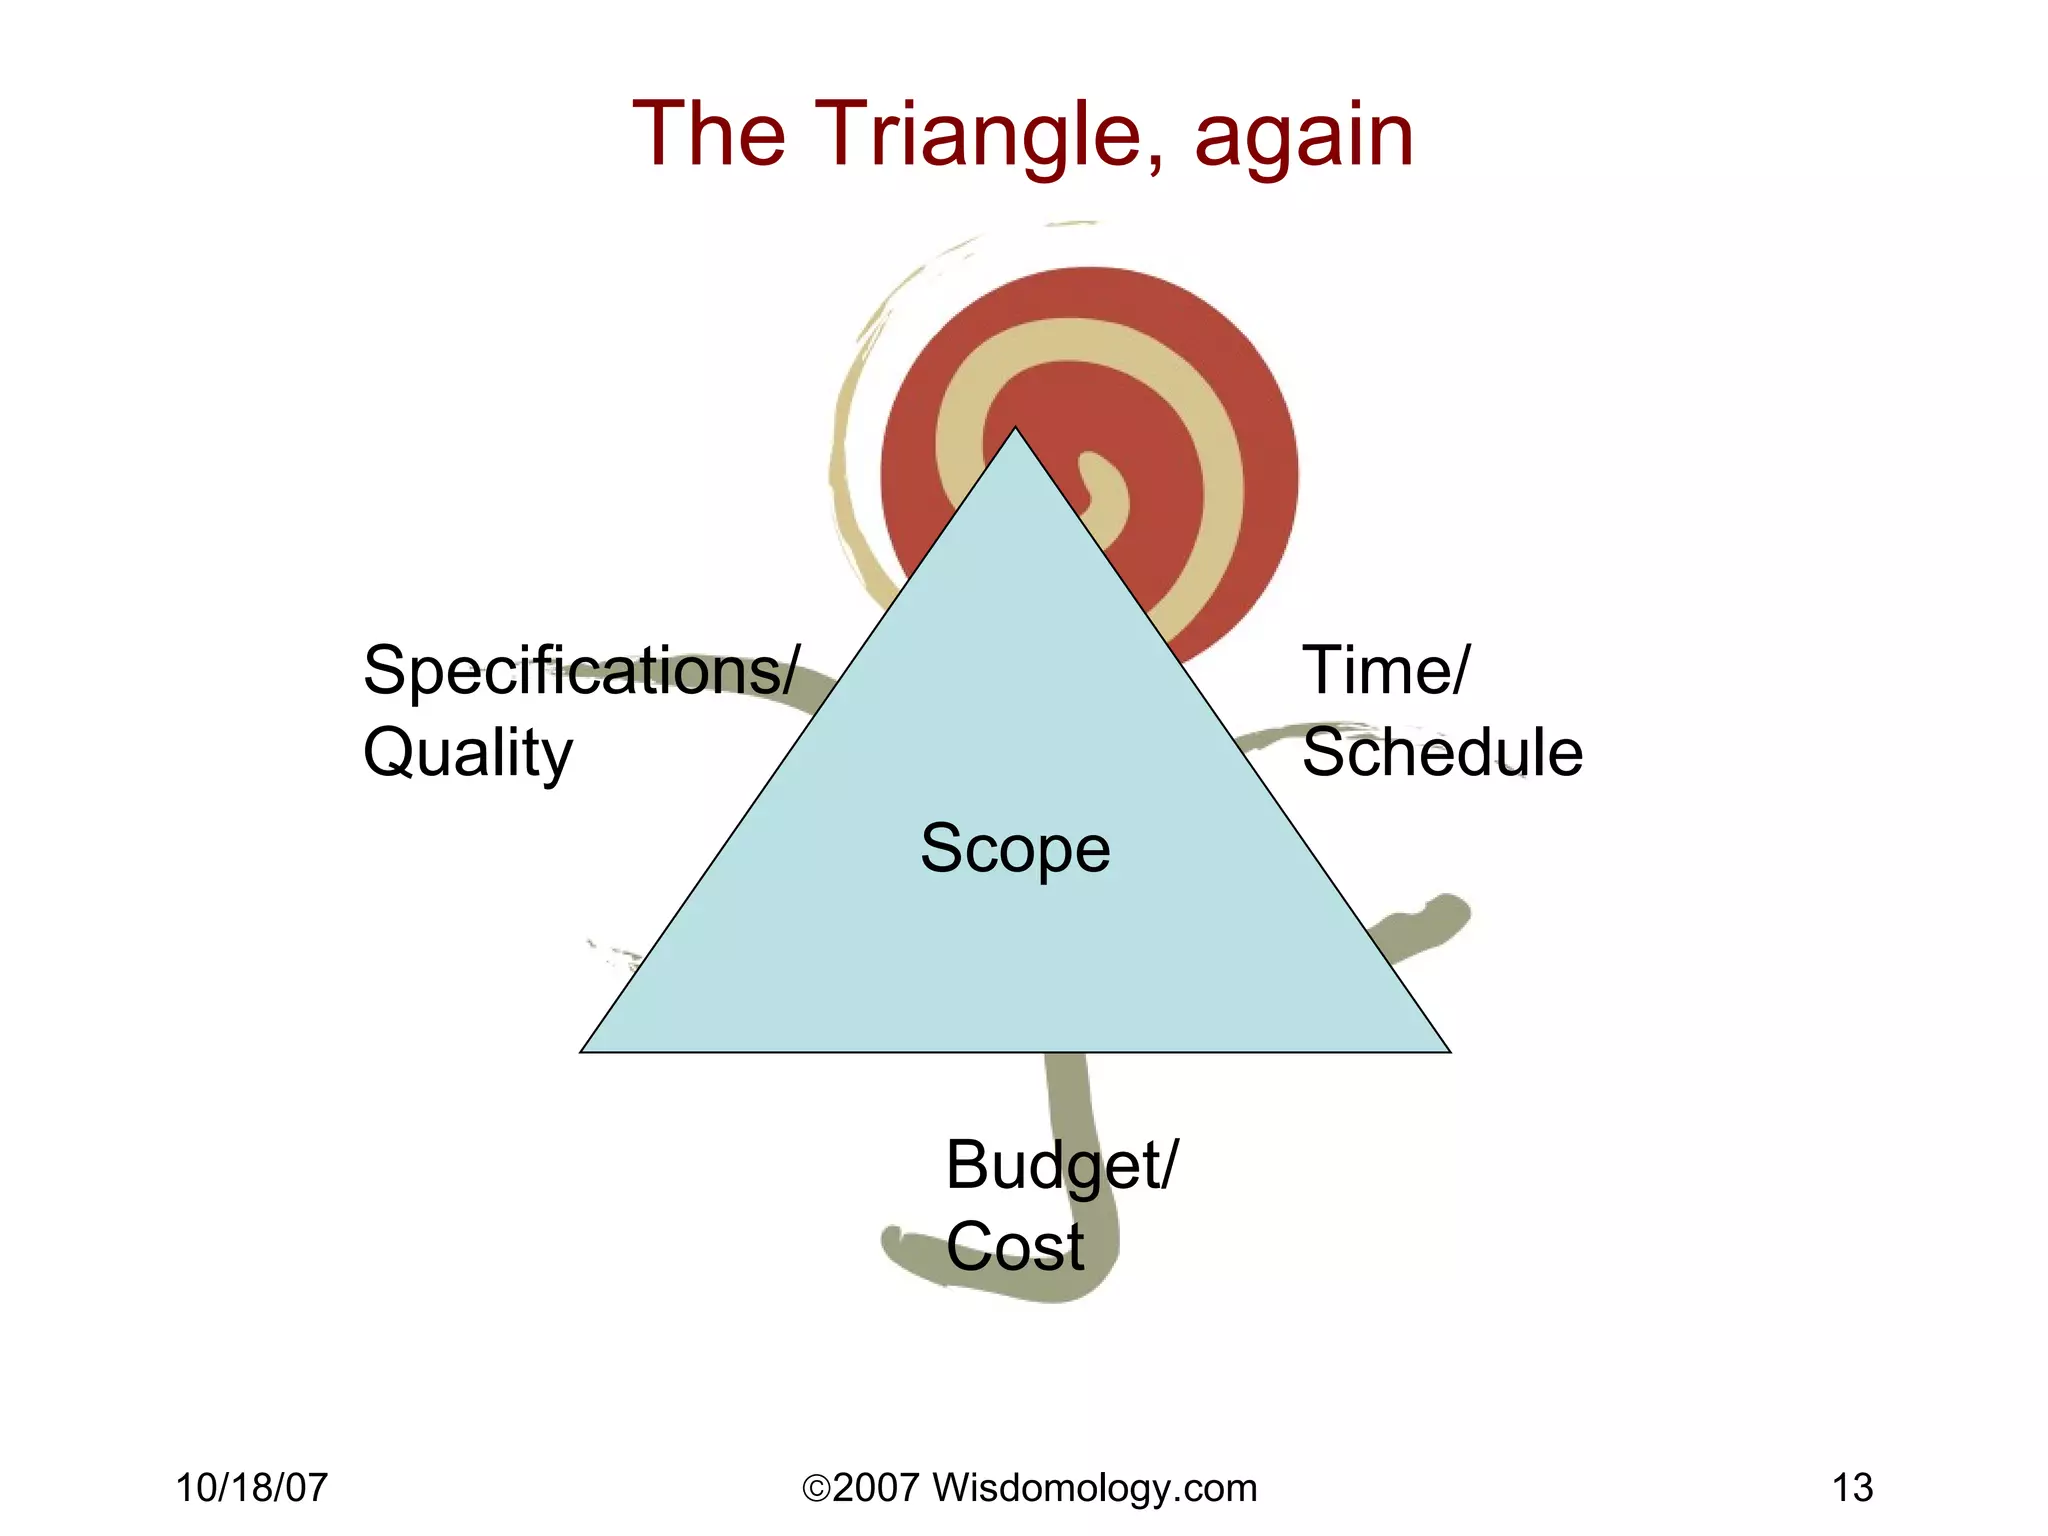
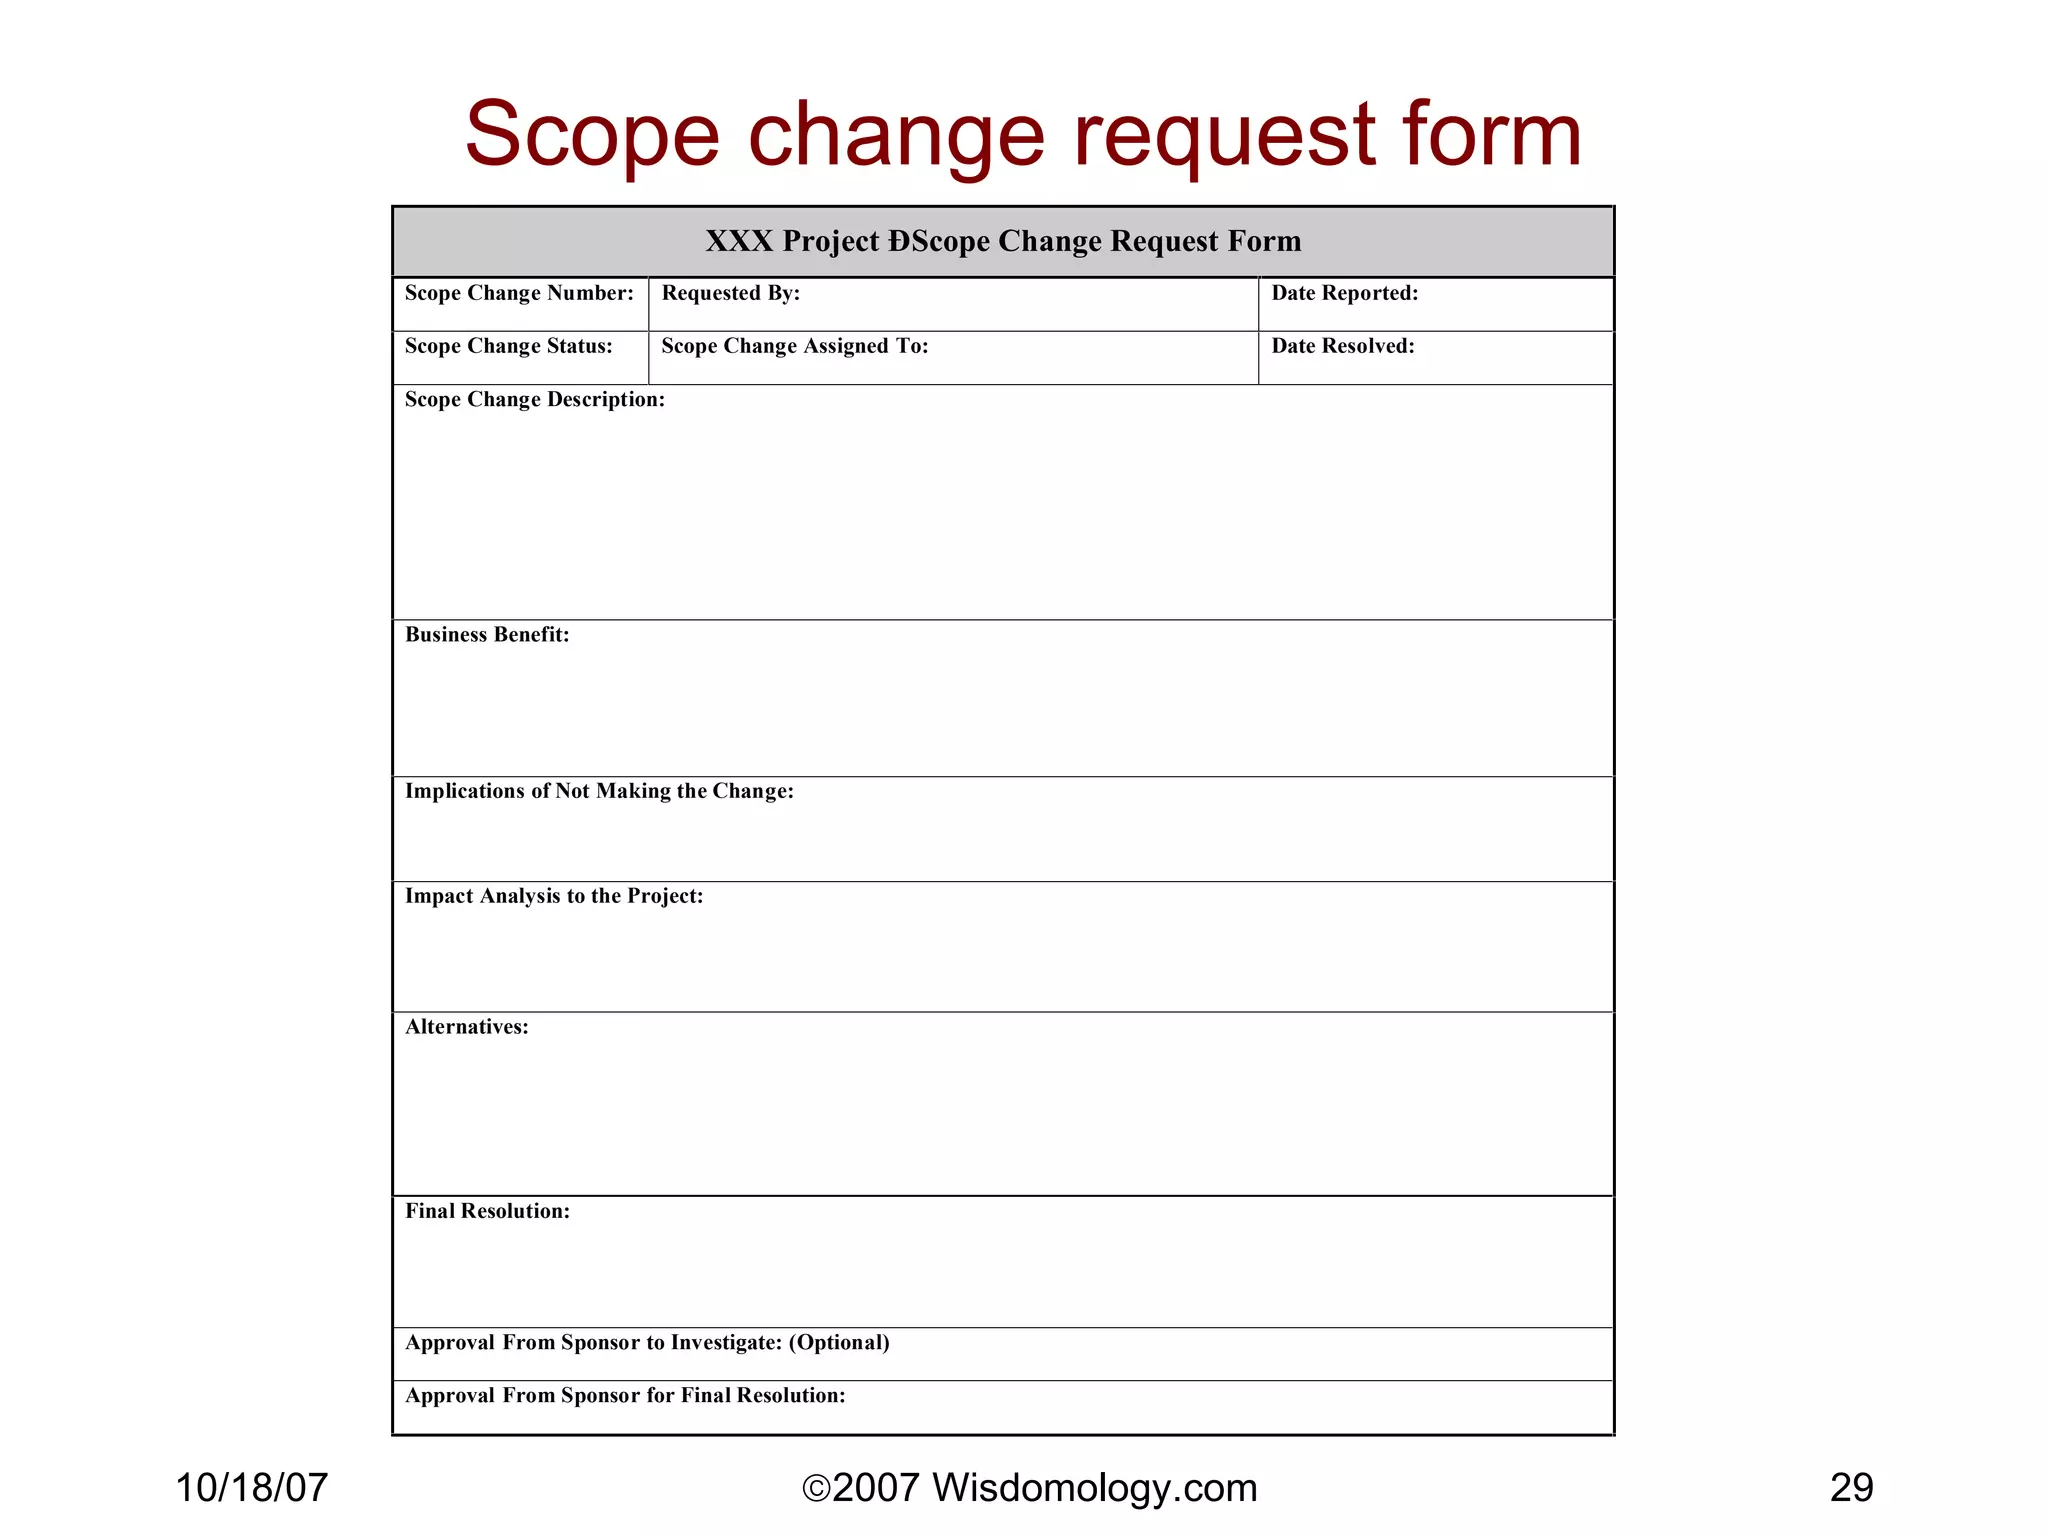
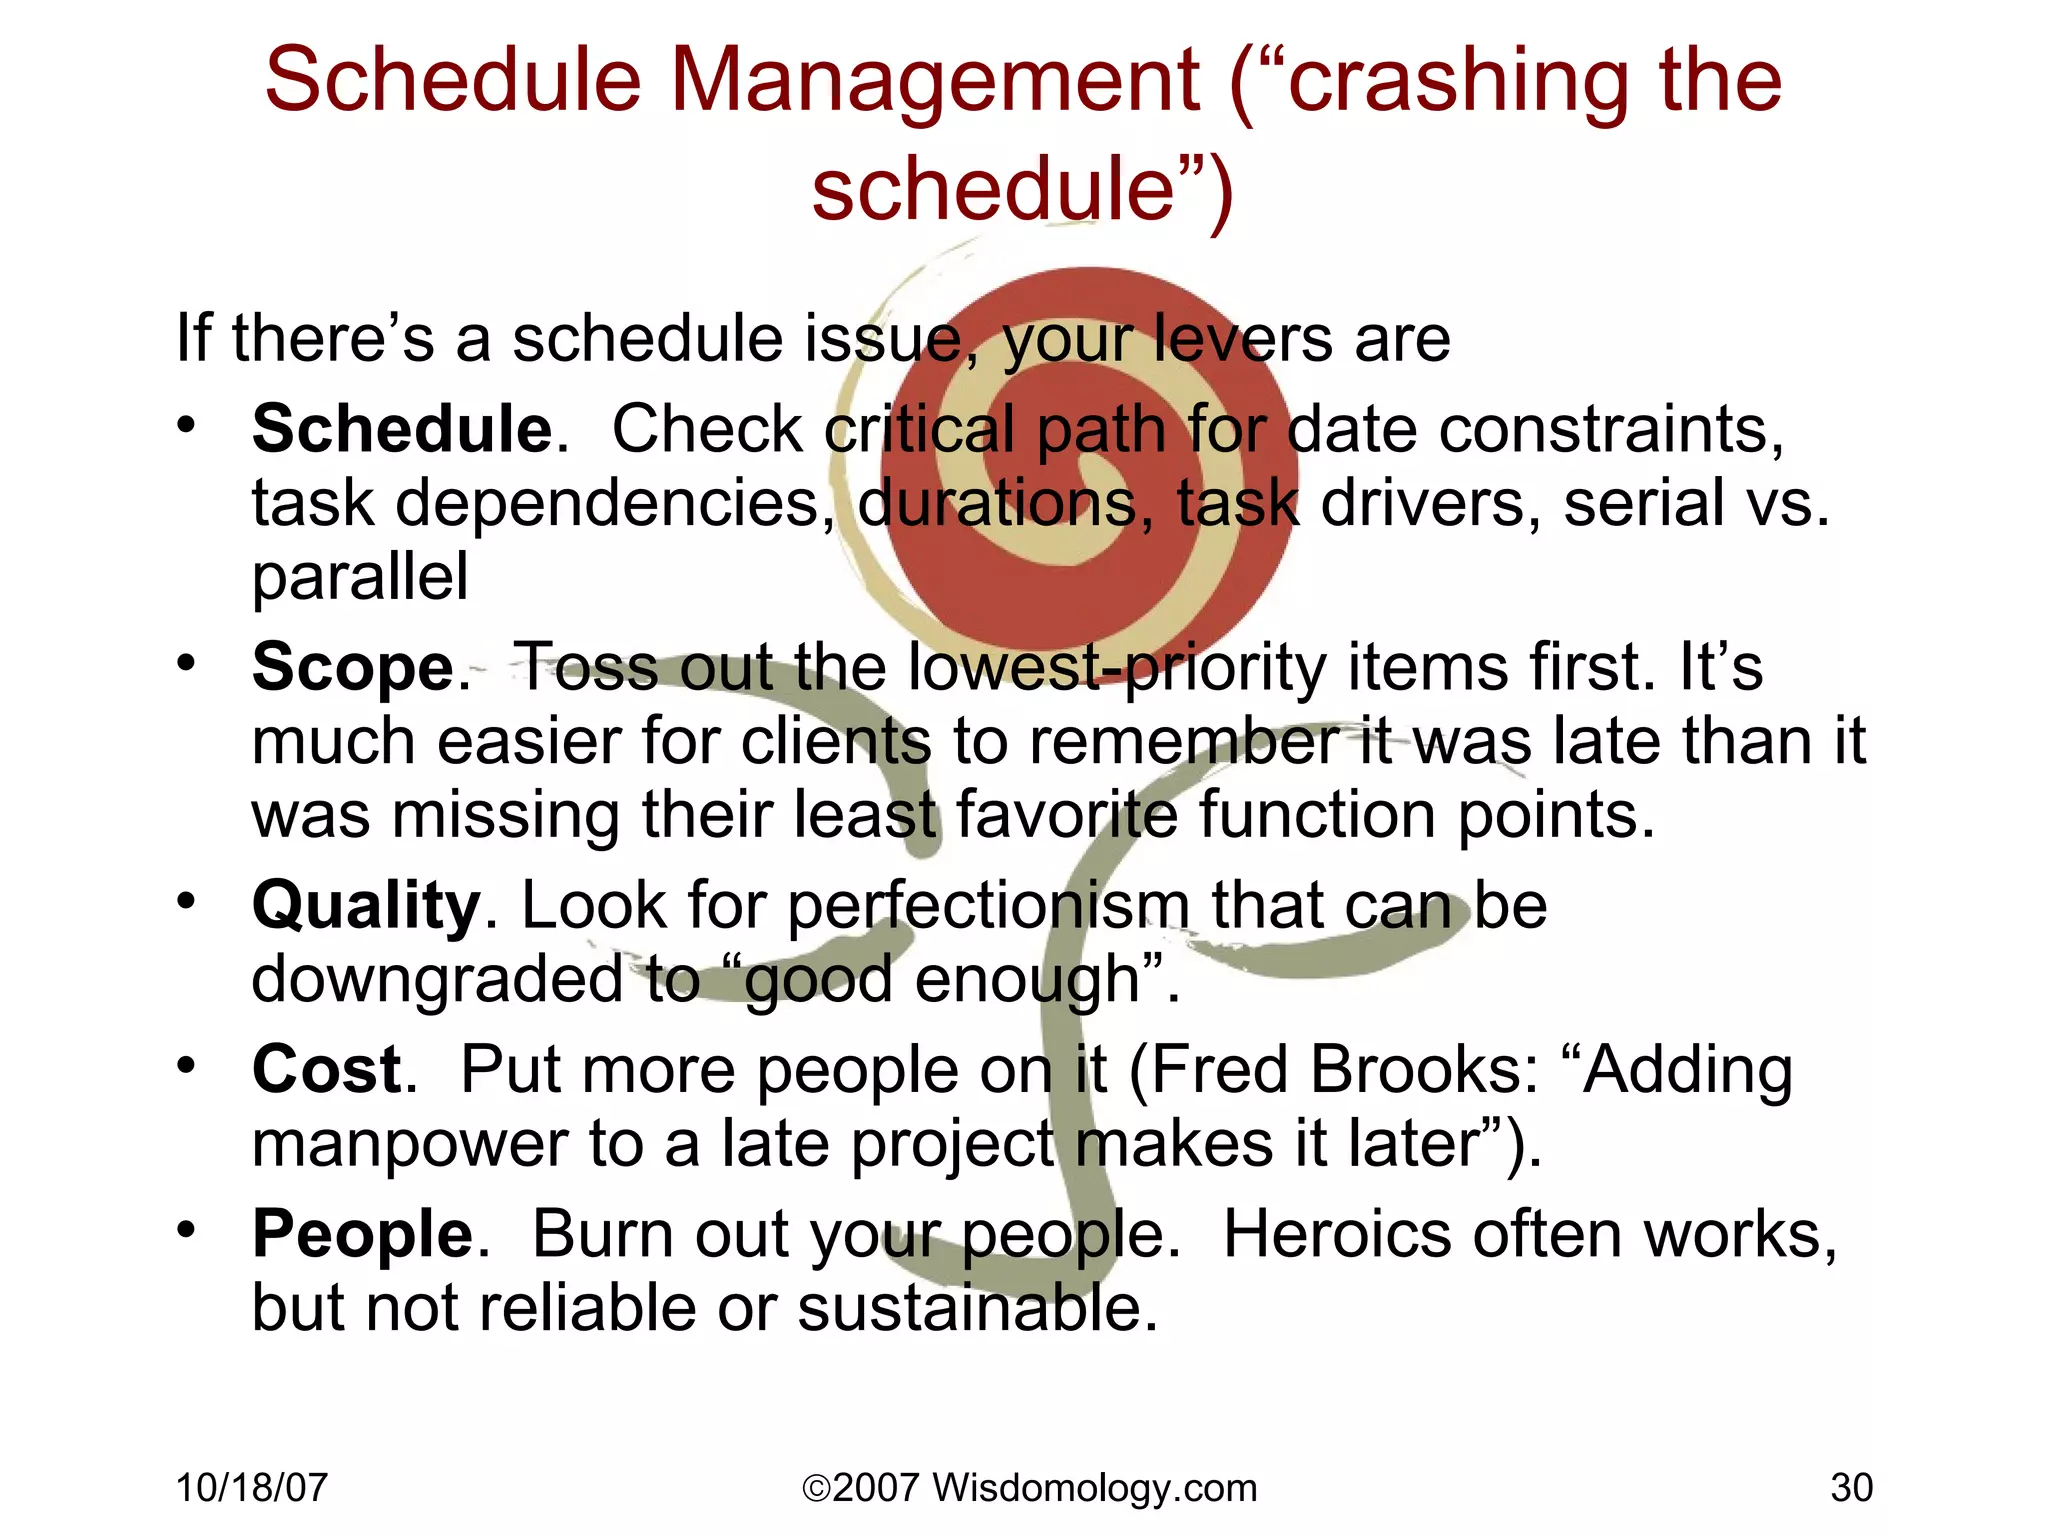
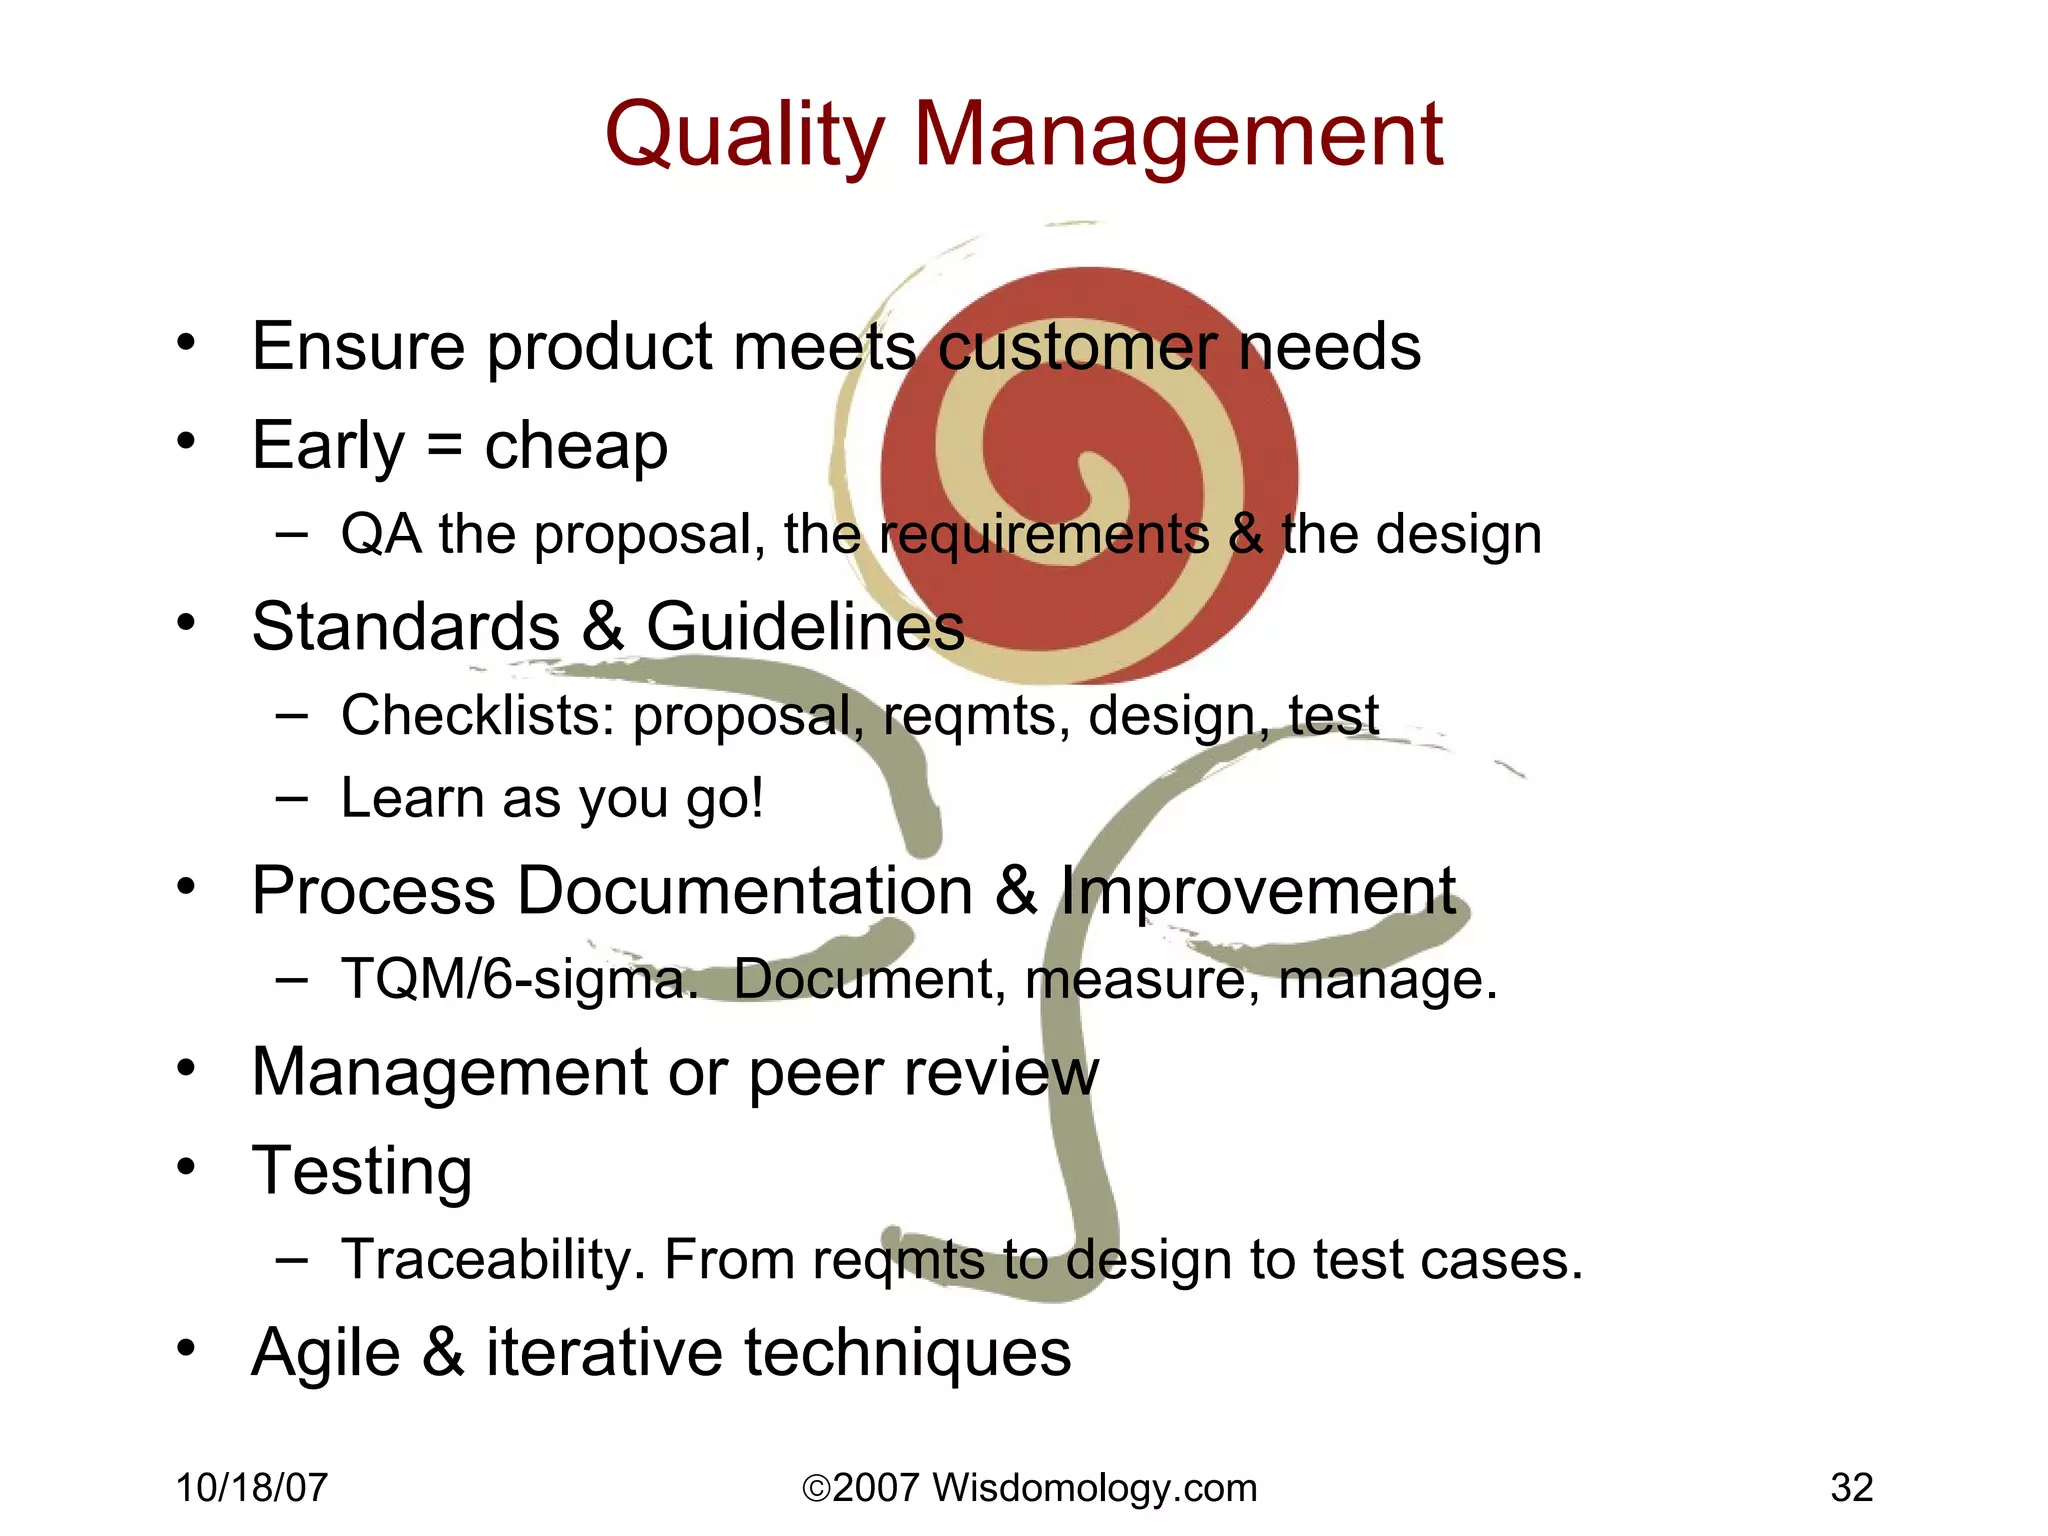
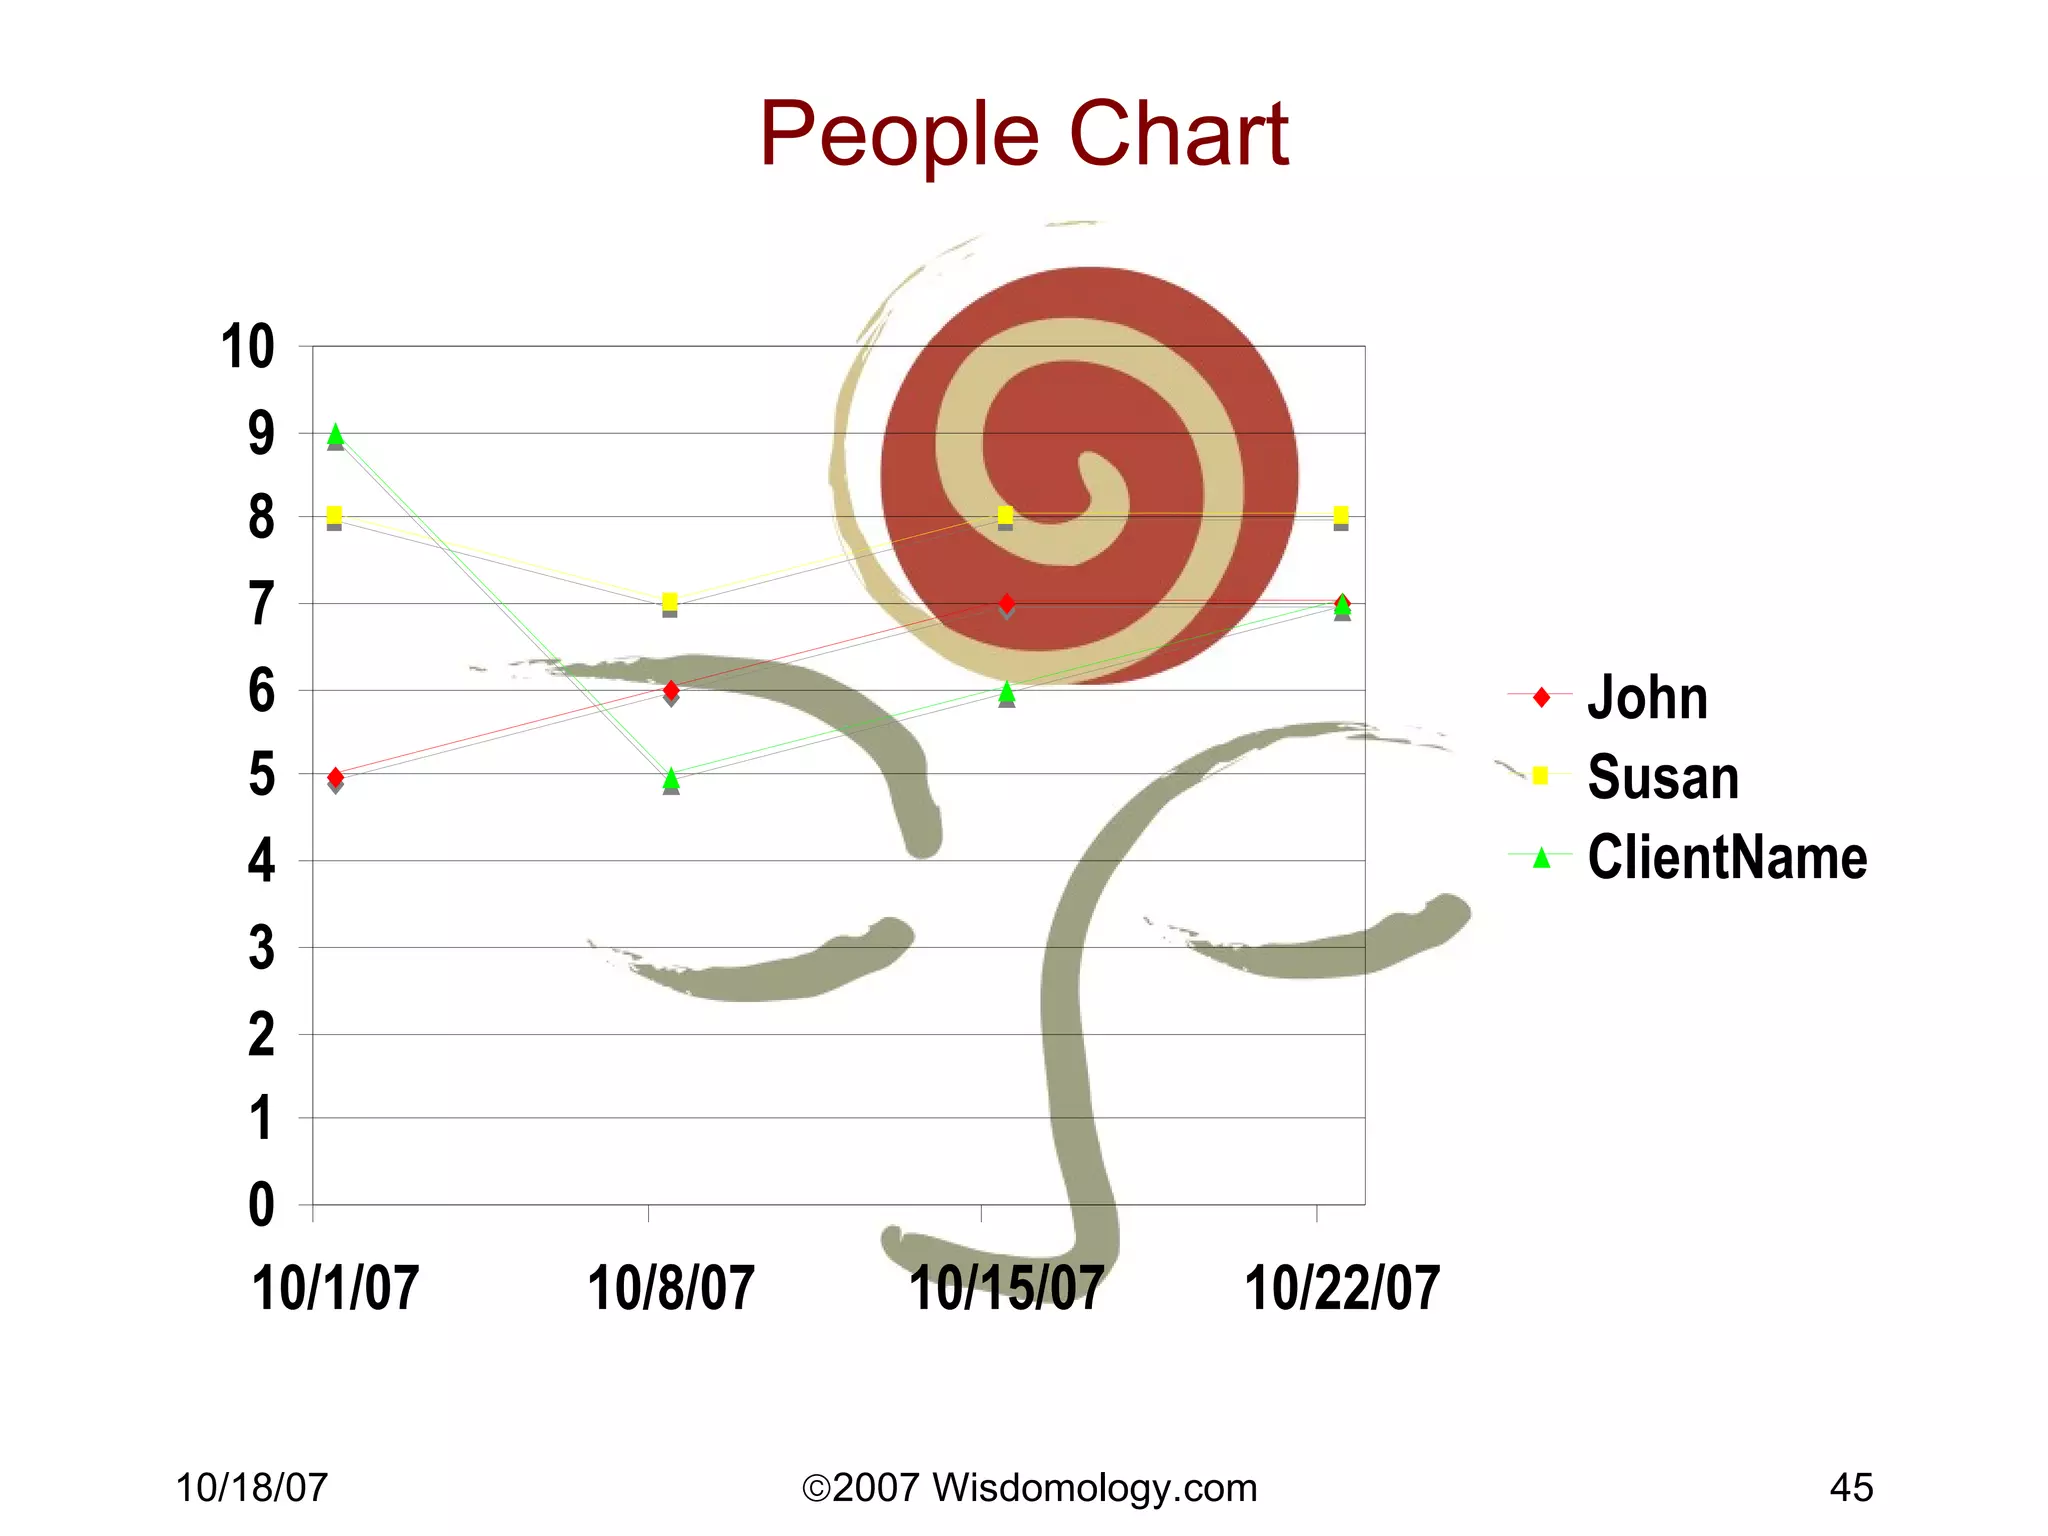
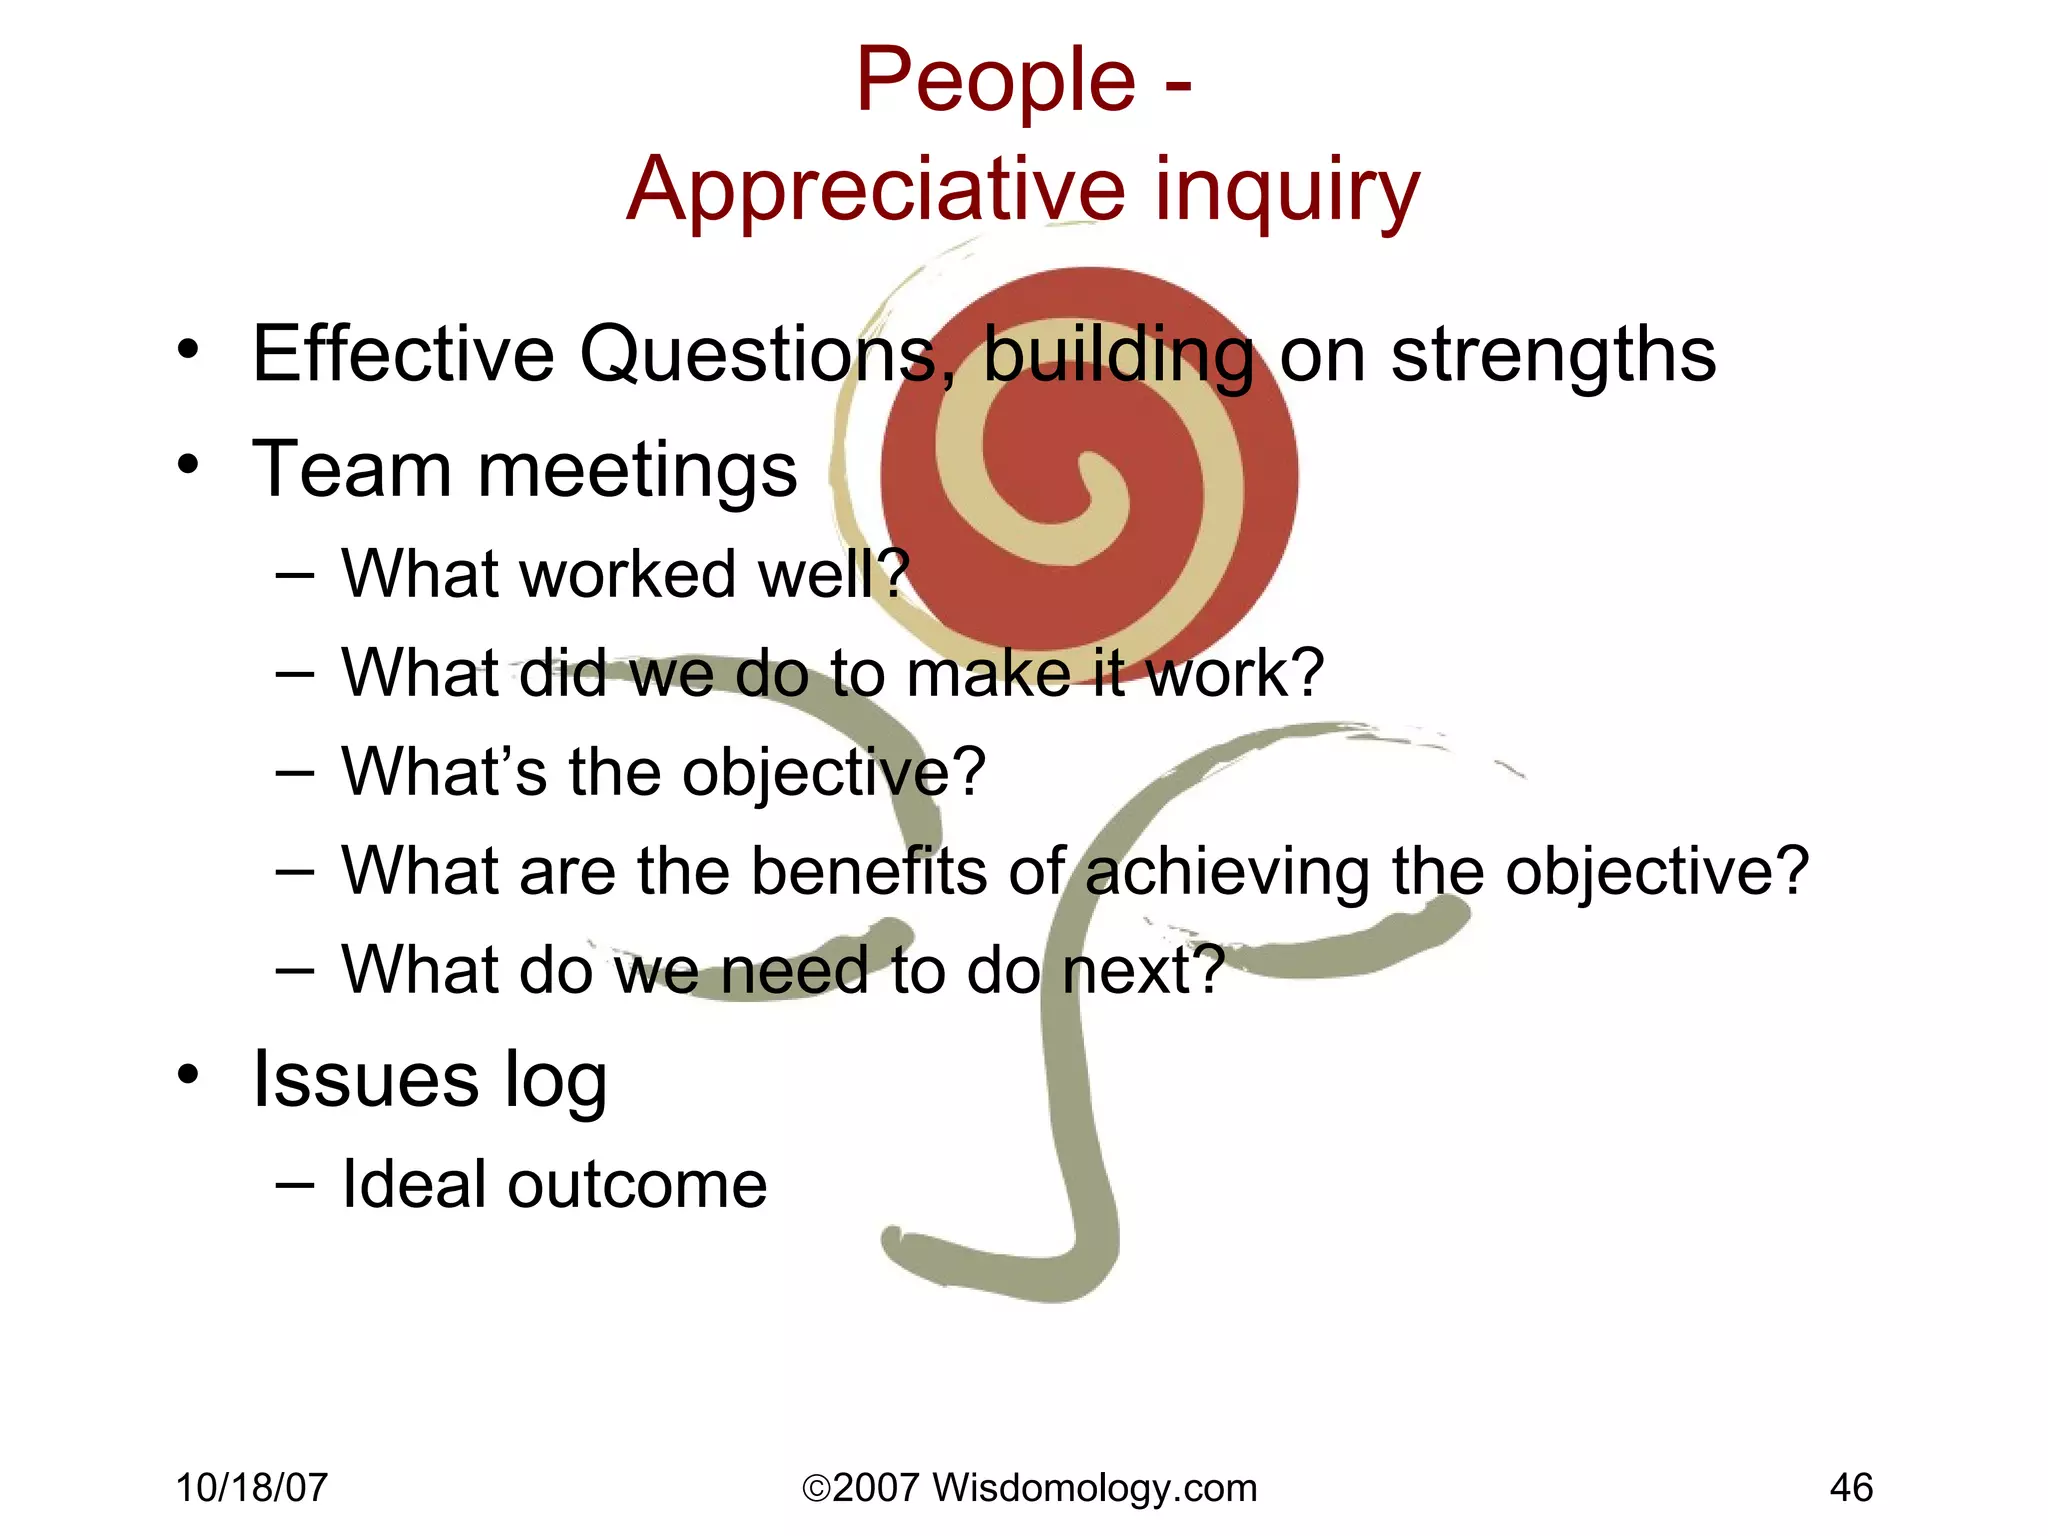
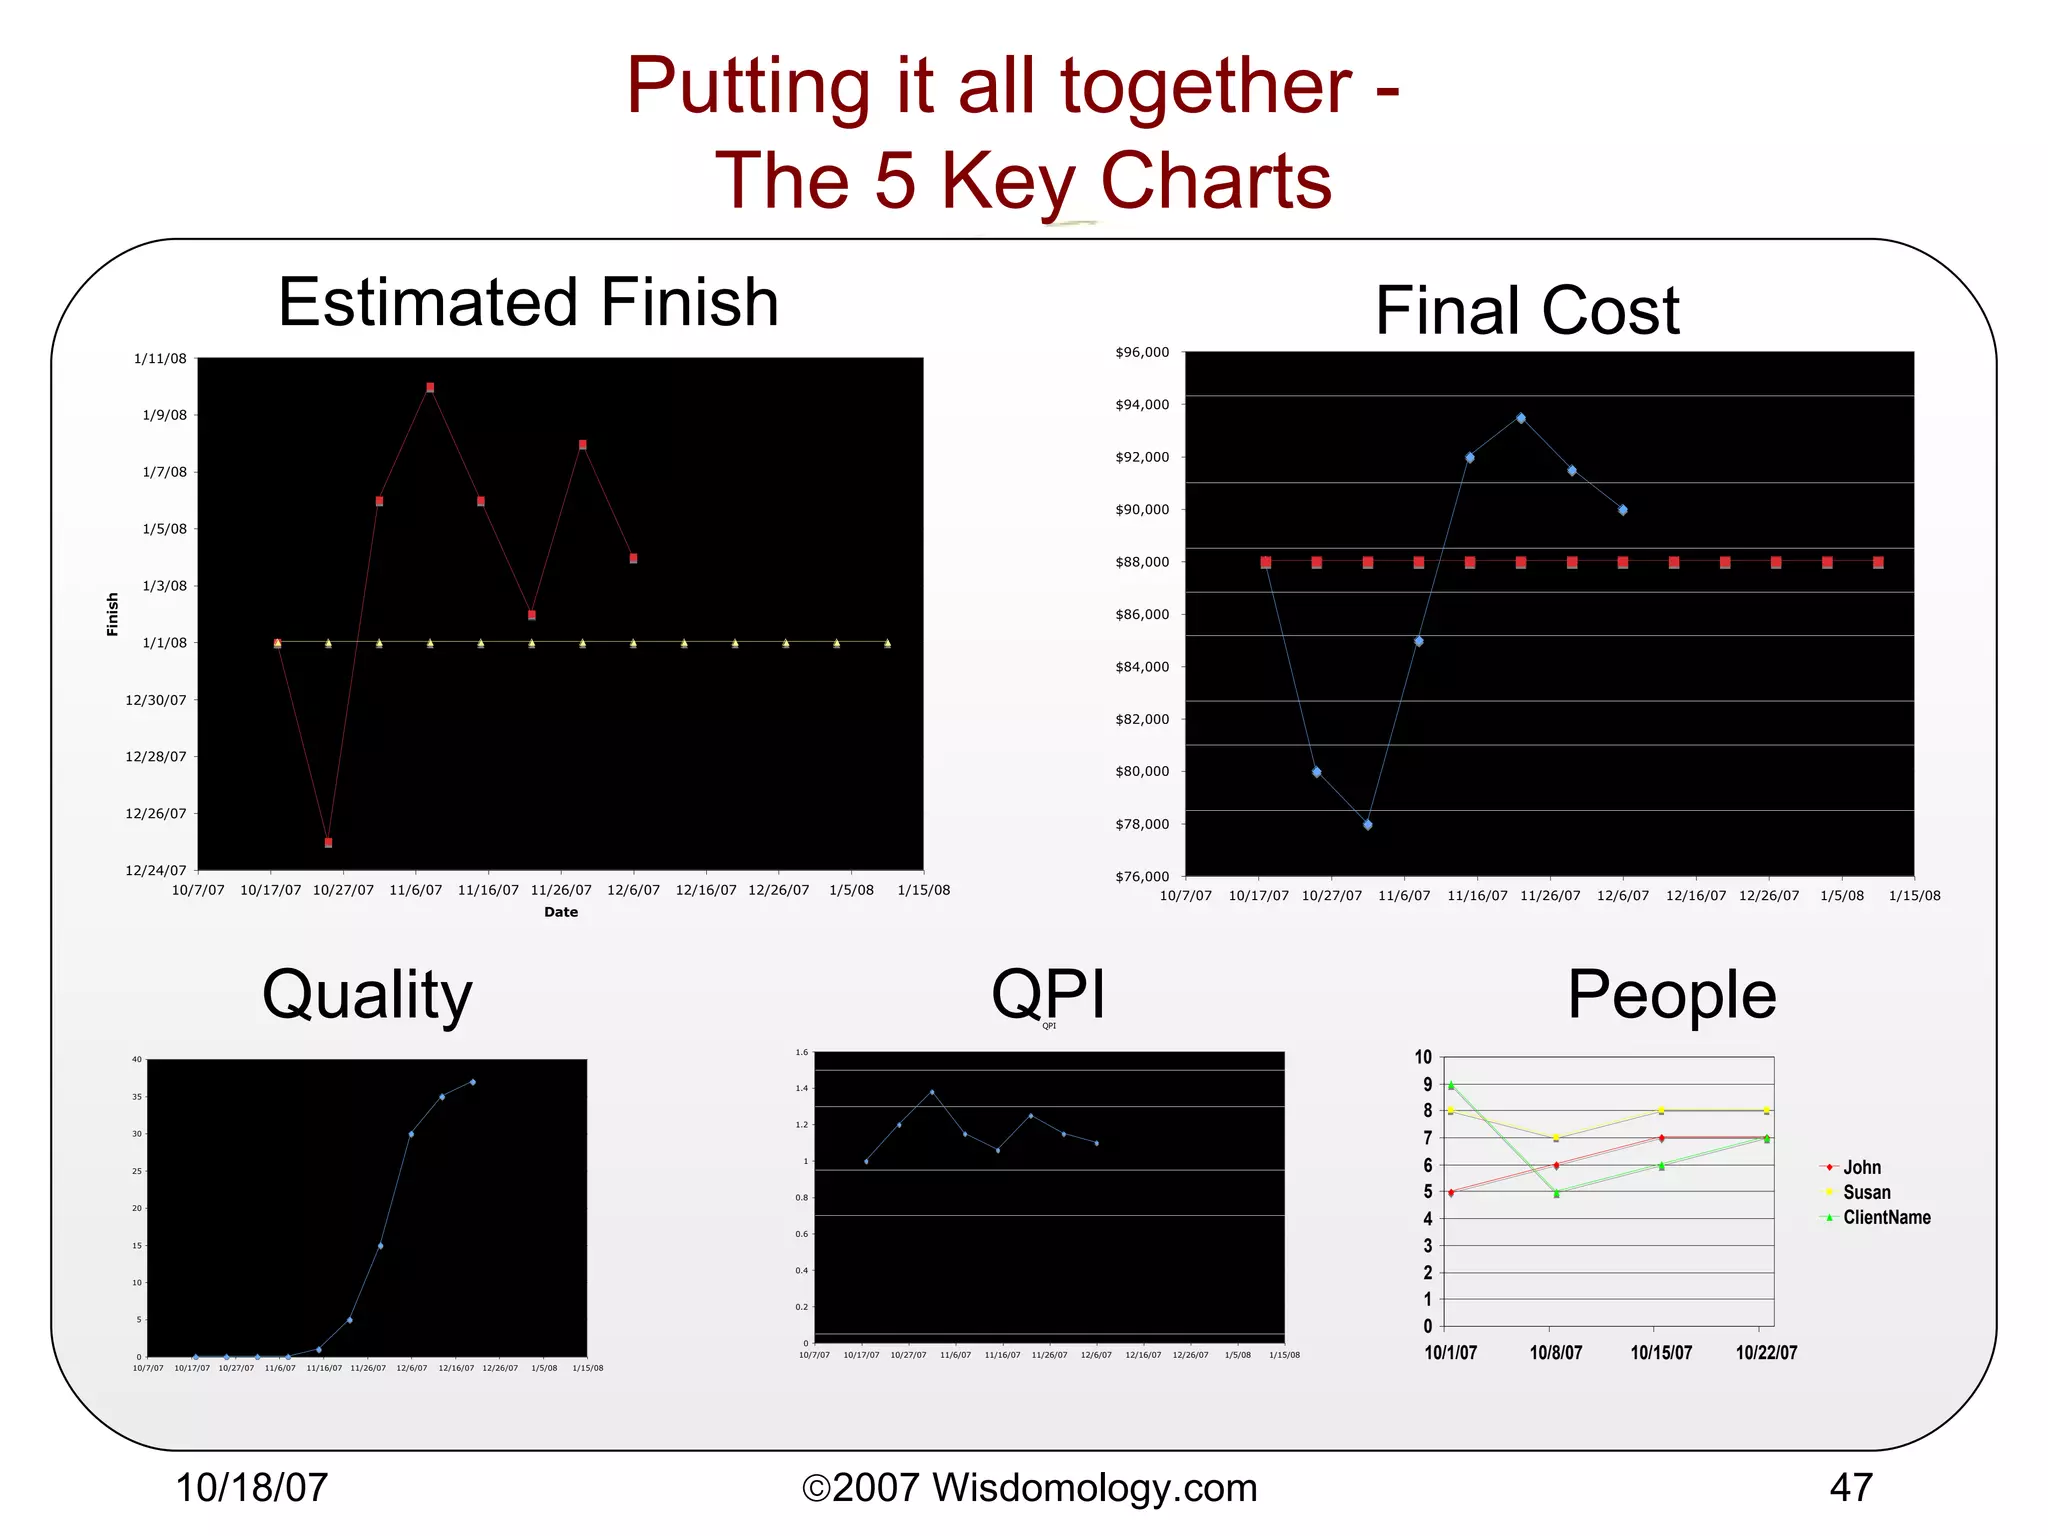
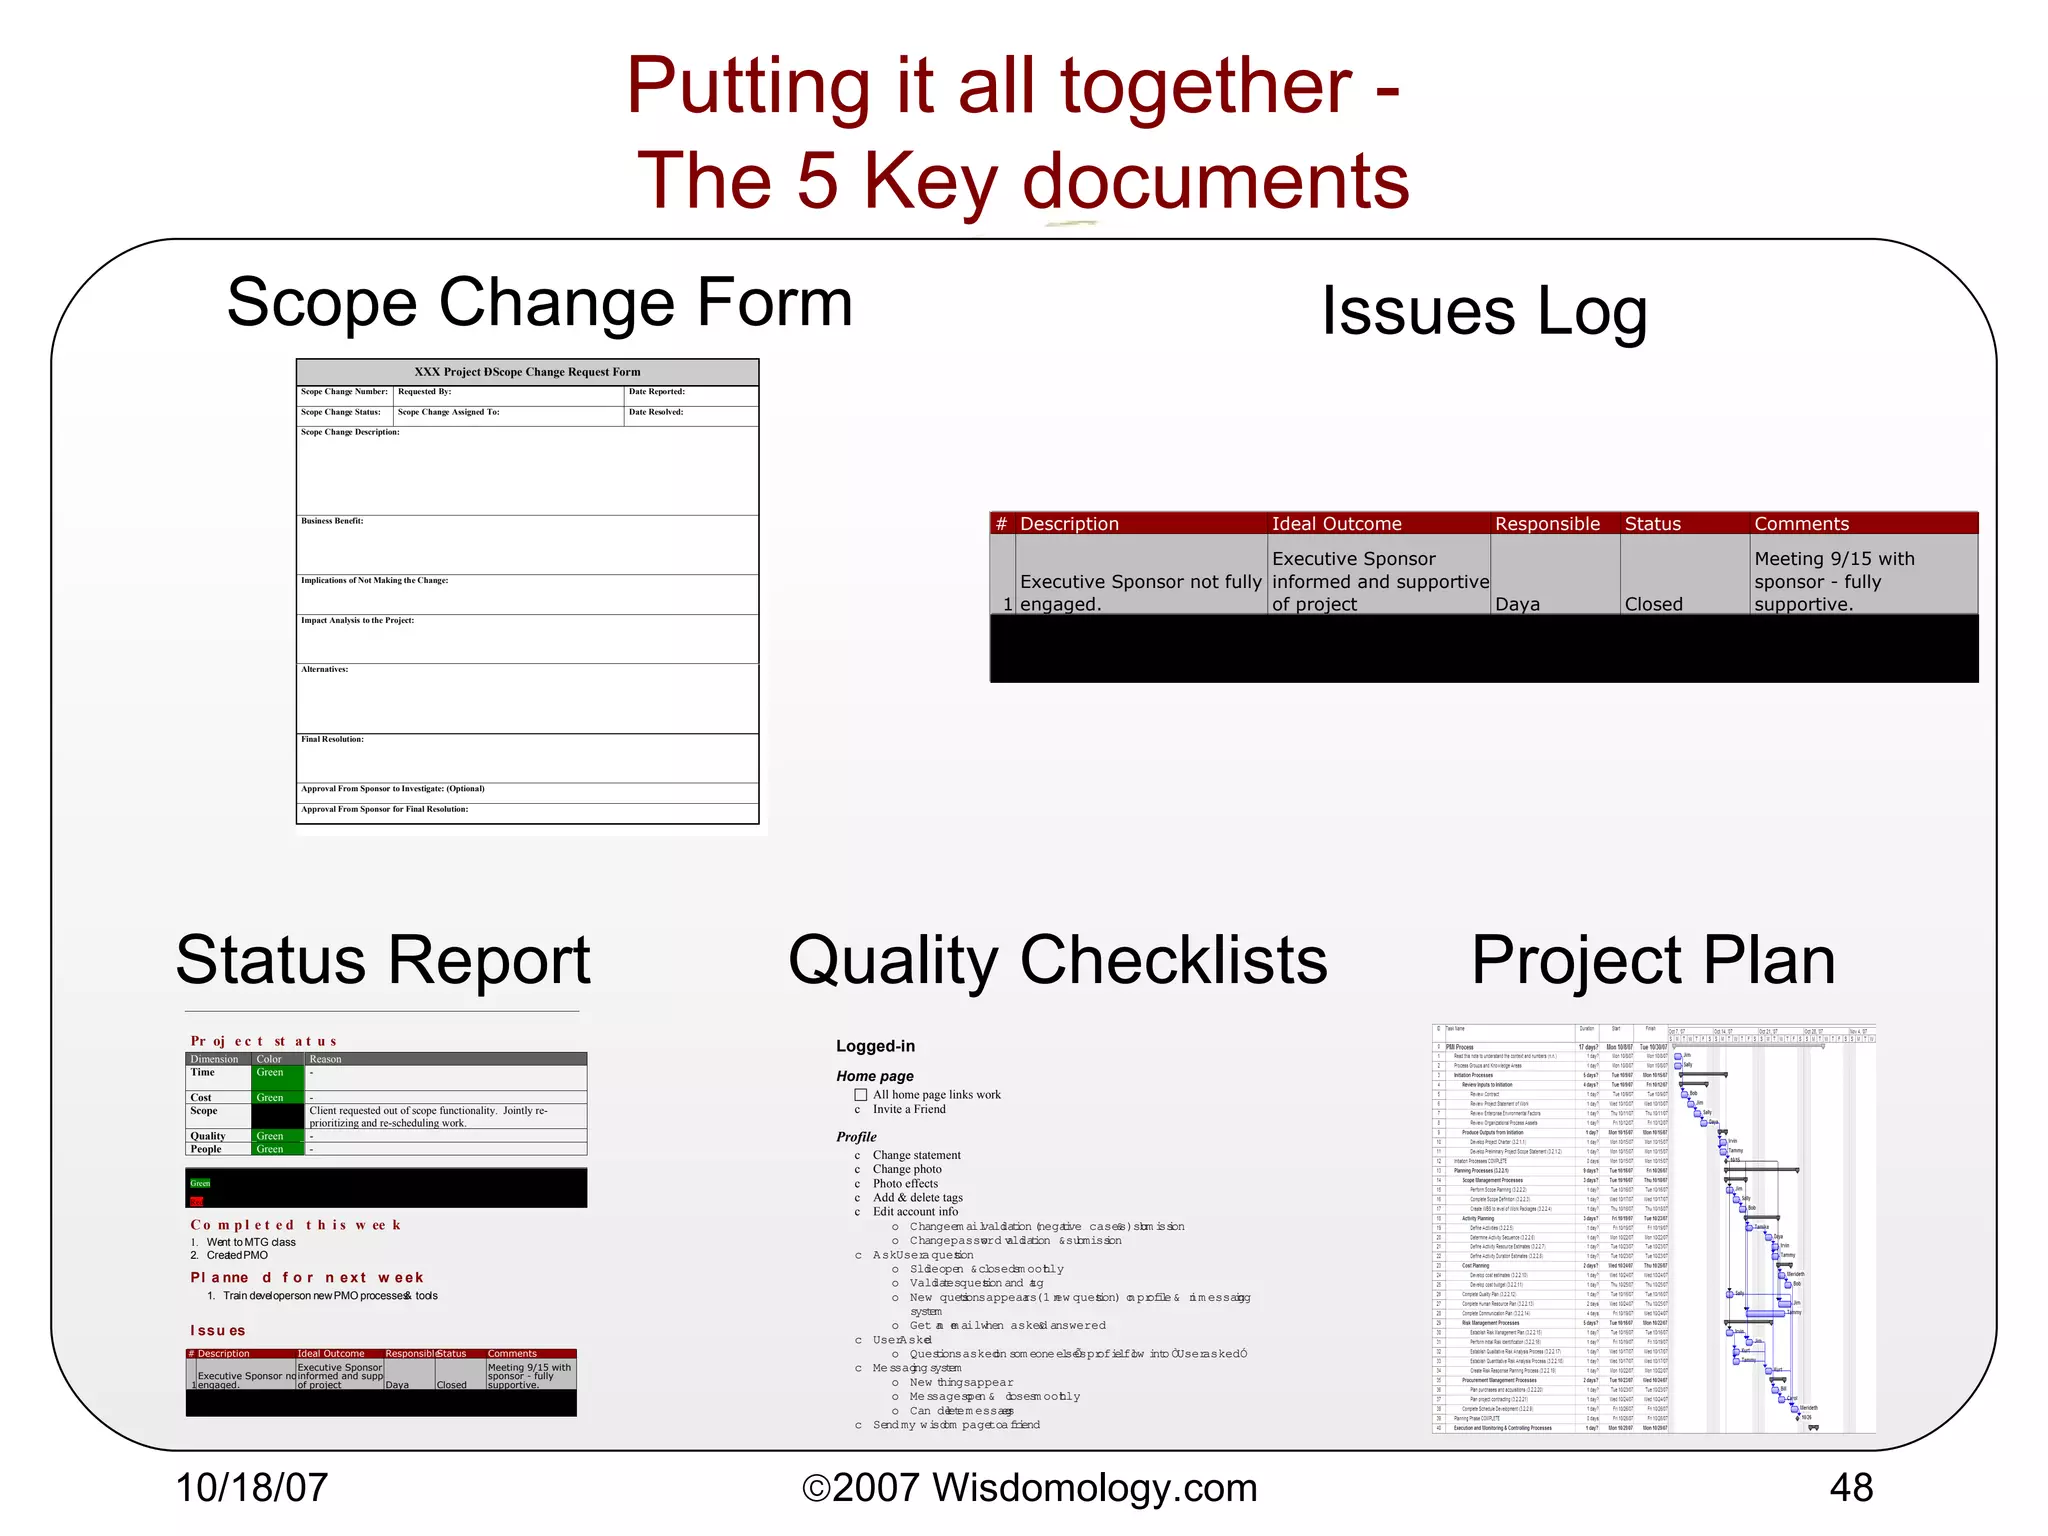
5 Key Chart Project Management (TM) Methodology

Loading...

Flash Player 9 (or above) is needed to view presentations.
We have detected that you do not have it on your computer. To install it, go here.

14 comments

Comments 1 - 10 of 14 previous next Post a comment

Comments 1 - 10 of 14 previous next

Post a comment
Embed Video
Edit your comment Cancel

58 Favorites & 1 Group

5 Key Chart Project Management (TM) Methodology - Presentation Transcript

  1. Project Management in Real Life How to balance creative chaos and control
  2. Objectives
    • Be able to implement at least one new project management tool tomorrow
    • Be able to eventually set up your own PMO
  3. Agenda
    • Why bother?
    • Project Management principles
      • Methodology
      • Scoping & Estimating
      • Planning
      • Managing
      • People
    • Agile techniques
      • Manifesto
      • Scrum, RUP, XP
      • Test-driven development
  4. Intros
    • Take 10 seconds to tell us
      • Your name
      • What you do
      • Your workshop goals
  5. Preview - The 5 Key Charts Estimated Finish Final Cost People QPI Quality
  6. Preview - The 5 Key documents Scope Change Form Issues Log Project Plan Status Report Quality Checklists
  7. Why Bother?
    • Your projects are late, over-budget, low margin, shipping with bugs
    • You & your team are pulling heroics to keep things under control
    • You & your team are burned out.
  8. Why Bother?
    • % of projects with large schedule slips
      • Software Engineering Institute
  9. What is a project?
    • Achieve objectives
    • Produce deliverables
    • Start and end date
    • Consume resources (people, $)
  10. Methodology
    • Methodology: codified, repeatable set of methods & tools
    • PM methodology
      • Set of standard PM processes & deliverables
    • Project Methodology
      • IT project: Propose, Define, Design, Develop, Test, Go-Live, Support
      • Construction: Feasibility, Planning & Design, Production, Turnover & Startup
      • RUP: Inception, Elaboration, Construction, Transition
  11. PM & Project Methodologies Propose Define Develop Conclude Design Test Structure & Plan Conclude Assess, Report, Control
    • Proposal
    • Proposal
    • Charter
    • Workplan
    • Milestones
    • Requiremts
    • Site map
    • Wireframes
    • Use cases
    • Graphic design
    • Technical architecture
    • Logical design
    • Physical design
    • System components
    • Unit
    • System
    • User acceptance
    • Documen-tation
    • Training
    • Code control
    • Scope Change Log
    • Issues Management Log
    • Risk Management Log
    • Weekly status reports
    • 5 Key charts
    • Customer feedback
    • Admin. closure
  12. The Scope Triangle Good Cheap Fast
  13. The Triangle, again Scope Specifications/ Quality Time/ Schedule Budget/ Cost
  14. Scoping
    • Proposal/Charter/Statement of Work/Contract
      • Objectives: Specific, Measurable, Attainable, Reach (realistic), Time-bound
      • Deliverables: Include PM & standard project deliverables from methodology!
      • Functionality In scope & Out of scope
      • Schedule
      • Team (Roles & Responsibilities)
      • Process: Include PM!
      • Terms
      • Cost
    • Requirements/Design/Specs
  15. Estimating
    • Decomposition (microscopic/bottom-up)
      • Have at least 2 levels of abstraction
    • Analogy (micro or macro)
      • Delphi with feedback: get experts to go away & estimate, bring group together & show estimates, then re-estimate.
    • Macro
      • Modeling (heuristic, phenomenological). Derived from basic “physics” about how projects work. Observe key project variables (time, money, scope, quality, people) and make an equation. Use Excel to get a regression.
      • Design to cost or duration. Here’s what we can do with what’s available.
    • PERT t e =(best case + worst case + 4*most likely)/6
  16. Planning the work
    • ODW
      • Objectives --> Deliverables --> Workplan
    • WBS
      • Break down by phase, by product, activity, location…
    • Uniqueness
      • OAK: One Arse to Kick. Exactly one person’s name per task, or no-one’s responsible. (No organizations.)
      • One task for a given person & date combo
    • Grammar
      • Tasks verb-noun, “Complete design document”
      • Milestones noun-verb, “Design Complete”
  17. Planning the work, 2
    • Effort versus Duration
      • Effort (work) is the number of person-hours expended to do the task.
      • Duration is how long it takes from beginning to end.
      • Duration = work/resource allocation
    • Tips
      • Tasks, dependencies, durations, resources
      • Use F-S relationships
      • Ask the people doing the tasks for estimates!!
      • Tasks 0.5 to 10 days, ideal 2-5 days
      • Milestones & summary tasks - no person names
      • Beware the Mythical Man-Month (Fred Brooks)!
  18. Planning Tools
    • Stickies, index cards, string, whiteboard
      • Great for brainstorming, communicating!
    • Word & Excel
      • Simple to-do list, no dependencies, little tracking.
      • Task, Due, Responsible, Status
    • “ Groupware”
      • Track & communicates to-do’s, milestones, files
      • BaseCamp, SharePoint
      • Bugzilla, Mantis, Trac - issue tracking
    • Desktop tools
      • MSProject - de facto standard
      • OmniPlan, Merlin, some web-based
    • Portfolio Management (Enterprise)
      • MSProject Sever, Project.net, Primavera, Clarity
  19. Views - Gantt chart
  20. Views - Network Diagram (PERT chart)
  21. Working the plan
    • Baselining
    • Tracking Gantt
    • Binary statusing
    • “ Plan at level 3, manage at level 2”
    • Action Items versus updating plan
    • When does it go on the plan (versus in someone’s to-do list?)
      • When it’s required to complete a deliverable
      • When someone else is dependent on the output
      • When it’s longer than x hours (4) in effort
      • When it’s important enough for the team to know about
  22. Working the plan 2
    • Meetings
      • Collaborative plan development
      • First use Gantt to walk everyone through the plan (1+ hours)
      • Then can use personal to-do lists from PM tool
  23. Critical Path Management
    • Critical Path is the longest path through the project plan. If any task on the critical path slips, the end date slips. Zero float.
    • Must have successors to each task (dependencies) to calculate
    • Possible to have multiple critical branches.
    • “ Float” = duration until critical, =LF-EF
    • “ Manage The Critical Path”
      • And then know what’s likely to become critical.
      • If you’re strapped for time, make sure you at least know what’s going on with your critical path.
  24. Views - Tracking Gantt
  25. Resource Leveling
    • MSProject or other PM tool
      • Use Resource Usage view, adjust hours in daily yellow blocks
      • Move start date, stretch duration of non-critical tasks, reassign.
    • Otherwise
      • Spreadsheet: People on one axis, days/weeks on other, hours in cells
    • Look out for micro-managing
  26. Views - Resource Graph
  27. Views - Resource Usage
  28. Scope Management
    • Scope Change Request Form
      • Client fills out form
      • Estimator estimates
      • Client approves/denies
      • Work begins
    • Scope Change Log
    • Note well: ANY Change Request takes resources to process, even if it’s a zero-dollar, zero-time change.
  29. Scope change request form
  30. Schedule Management (“crashing the schedule”)
    • If there’s a schedule issue, your levers are
    • Schedule . Check critical path for date constraints, task dependencies, durations, task drivers, serial vs. parallel
    • Scope . Toss out the lowest-priority items first. It’s much easier for clients to remember it was late than it was missing their least favorite function points.
    • Quality . Look for perfectionism that can be downgraded to “good enough”.
    • Cost . Put more people on it (Fred Brooks: “Adding manpower to a late project makes it later”).
    • People . Burn out your people. Heroics often works, but not reliable or sustainable.
  31. Estimated Finish Chart
  32. Quality Management
    • Ensure product meets customer needs
    • Early = cheap
      • QA the proposal, the requirements & the design
    • Standards & Guidelines
      • Checklists: proposal, reqmts, design, test
      • Learn as you go!
    • Process Documentation & Improvement
      • TQM/6-sigma. Document, measure, manage.
    • Management or peer review
    • Testing
      • Traceability. From reqmts to design to test cases.
    • Agile & iterative techniques
  33. Quality Measurement Tests passed
  34. Example regression test checklist
  35. Budget Management
    • Final project cost
      • Estimate weekly & chart
      • Forces PM to know how much has been spent, how much is estimated to be spent
    • QPI = Quick Performance Index
      • % spent / % done
      • Like earned value (get $ credit for tasks completed), but easier to compute & more sensitive to decisions - watch the trend.
      • 1.0 = “ideal”
      • >1 = spending too fast or investing or making advance payments
      • <1 = usually not fully resourced, going to miss date.
  36. Final project cost
  37. Quick Performance Index
  38. Issues Management
    • Issue = an item which potentially impacts scope, quality, cost, schedule, or people.
    • Issue reporting process
      • Anyone can report an issue.
      • First to PM
      • Escalate if necessary through management.
      • PM owns the “logging & dogging” of all project issues.
      • All issues reported on weekly status report.
    • Issue log or tracking system
  39. Issue log
  40. Status report
  41. Risk Management
    • Description - what can we videotape going wrong?
    • Avoidance - get to not happen
    • Contingency - what we do if it does happen
    • Probability - how likely to happen (H/M/L or numeric or percentage)
    • Severity - damage caused if it happened (H/M/L or numeric or $$)
  42. Program management
    • Status
    • Critical Path
    • Issues Management
    • Dashboard
    • KPI’s
      • 5 key charts and/or other measures
  43. Program dashboard
    • Green = on track
    • Yellow = issues, may not make it
    • Red = not going to make it, or didn’t
  44. People
    • The soft part is the hard part
    • People are the most complex & least understood driver of success.
      • Energy level, skills, focus, personality, values, experiences, feelings, culture.
      • Overwork, multitasking, clear objectives, clear role, trust, communication.
    • Use the “People Chart”!
      • Names: Mood, Morale, Project Confidence Chart
      • Look for scatter and for trends.
      • The process itself is healthy & expressive.
  45. People Chart
  46. People - Appreciative inquiry
    • Effective Questions, building on strengths
    • Team meetings
      • What worked well?
      • What did we do to make it work?
      • What’s the objective?
      • What are the benefits of achieving the objective?
      • What do we need to do next?
    • Issues log
      • Ideal outcome
  47. Putting it all together - The 5 Key Charts Estimated Finish Final Cost People QPI Quality
  48. Putting it all together - The 5 Key documents Scope Change Form Issues Log Project Plan Status Report Quality Checklists
  49. Key agile principles
    • Agilemanifesto.org
    • Early and continuous delivery of valuable software.
    • Welcome changing requirements, even late in development.
    • Trust team
    • Face-to-face conversation.
    • Working software is the primary measure of progress.
    • Sustainable development.
    • Simplicity--the art of maximizing the amount of work not done--is essential.
    • Self-organizing teams.
  50. Scrum
    • One month timeboxes - working tested software at end.
    • Don’t add to iteration
    • Self-organizing teams
    • Daily build
    • Daily Scrum meetings
      • 10-15 minutes
      • What have you done since last time, what plans till next time, what are your blocks?
      • Blocks gone in 1 day, decisions in 1 hour
    • Product & Release Backlog
    • Sprint “burndown”
    • Scrum master firewall
  51. Example Burndown
  52. Extreme Programming (XP)
    • Planning Game (story cards)
    • Small, frequent releases
    • System metaphors
    • Simple design
    • Testing
    • Frequent refactoring
    • Pair programming
    • Team code ownership
    • Continuous integration
    • Sustainable pace
    • Whole team together
    • Coding standards
  53. RUP (Unified Process)
    • Short timeboxed iterations - peeling the onion.
    • Phased approach
      • Inception - Establish a common vision
      • Elaboration - Build & test risky core
      • Construction - Build & test the rest
      • Transition - Deploy
    • Develop high-risk & high-value elements first
    • Accommodate change early
    • 50 optional “artifacts”, models
    • Manage requirements
    • Visual modeling (UML)
    • Continuously verify quality
  54. Resources
    • PMI - Project Management Institute: www.pmi.org
    • PMBOK - Project Management Body of Knowledge
    • AgileManifesto.org, AgileAlliance.org
    • Craig Larman Agile & Iterative Development
SlideShare Zeitgeist 2009

+ jmcmahon89jmcmahon89 Nominate

custom

4801 views, 58 favs, 4 embeds more stats

Supercharge and streamline your project management more

More info about this document

© All Rights Reserved

Go to text version

  • Total Views 4801
    • 4793 on SlideShare
    • 8 from embeds
  • Comments 14
  • Favorites 58
  • Downloads 0
Most viewed embeds
  • 4 views on http://www.pmknowledge.info
  • 2 views on http://www.honeymooninginindia.com
  • 1 views on http://mleon.tumblr.com
  • 1 views on http://127.0.0.1:51235

more

All embeds
  • 4 views on http://www.pmknowledge.info
  • 2 views on http://www.honeymooninginindia.com
  • 1 views on http://mleon.tumblr.com
  • 1 views on http://127.0.0.1:51235

less

Flagged as inappropriate Flag as inappropriate
Flag as inappropriate

Select your reason for flagging this presentation as inappropriate. If needed, use the feedback form to let us know more details.

Cancel
File a copyright complaint
Having problems? Go to our helpdesk?

Categories

Groups / Events