Download as PDF, PPTX
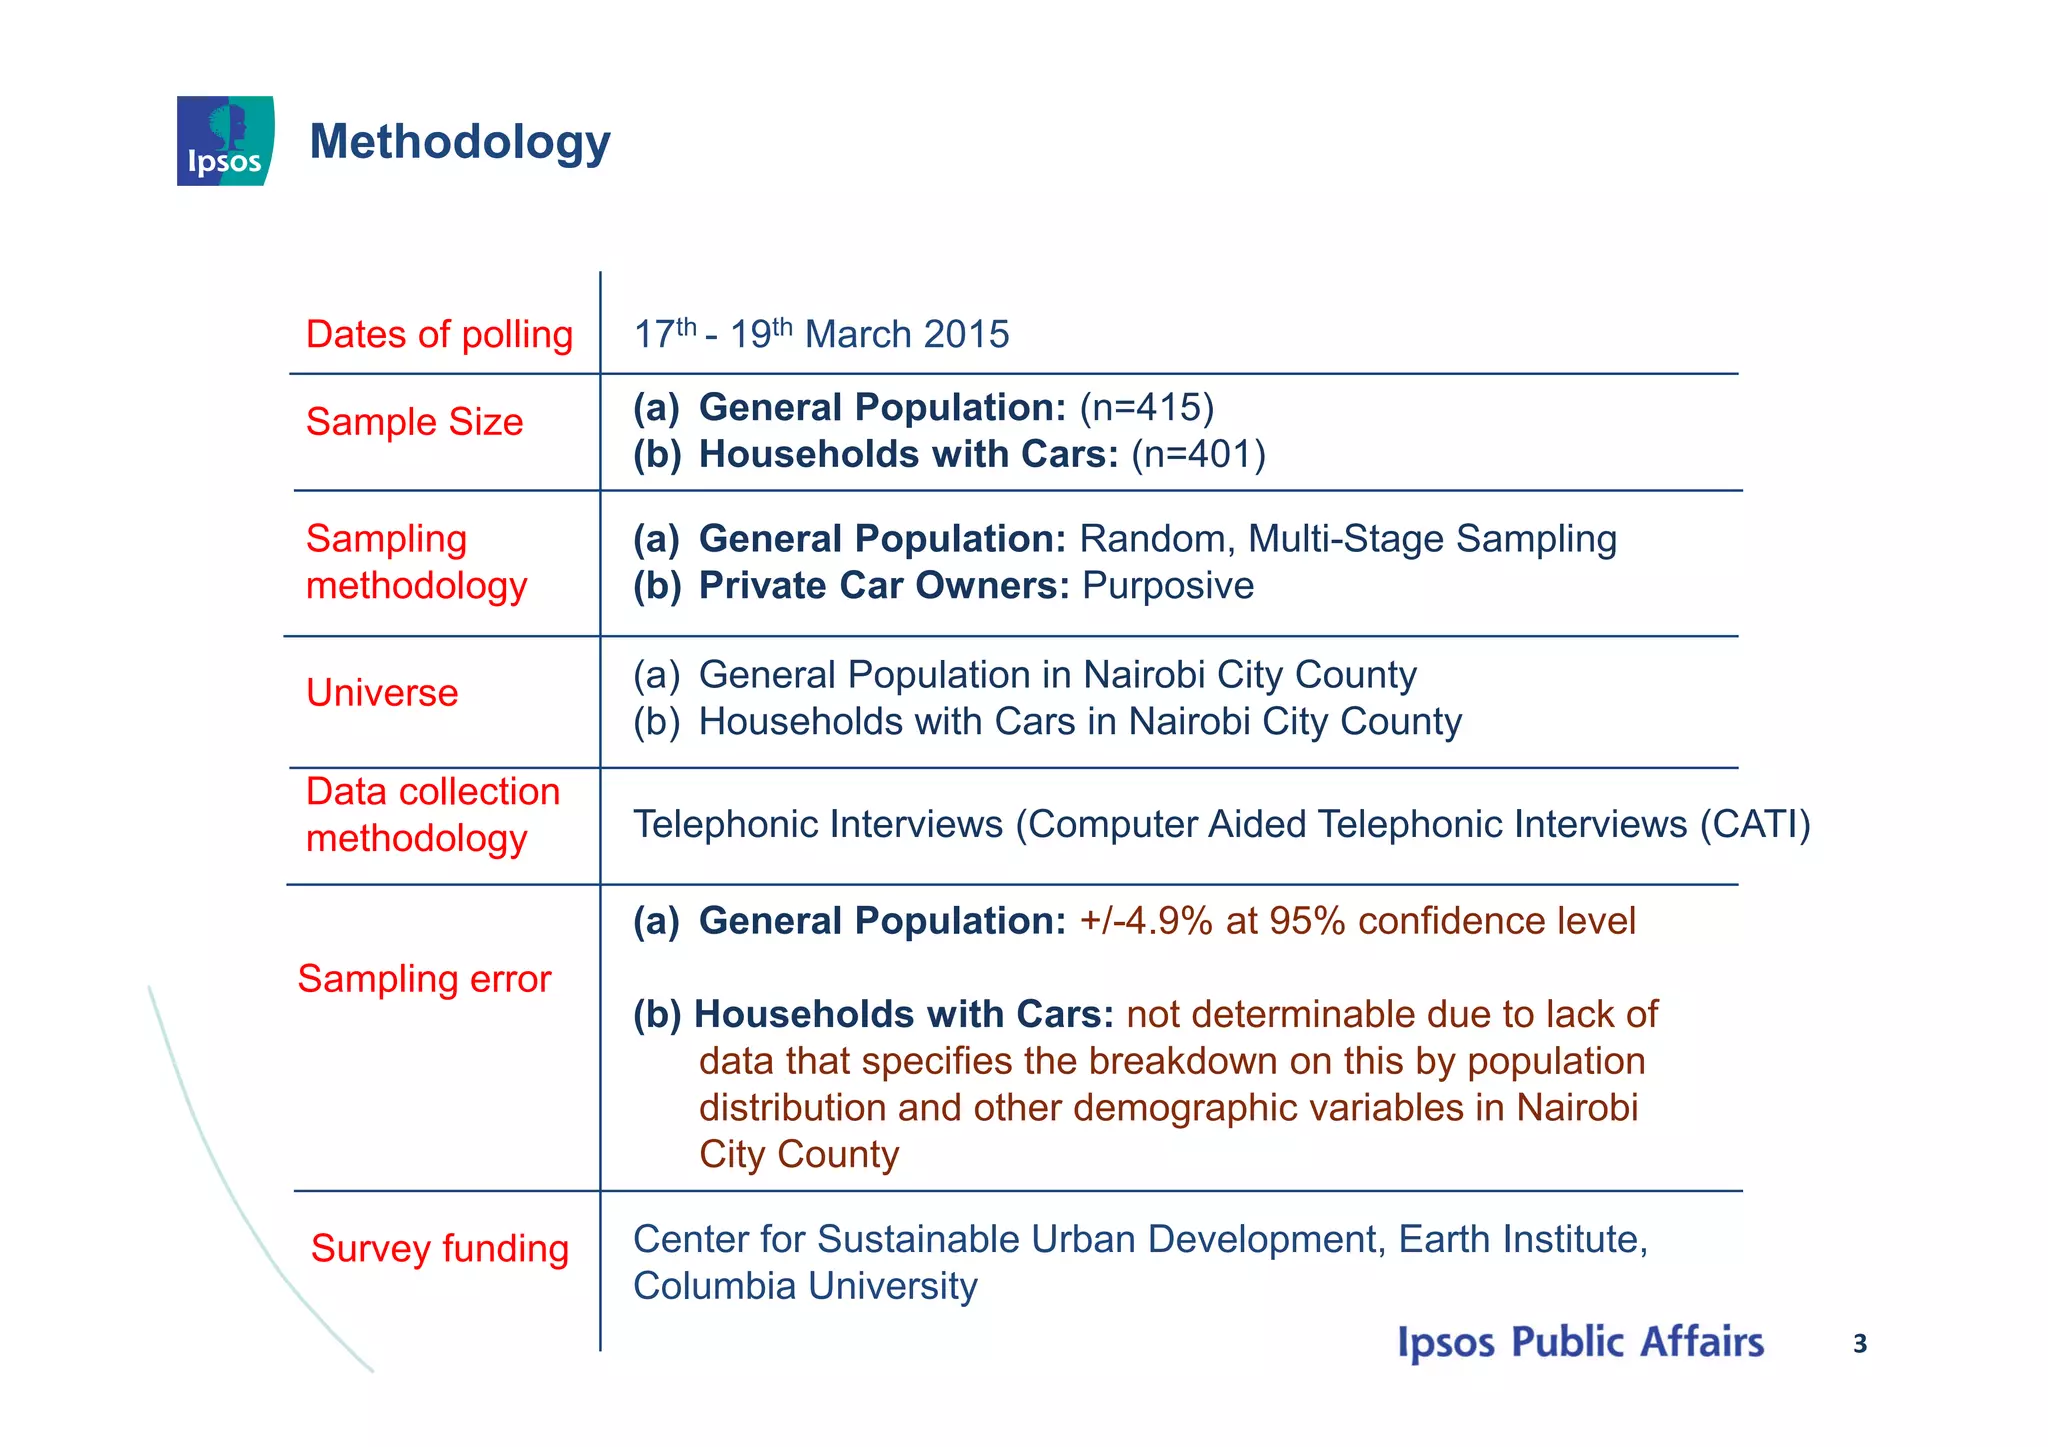
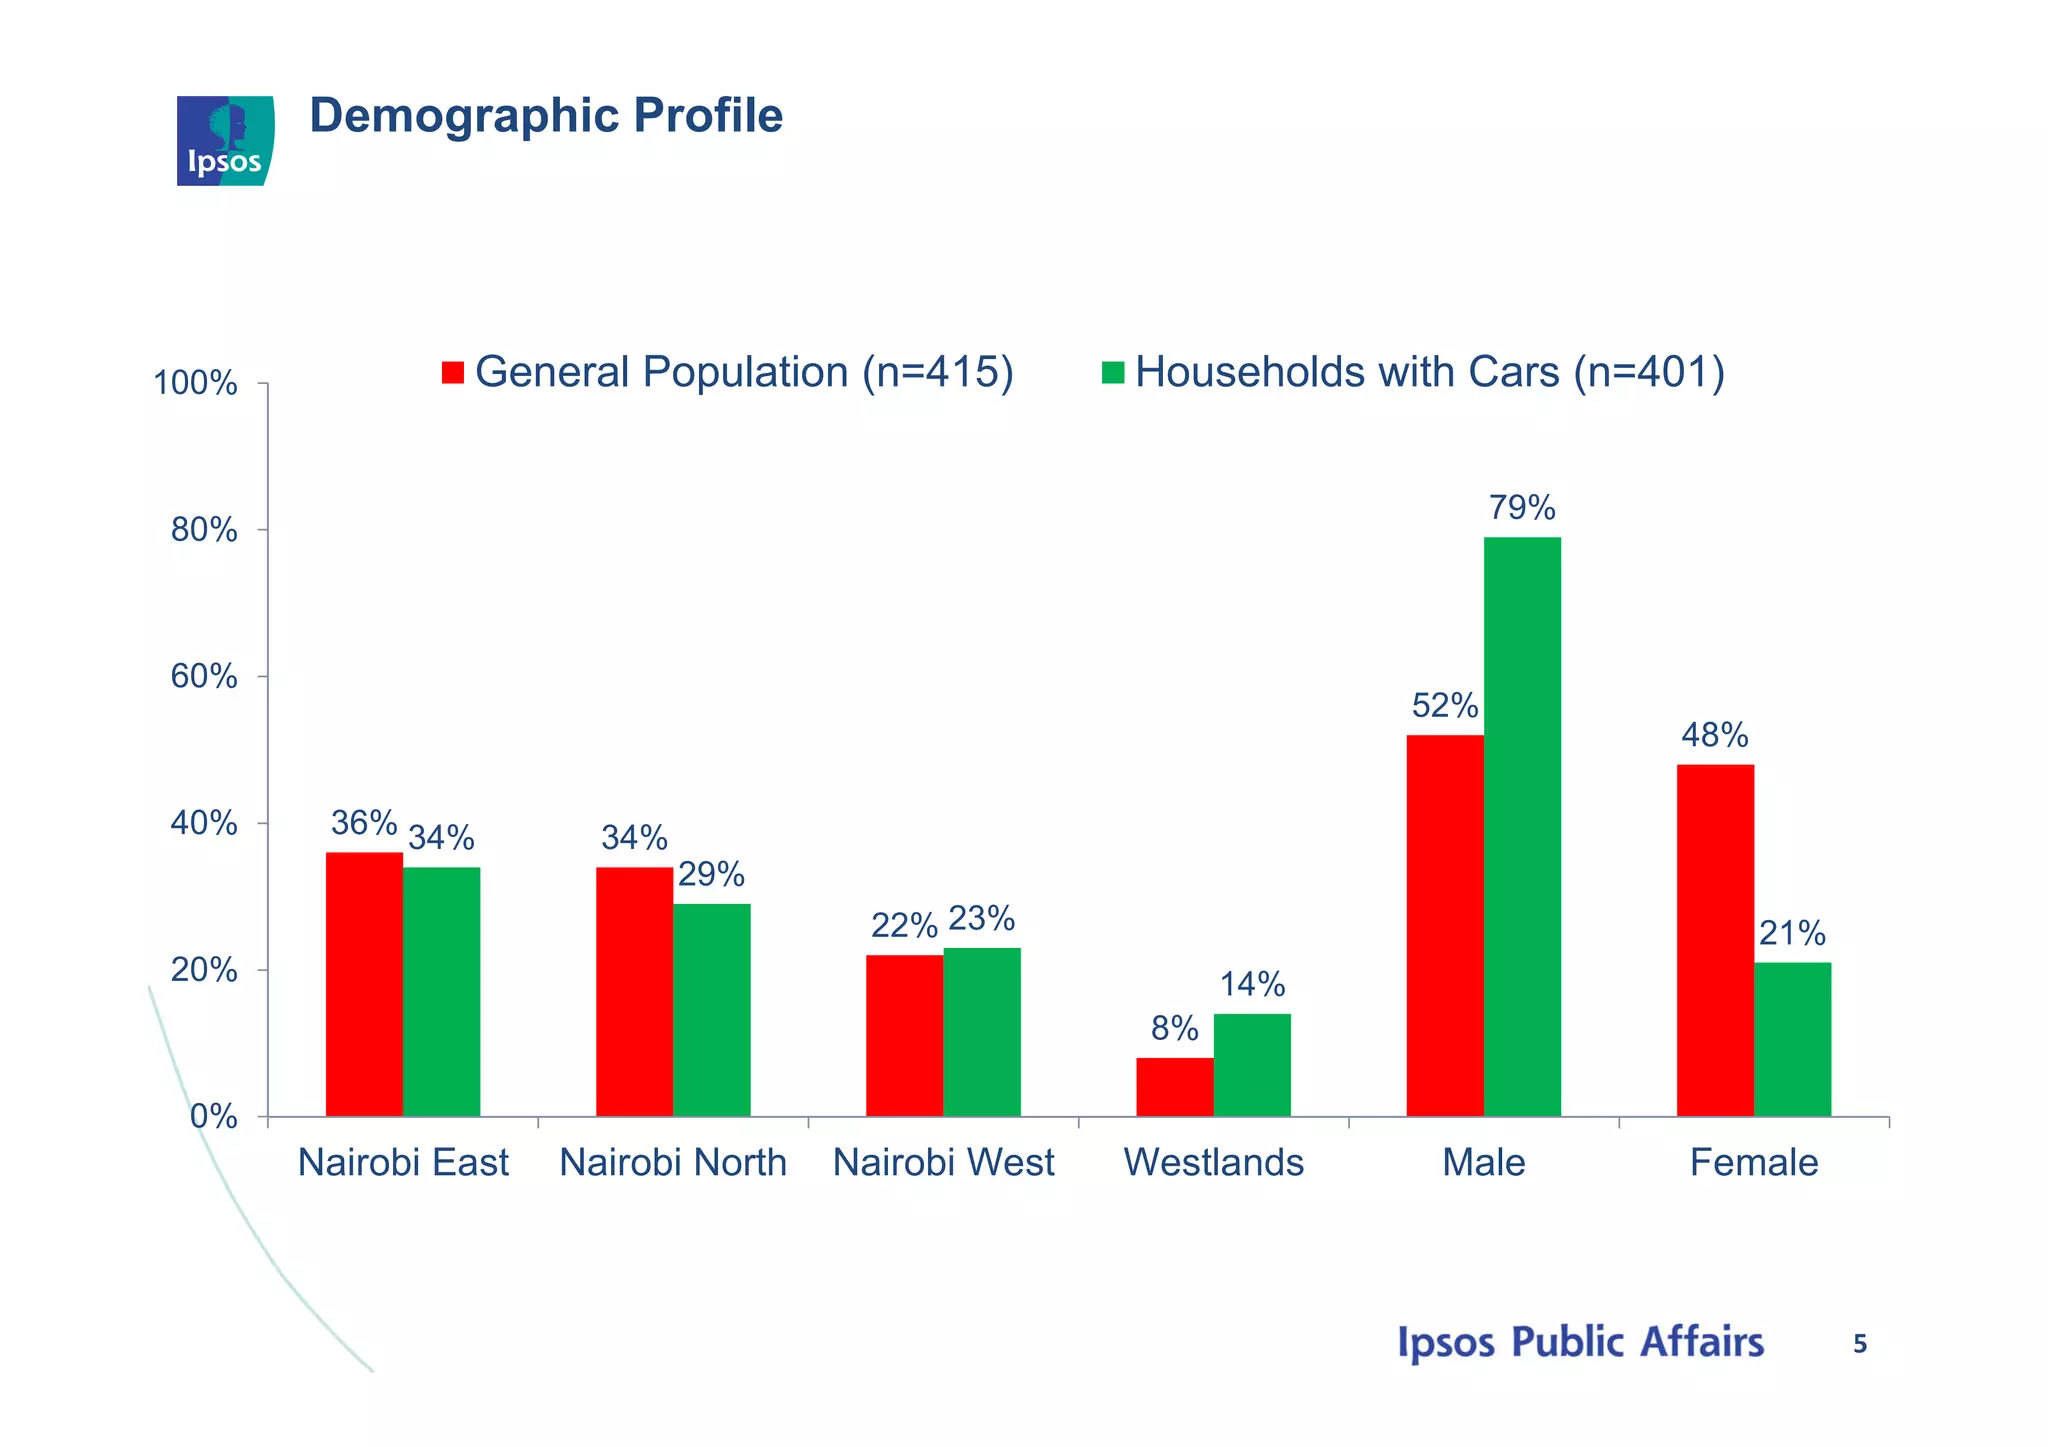
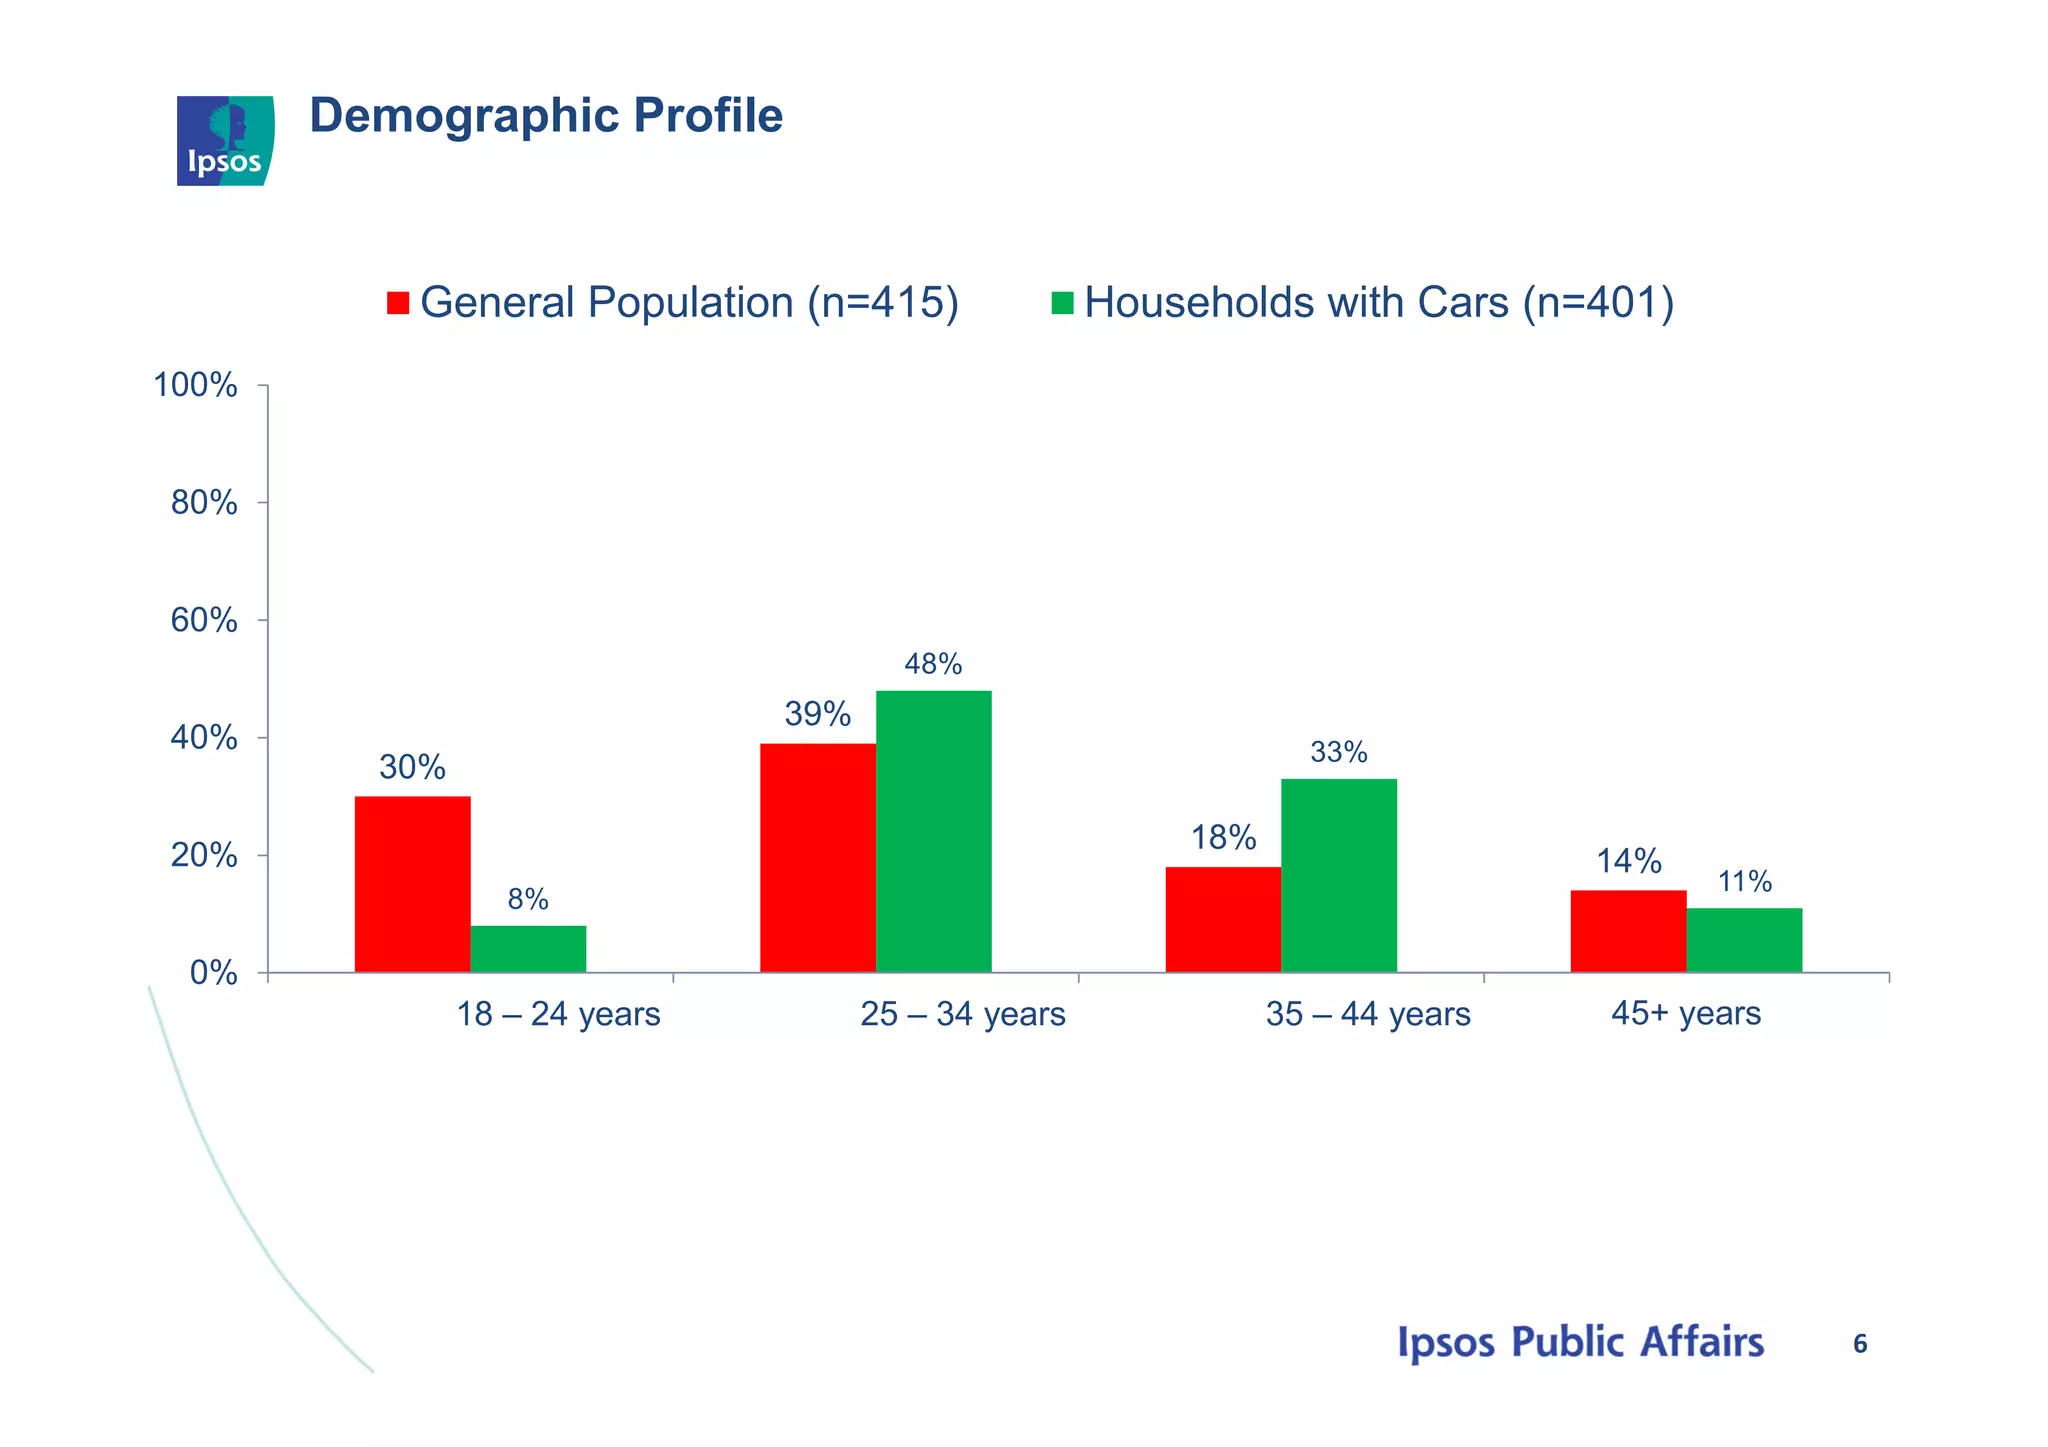
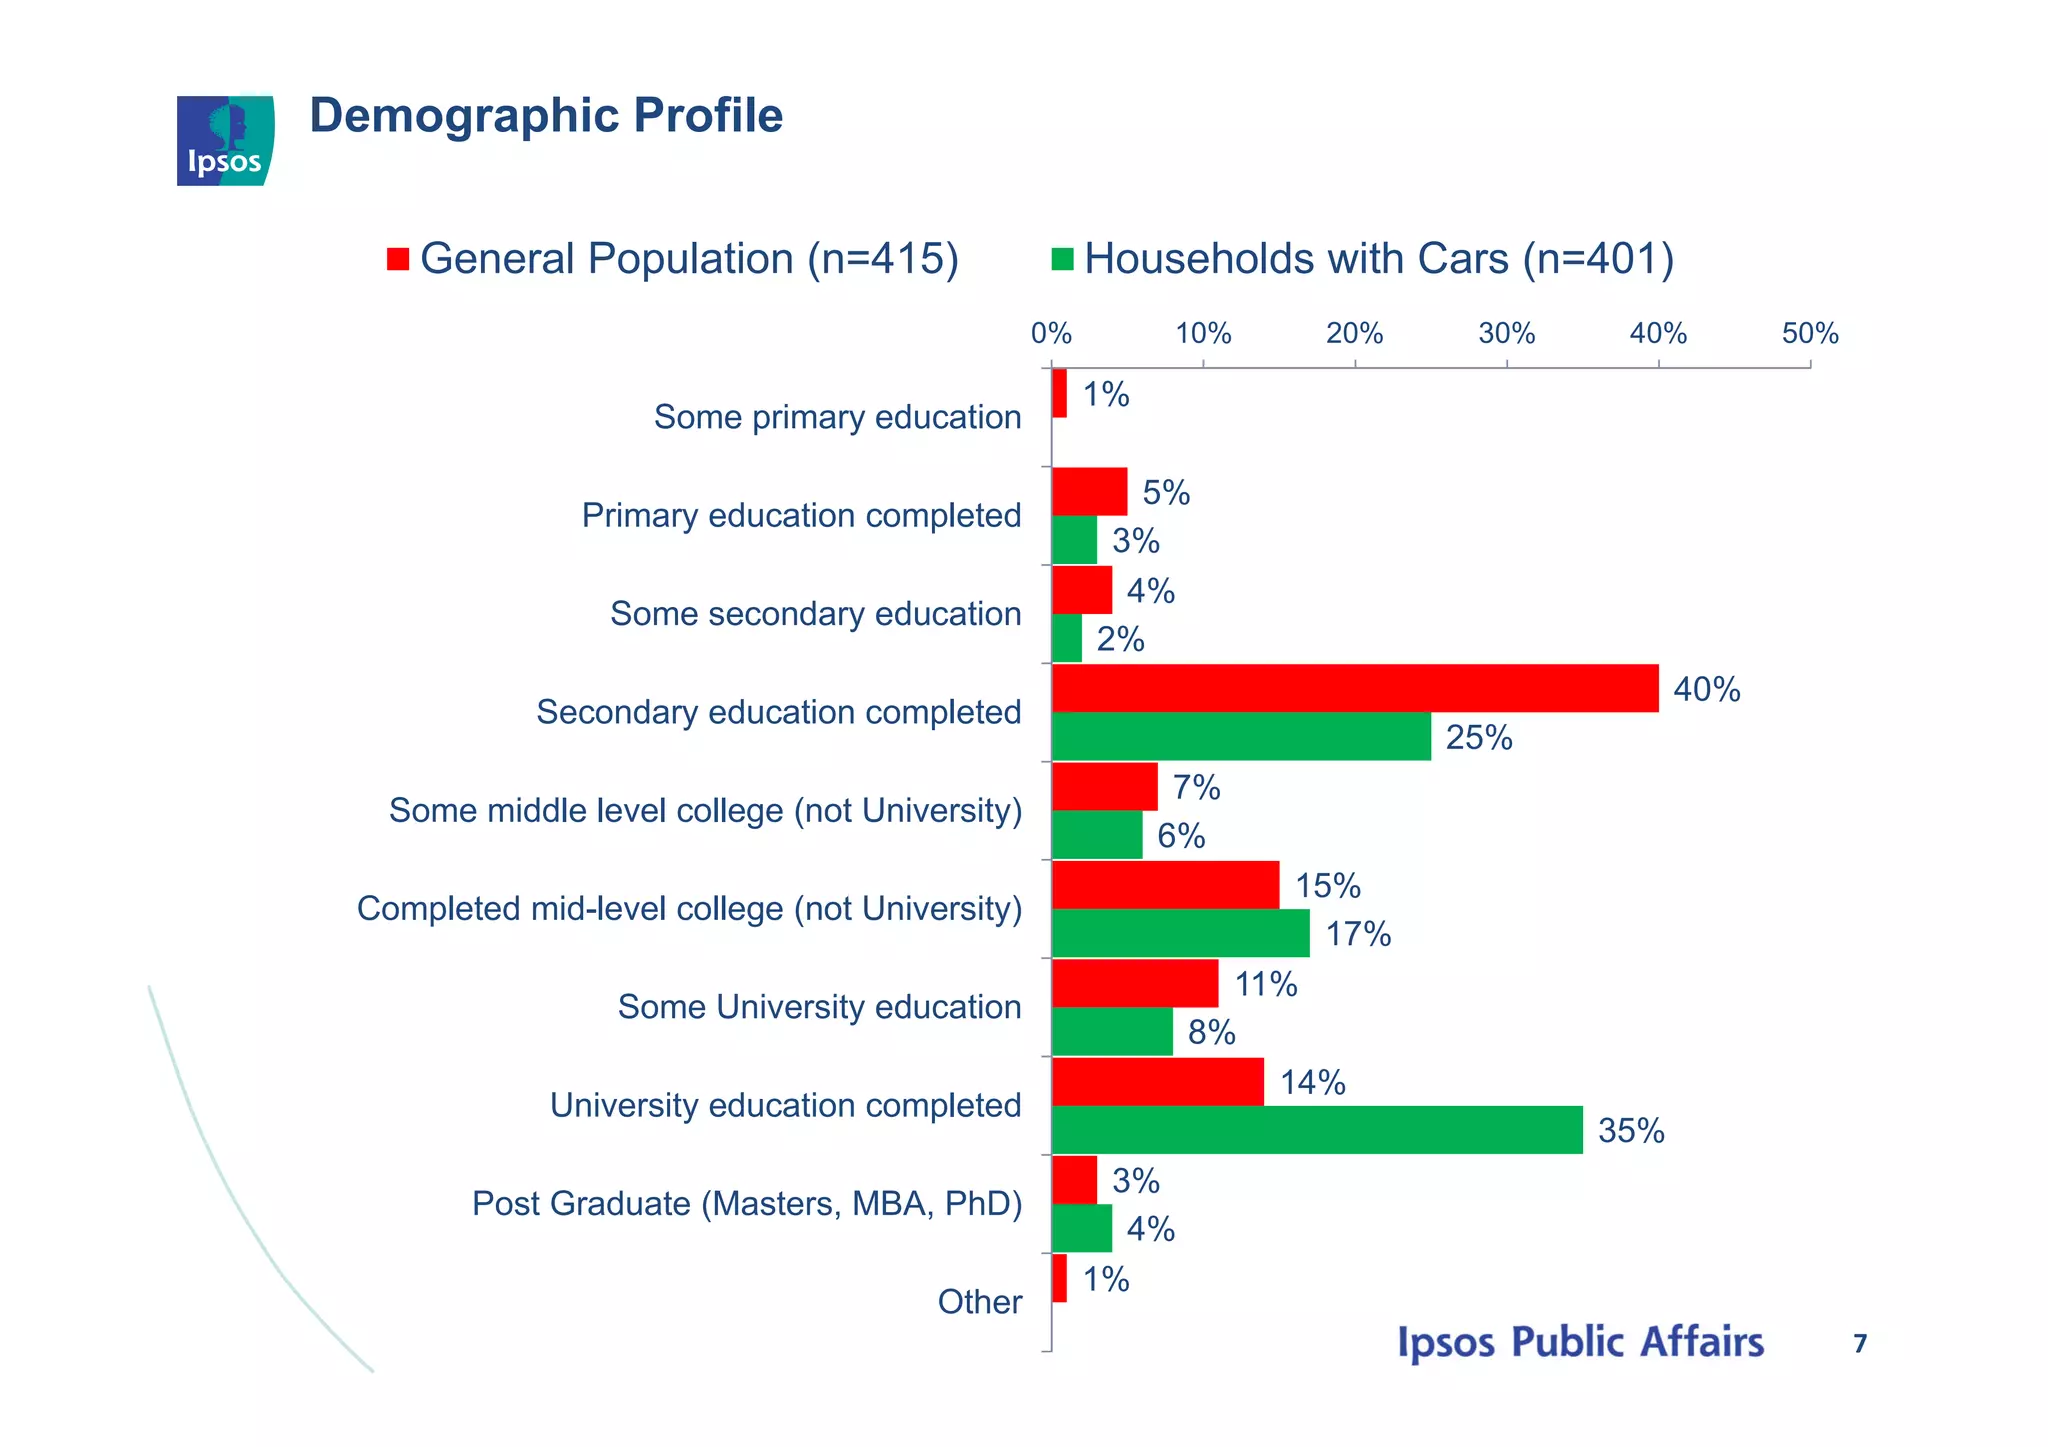
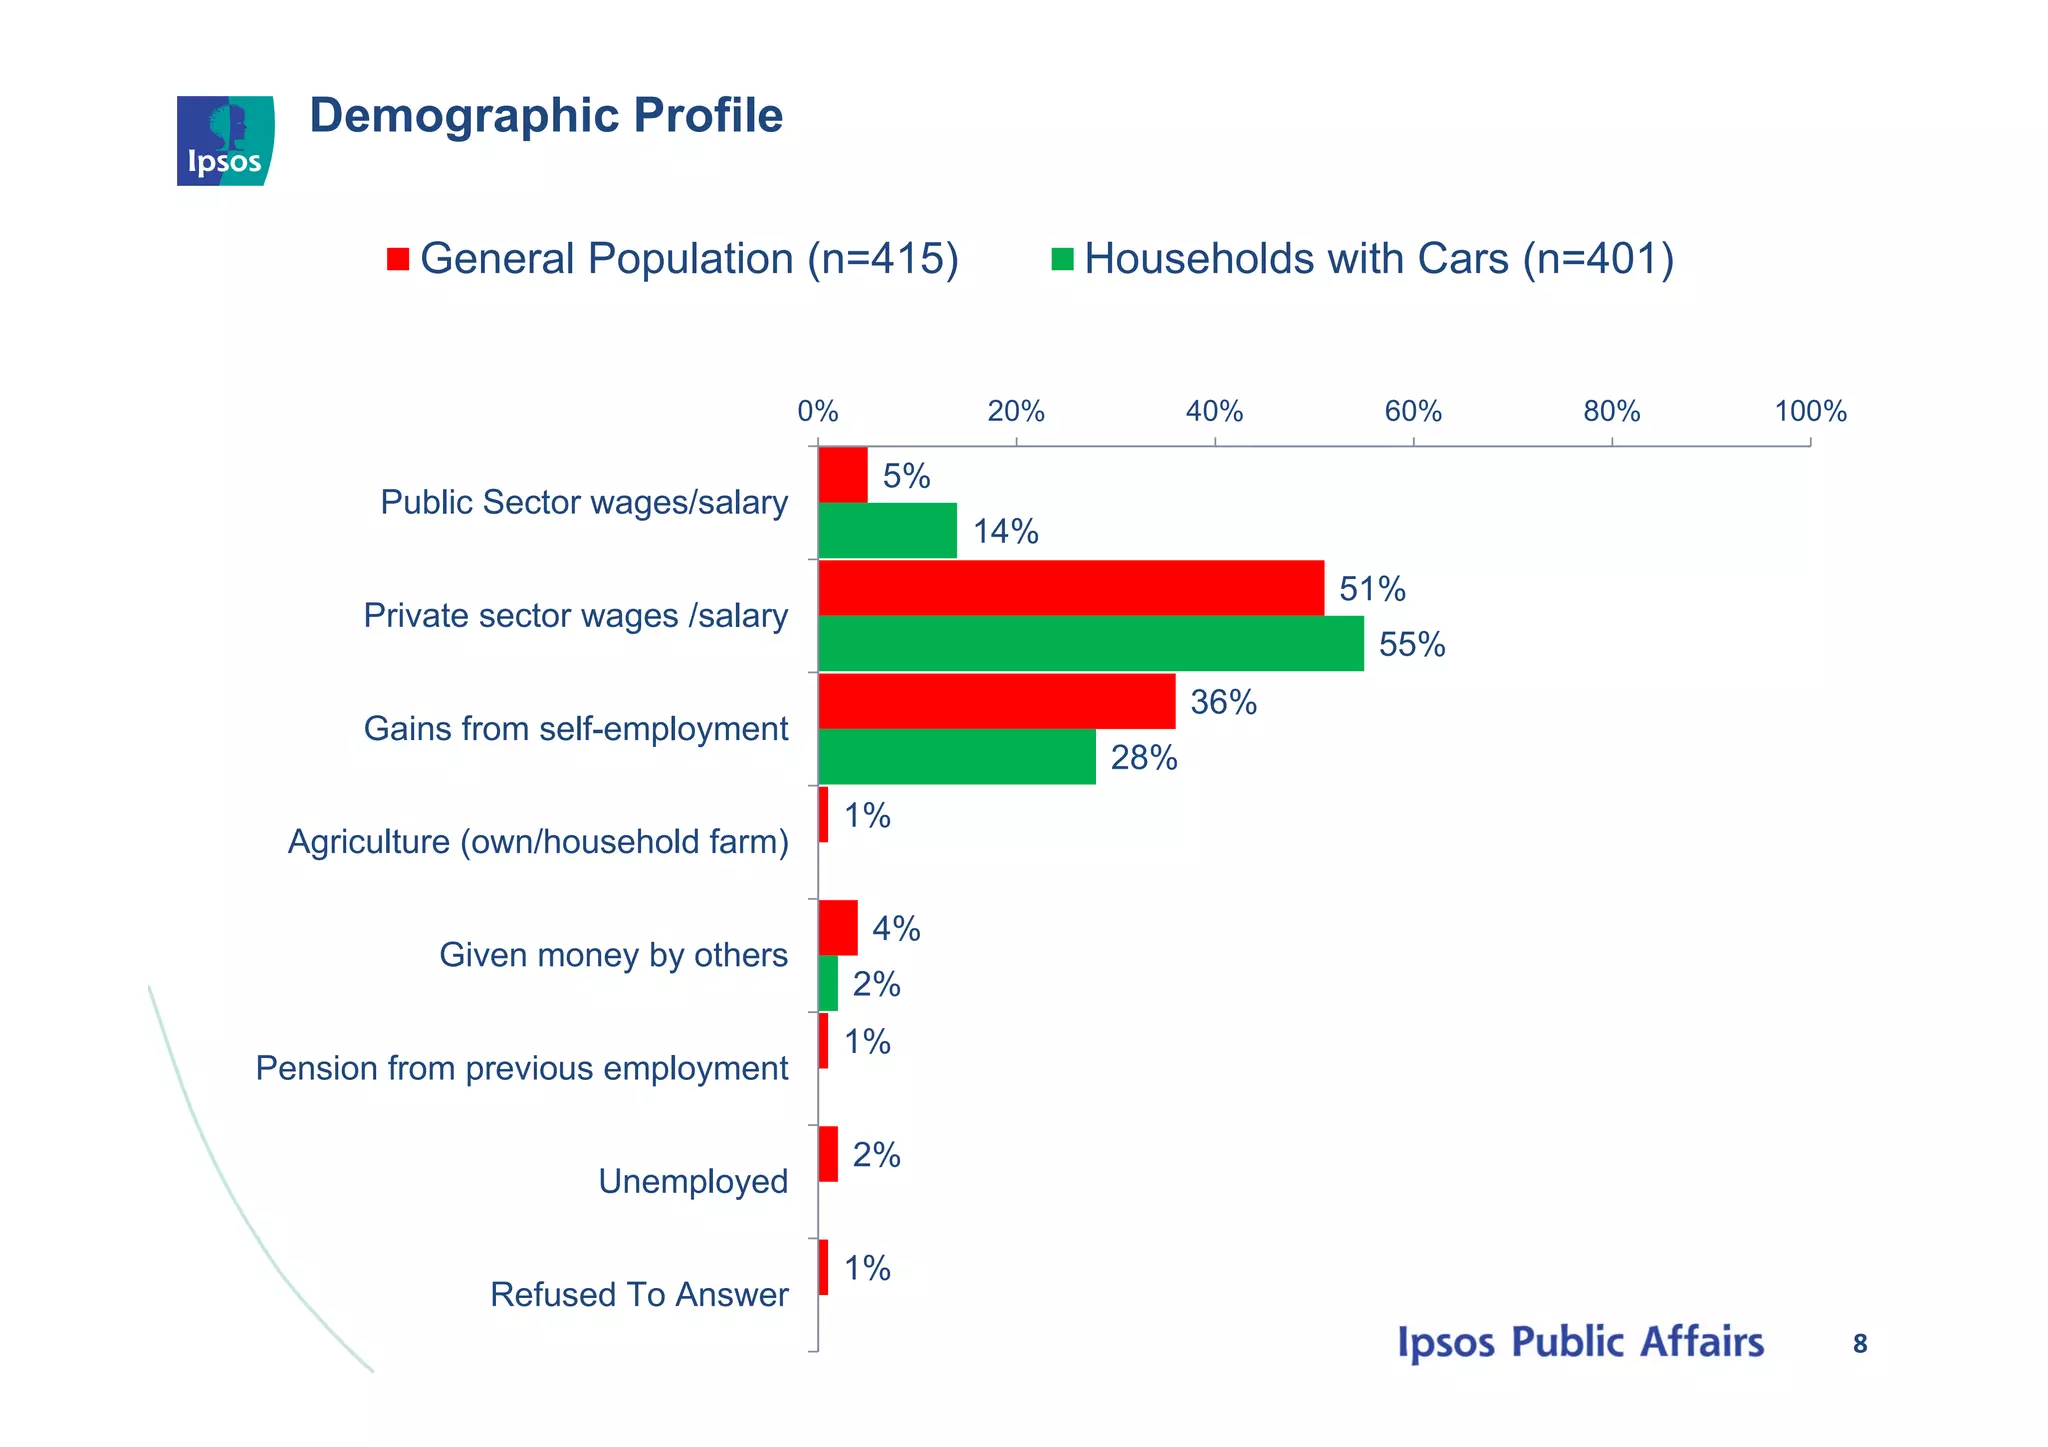
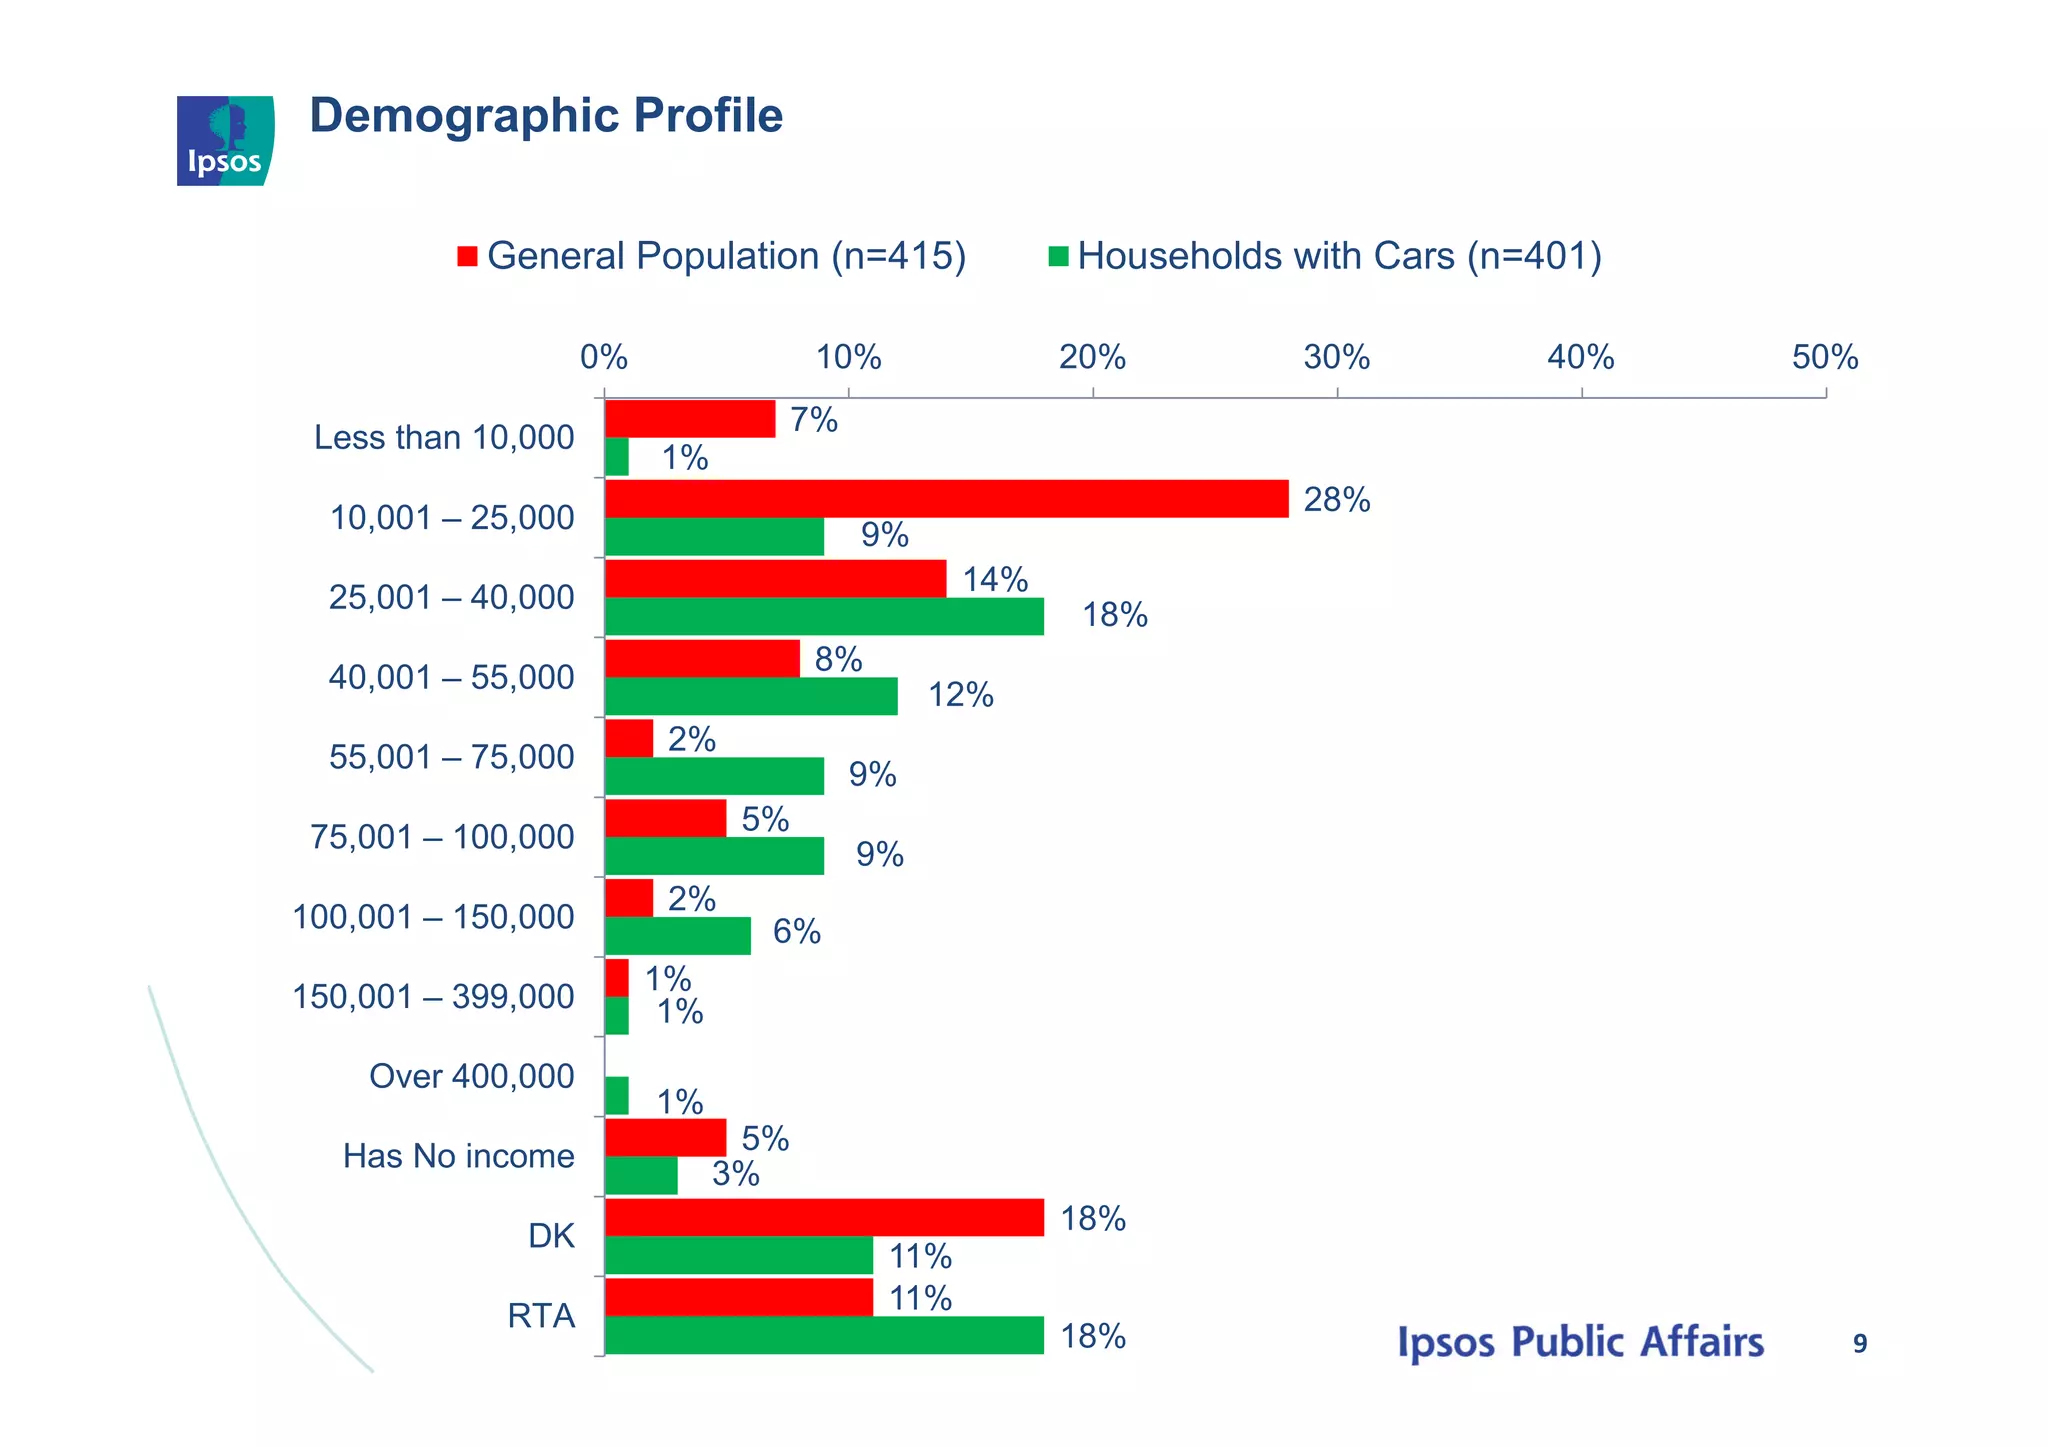
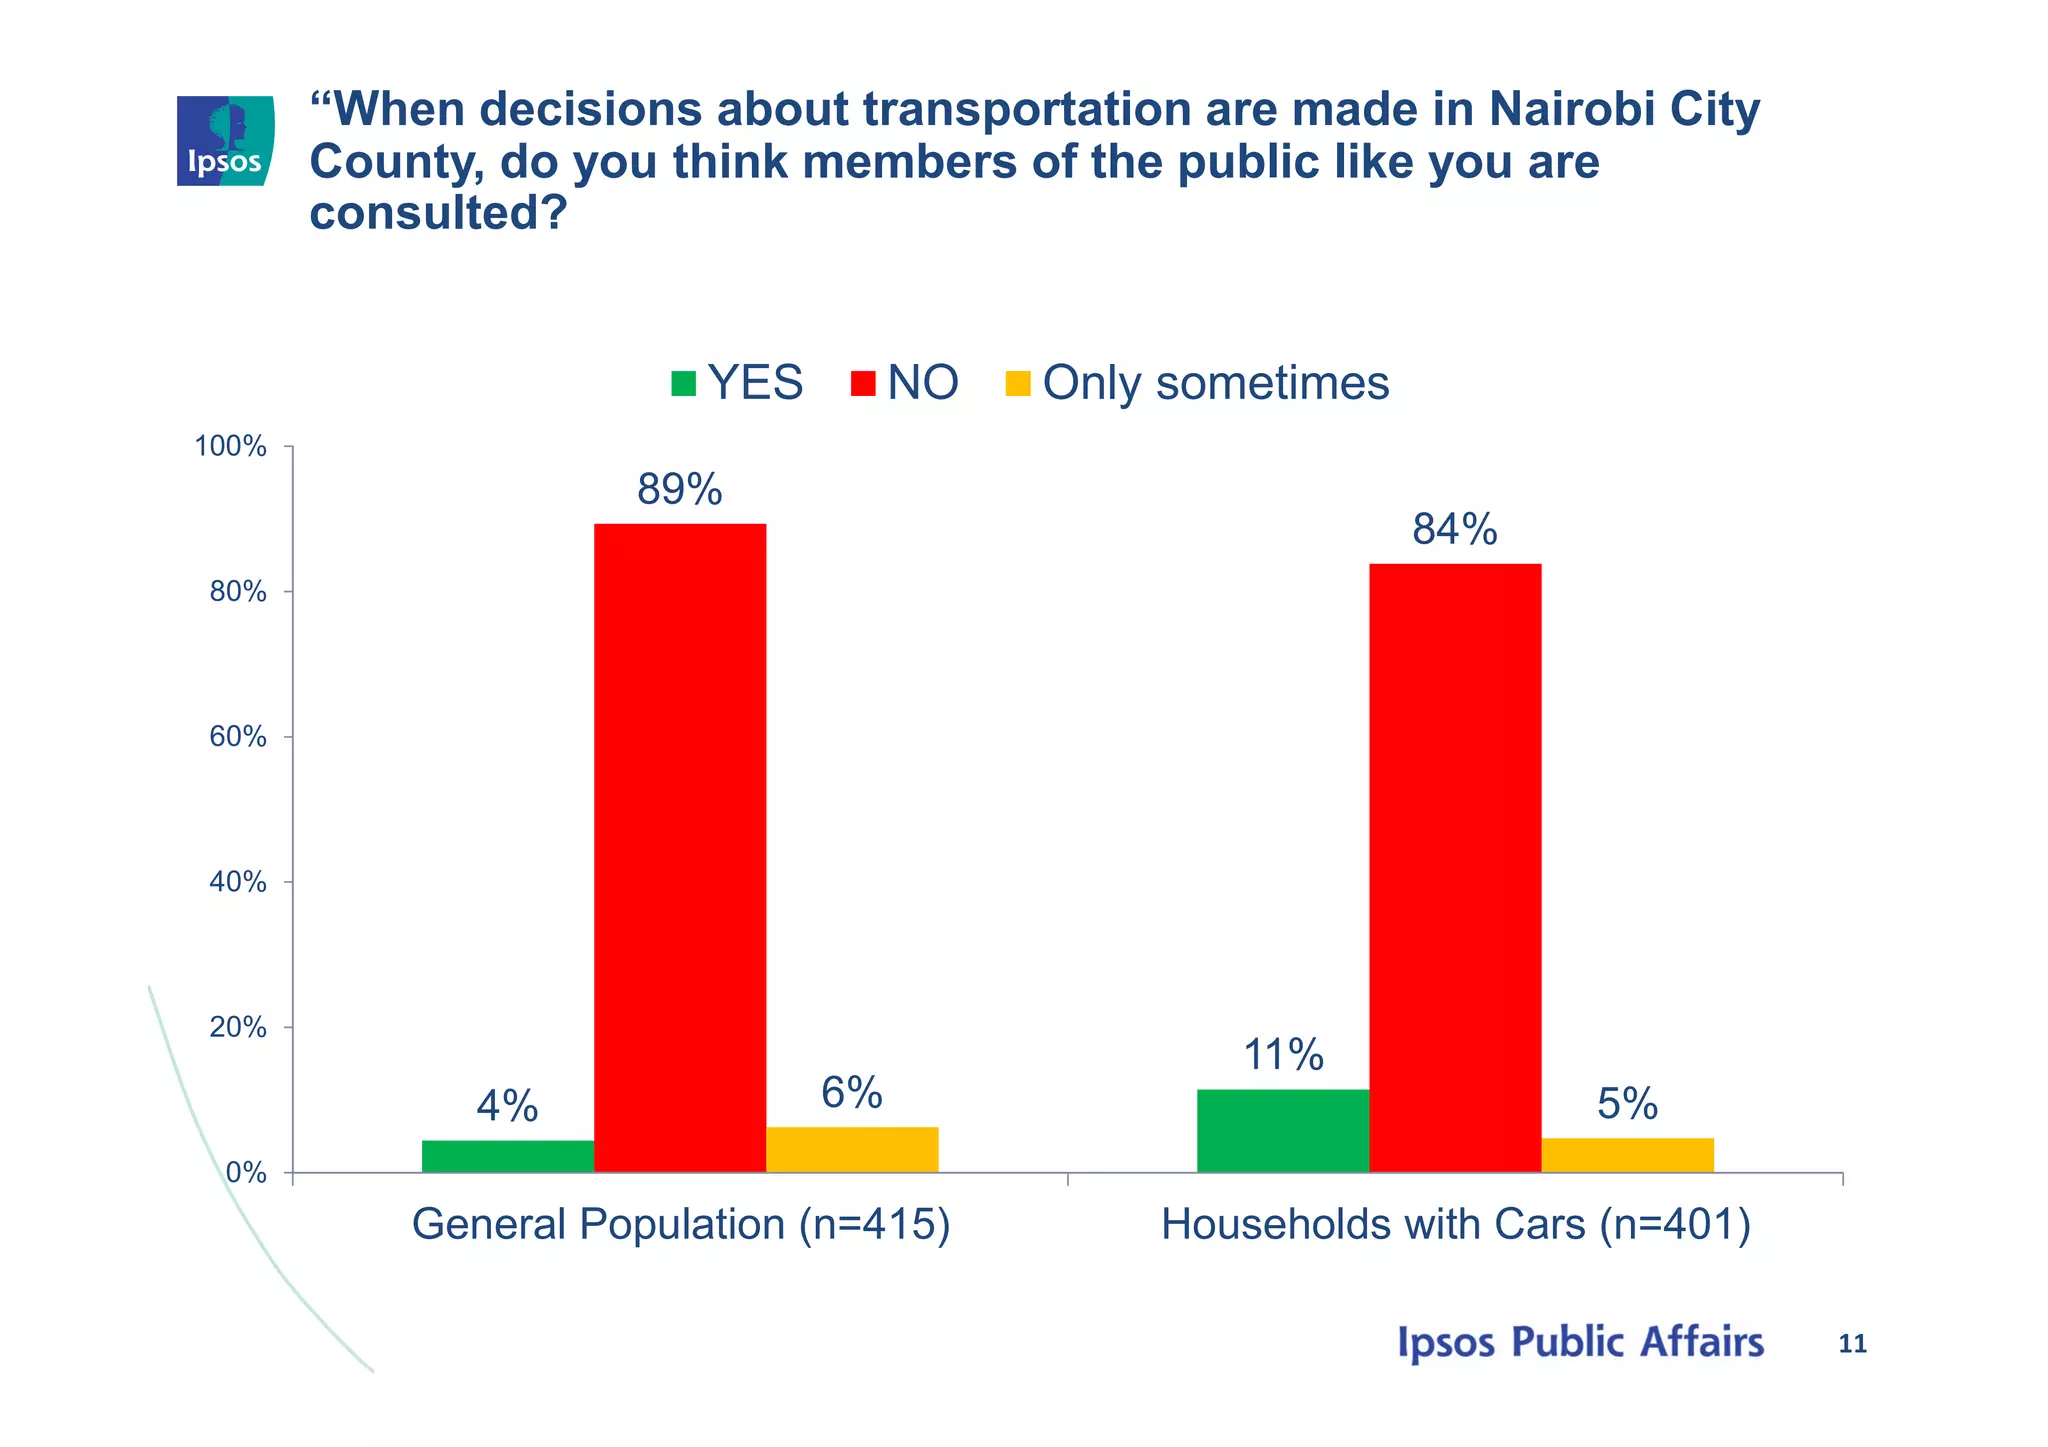
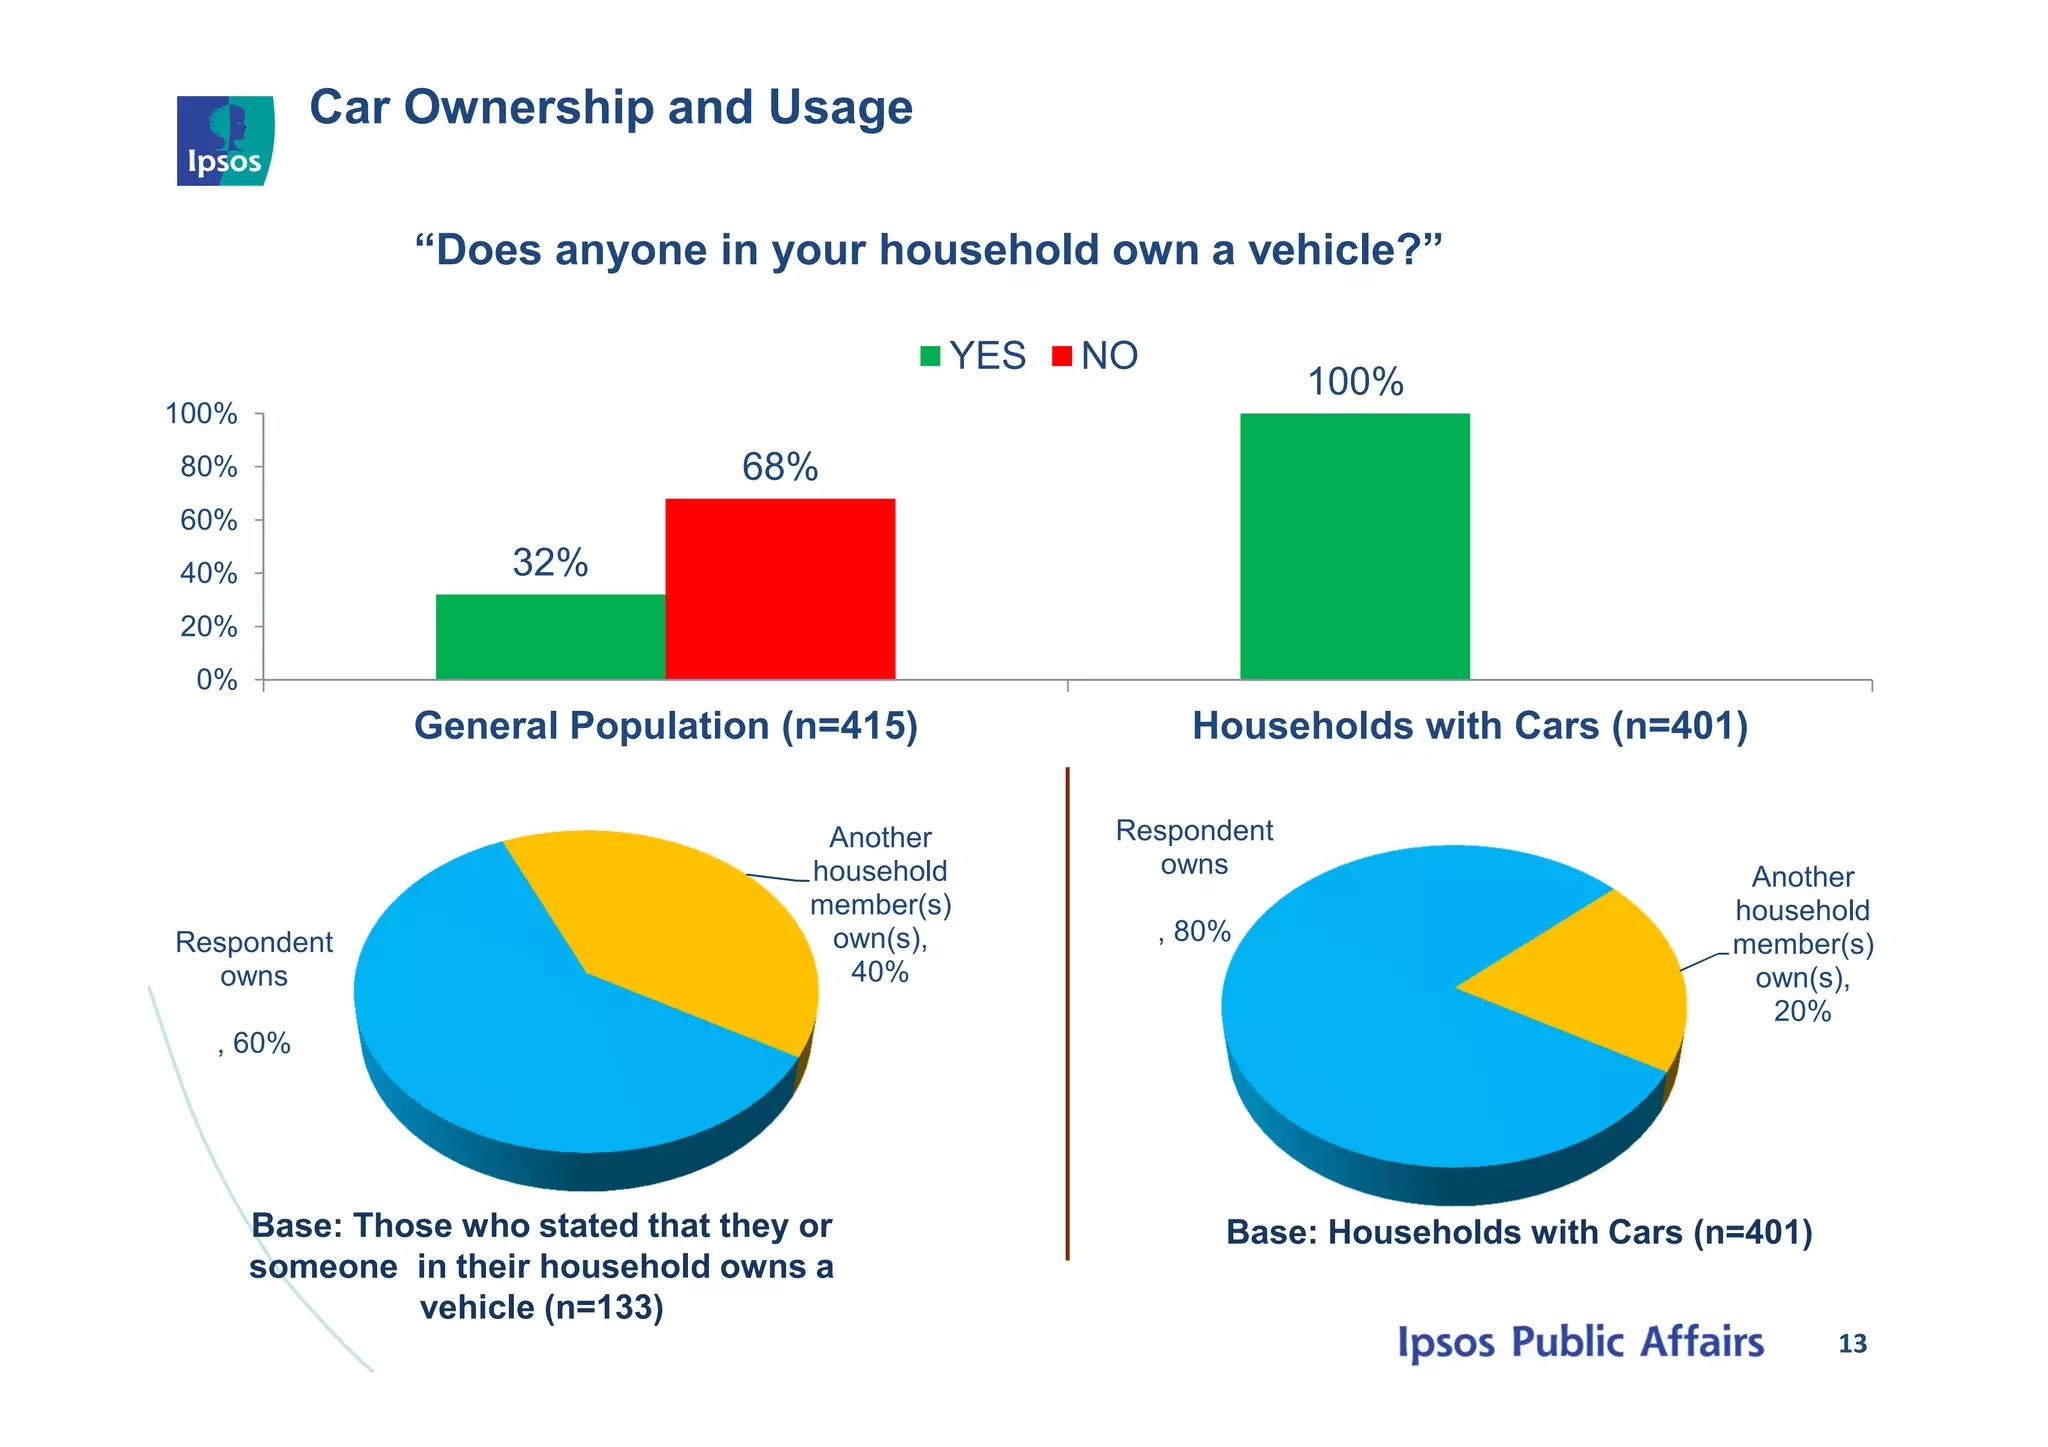
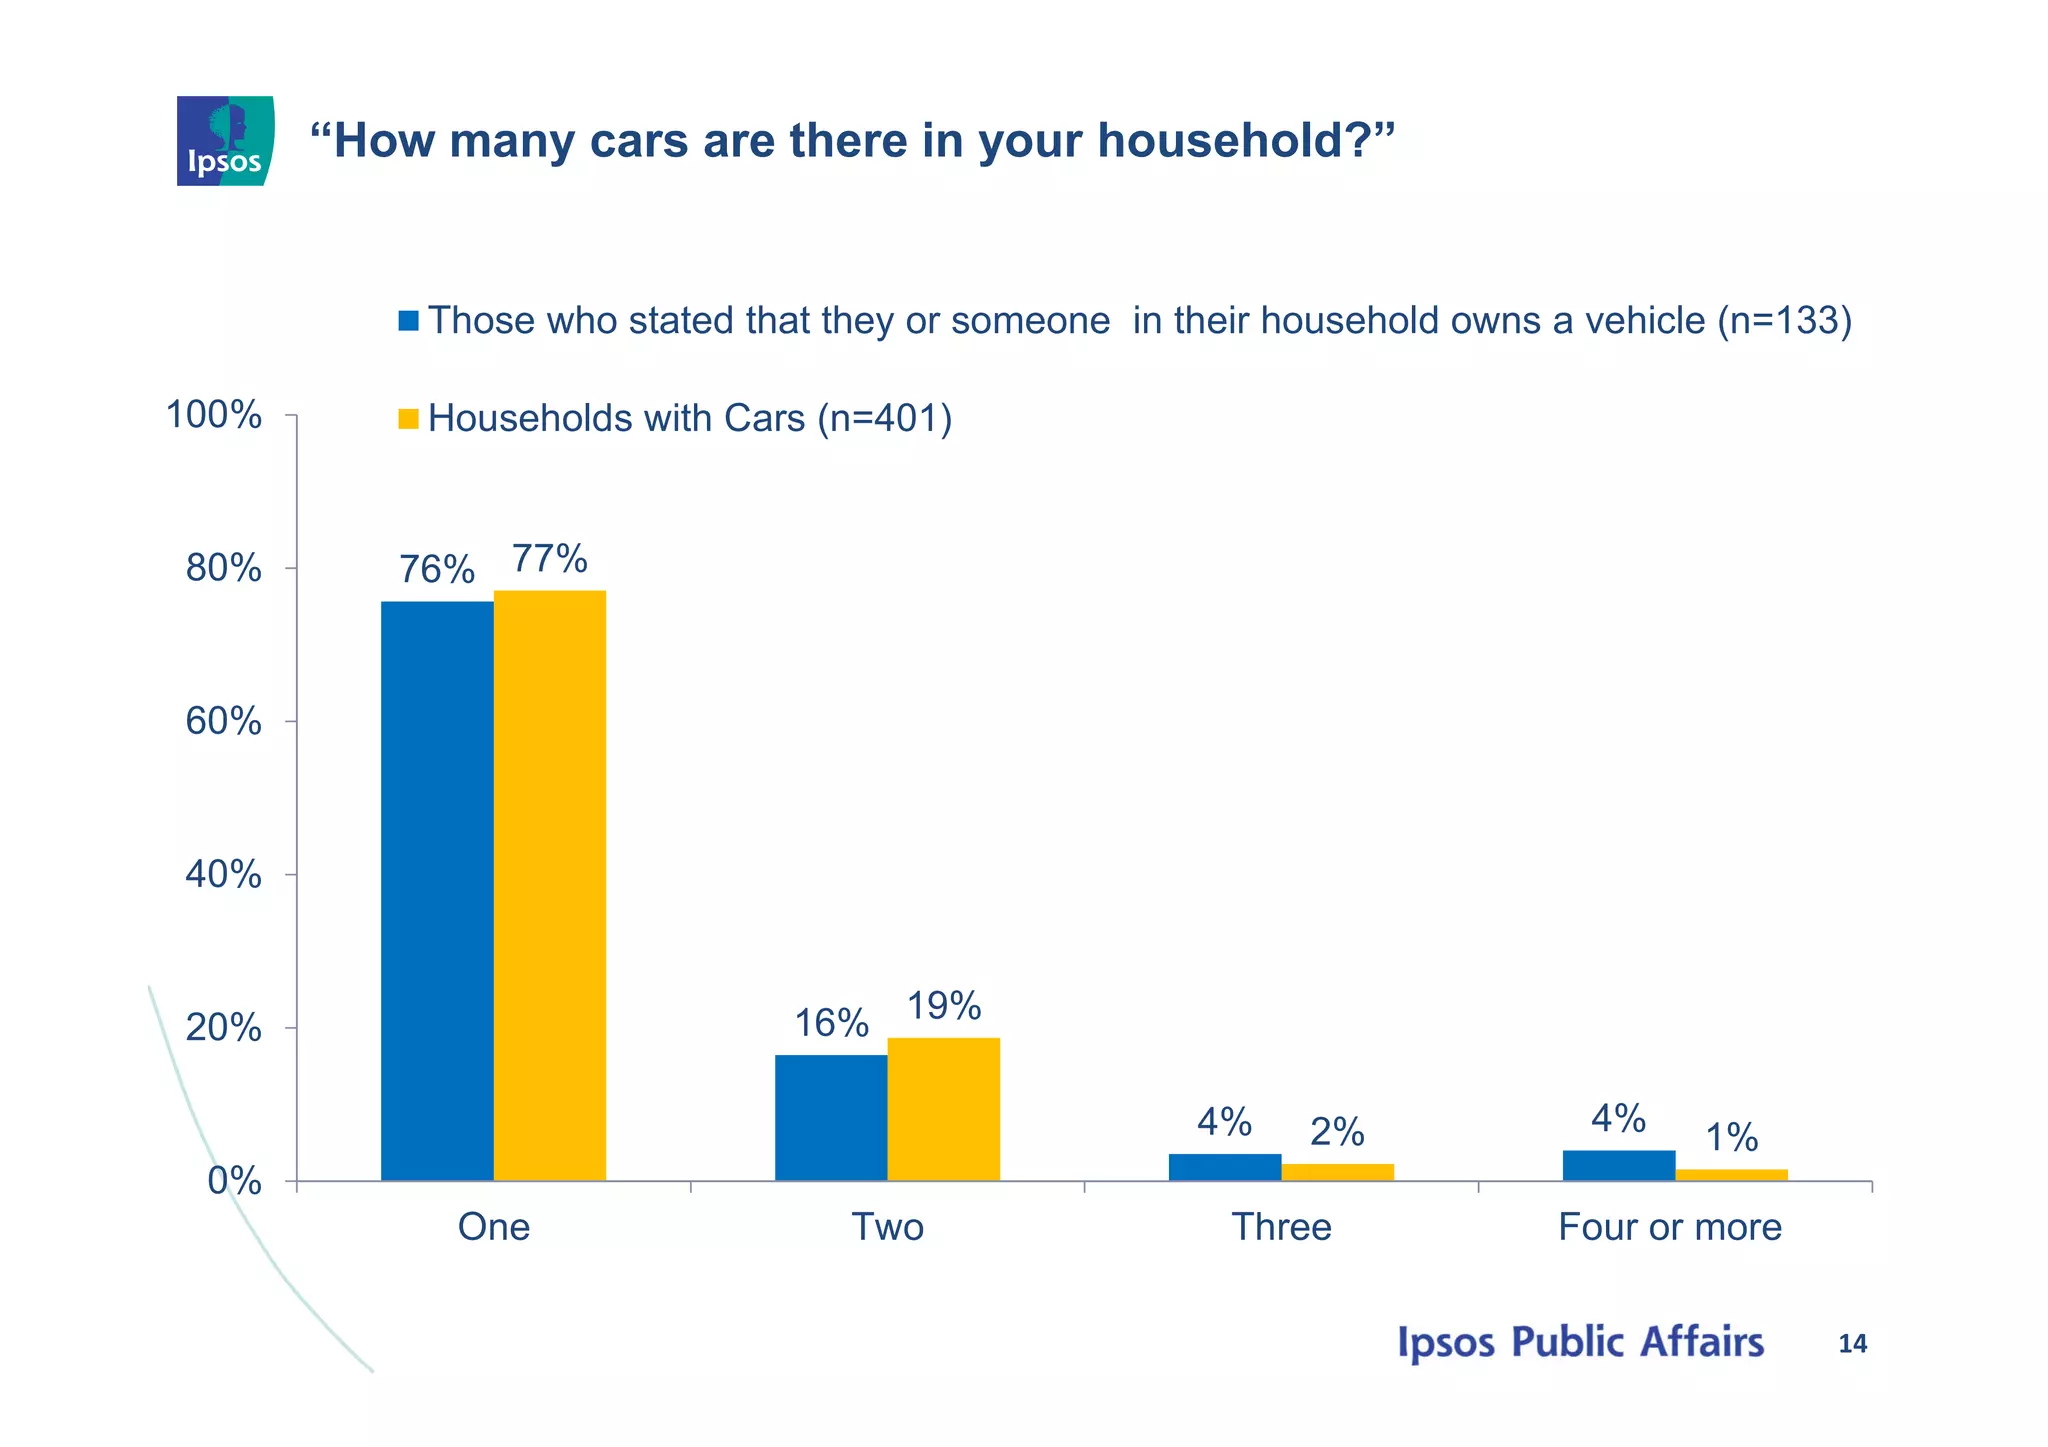
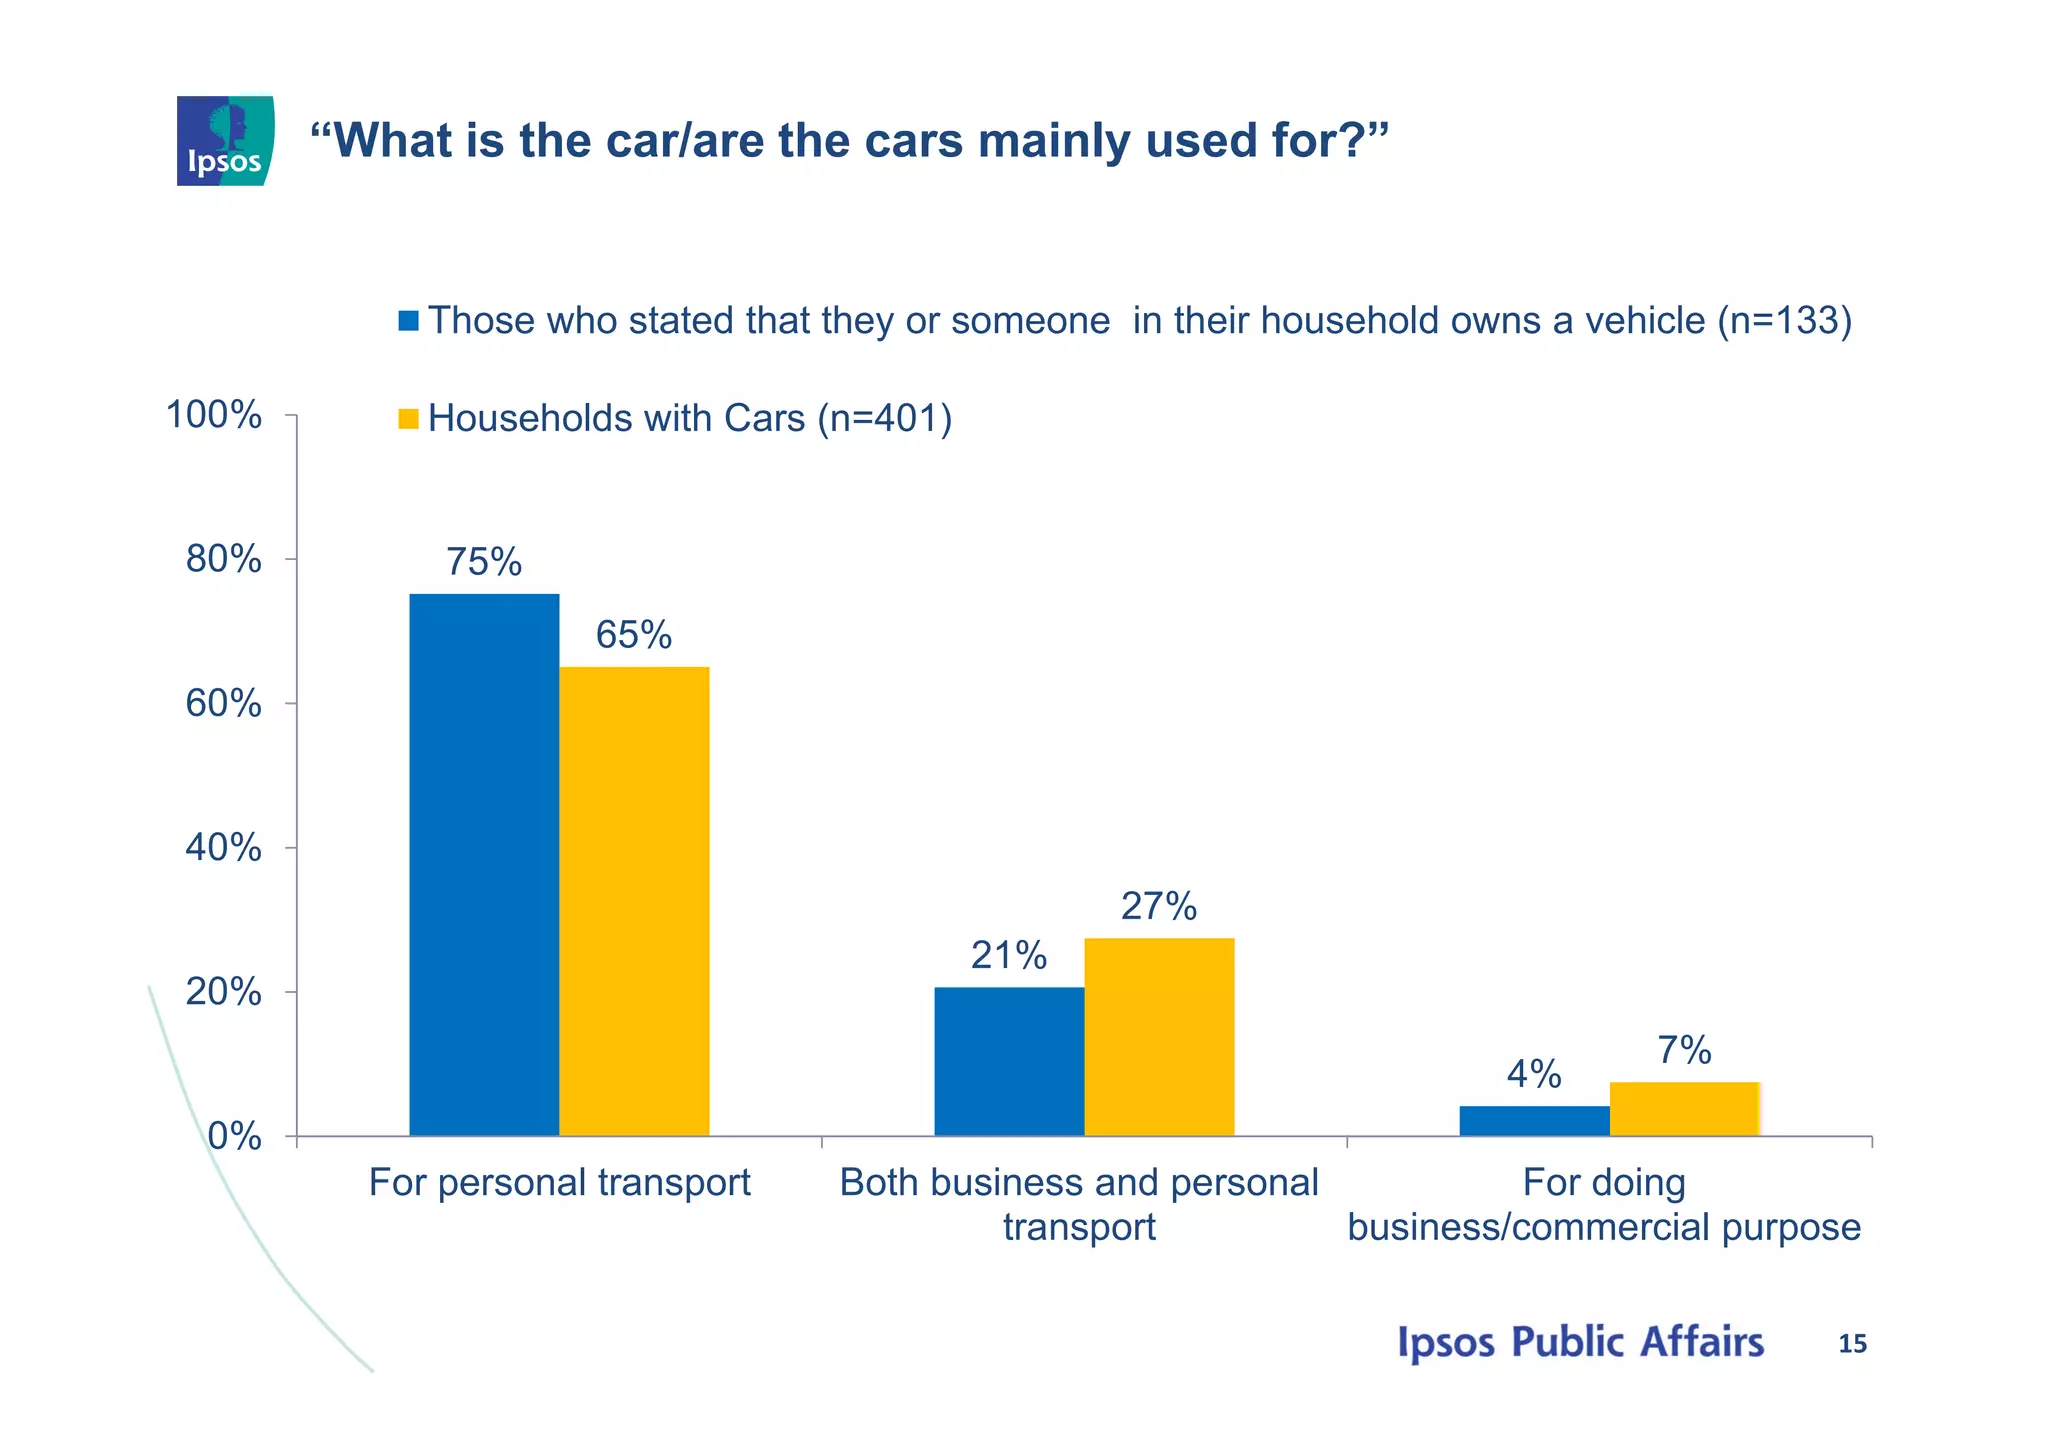
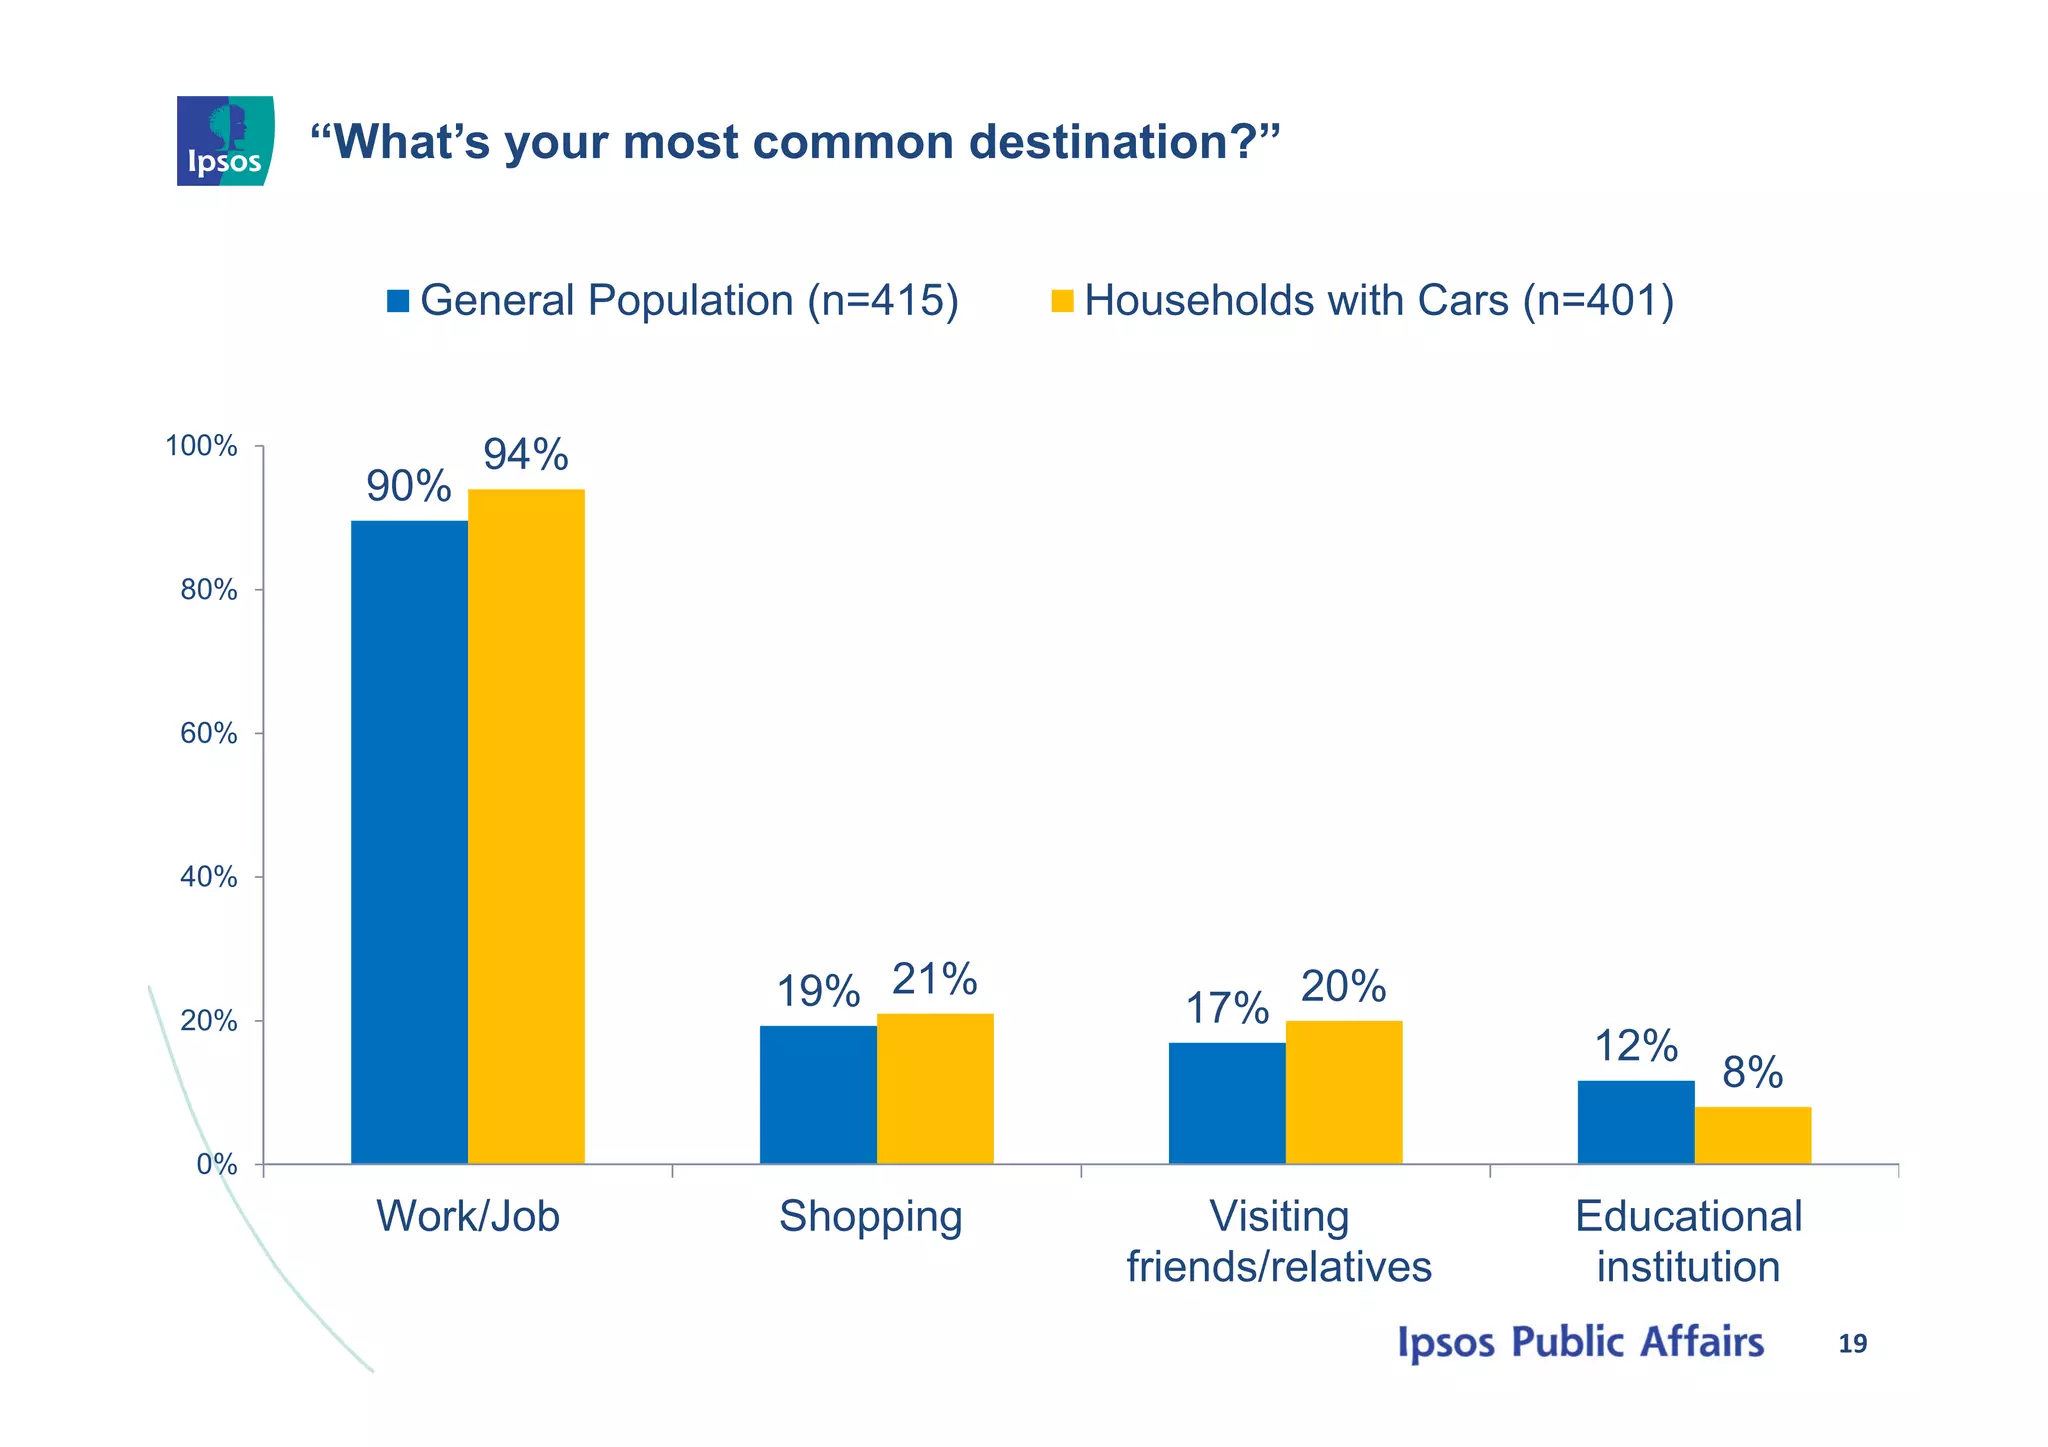
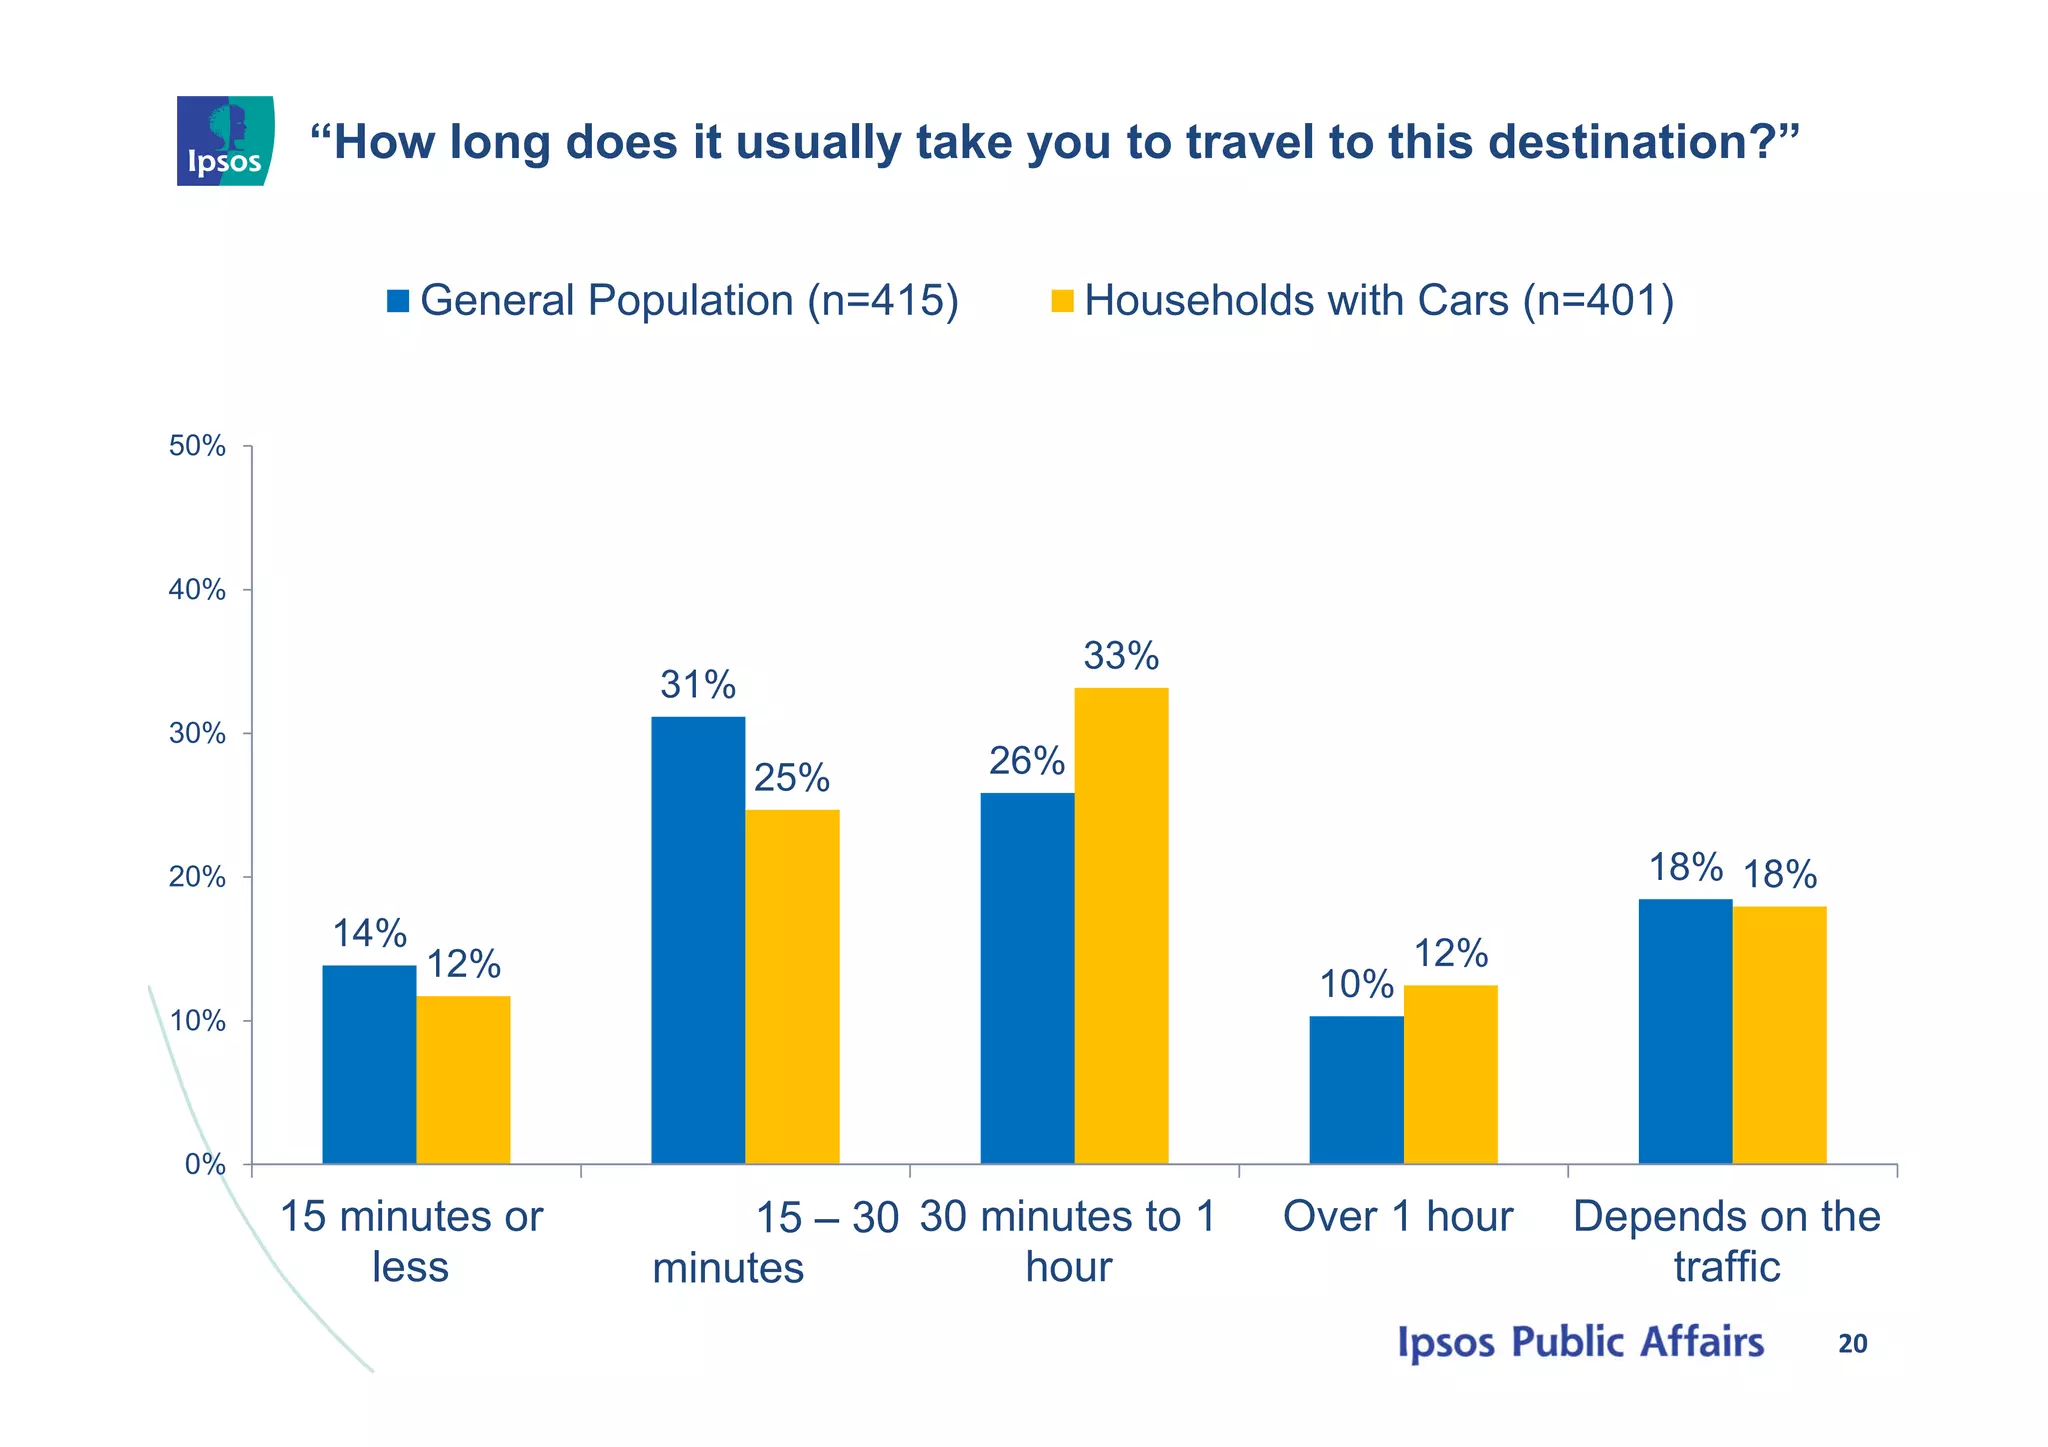

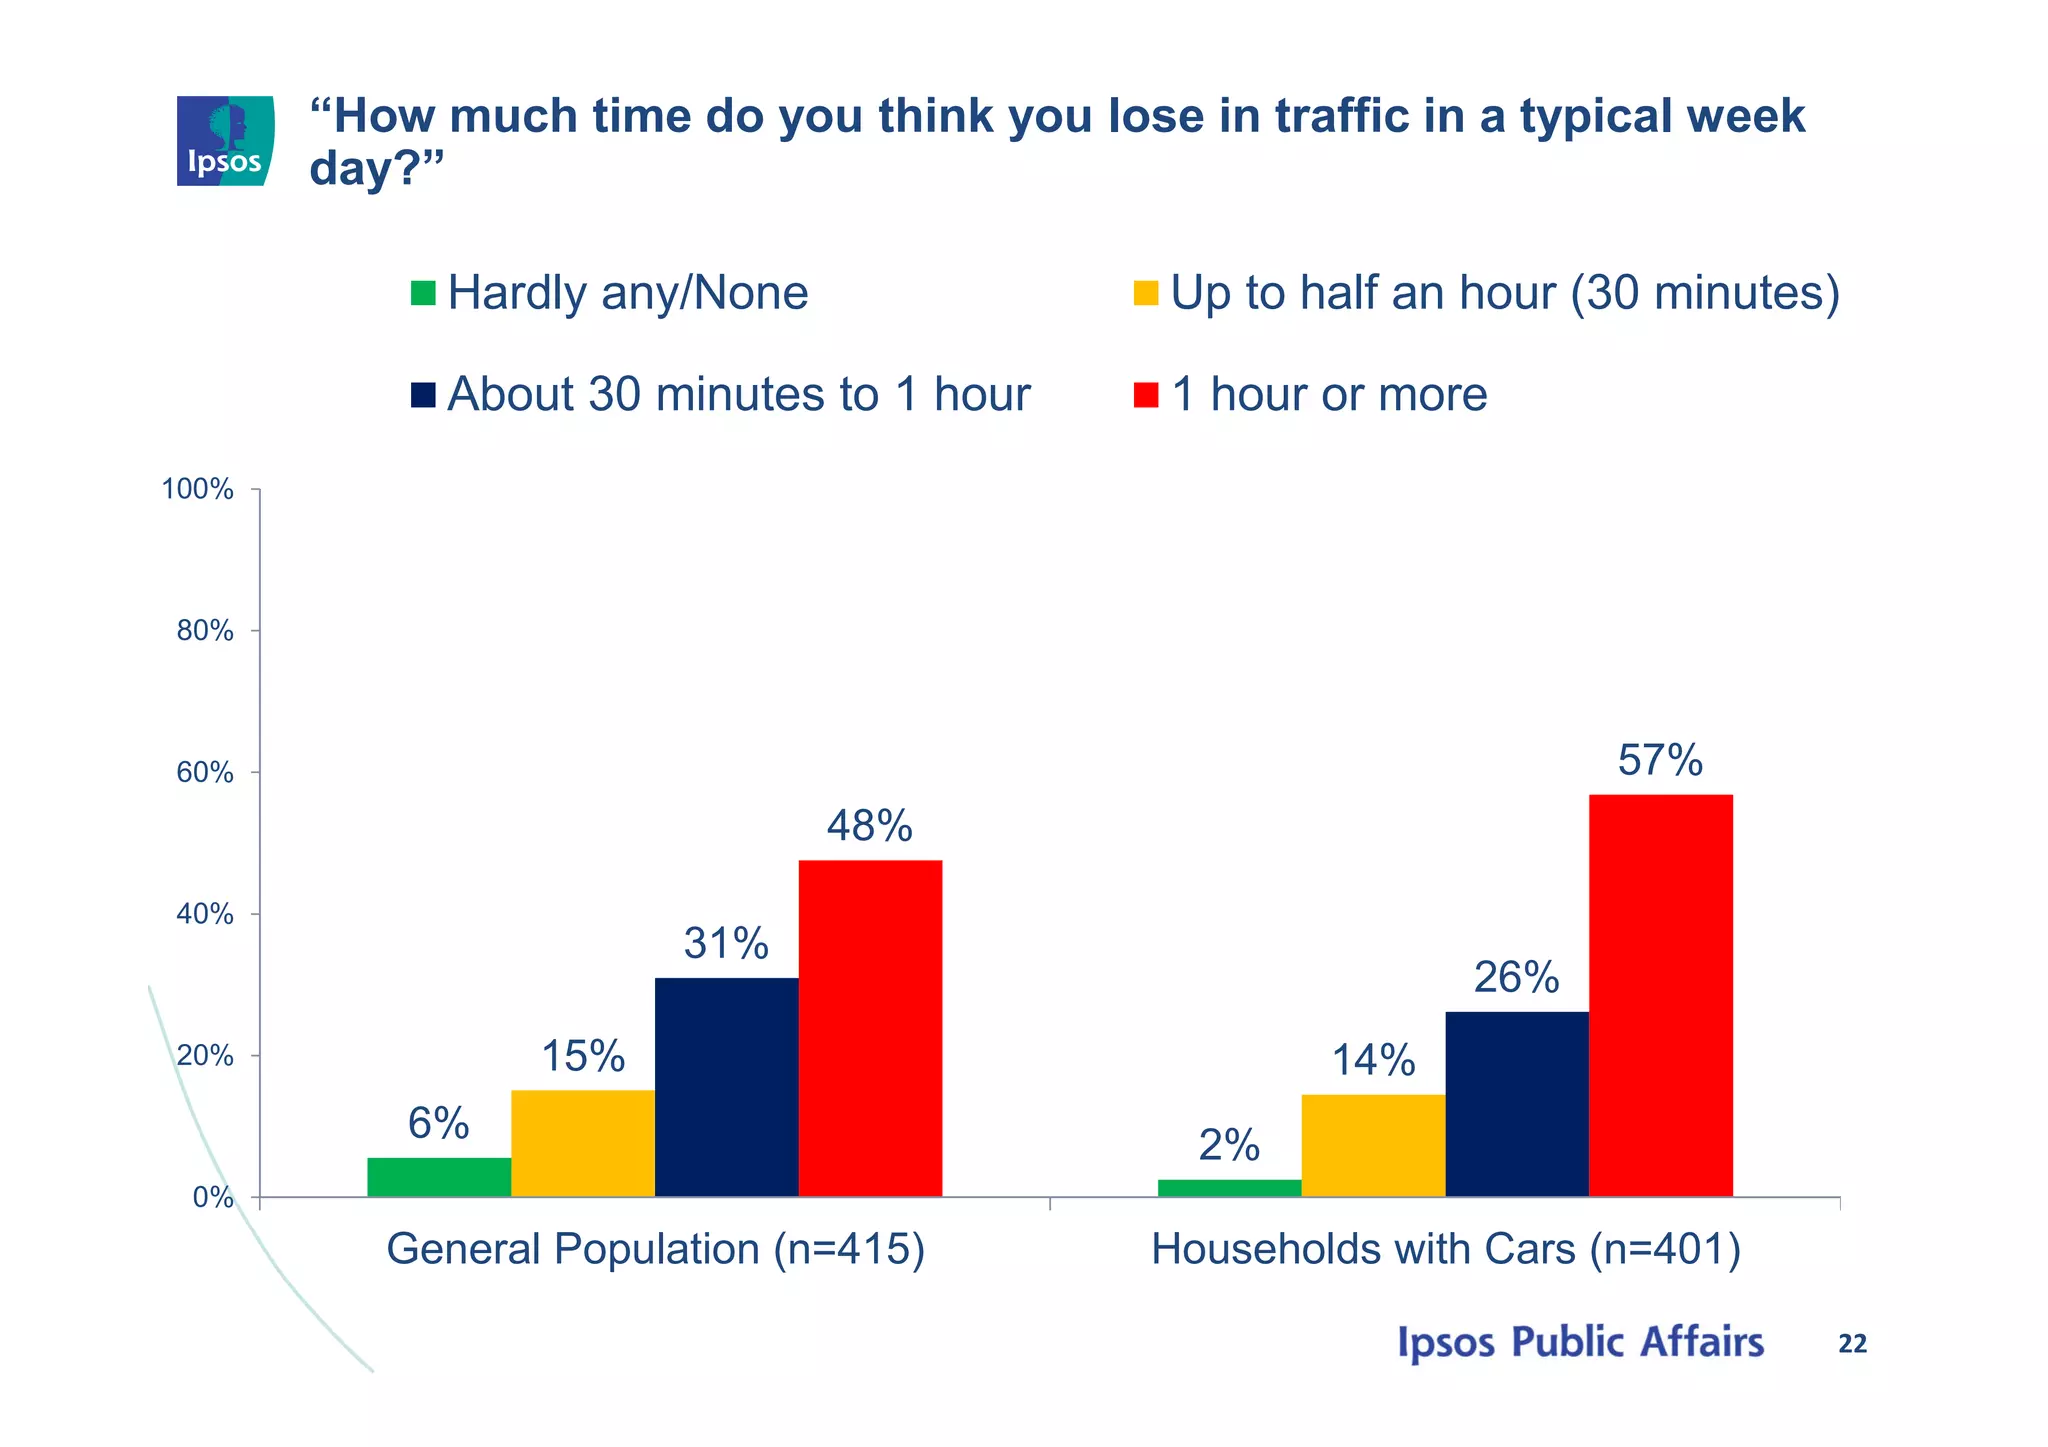

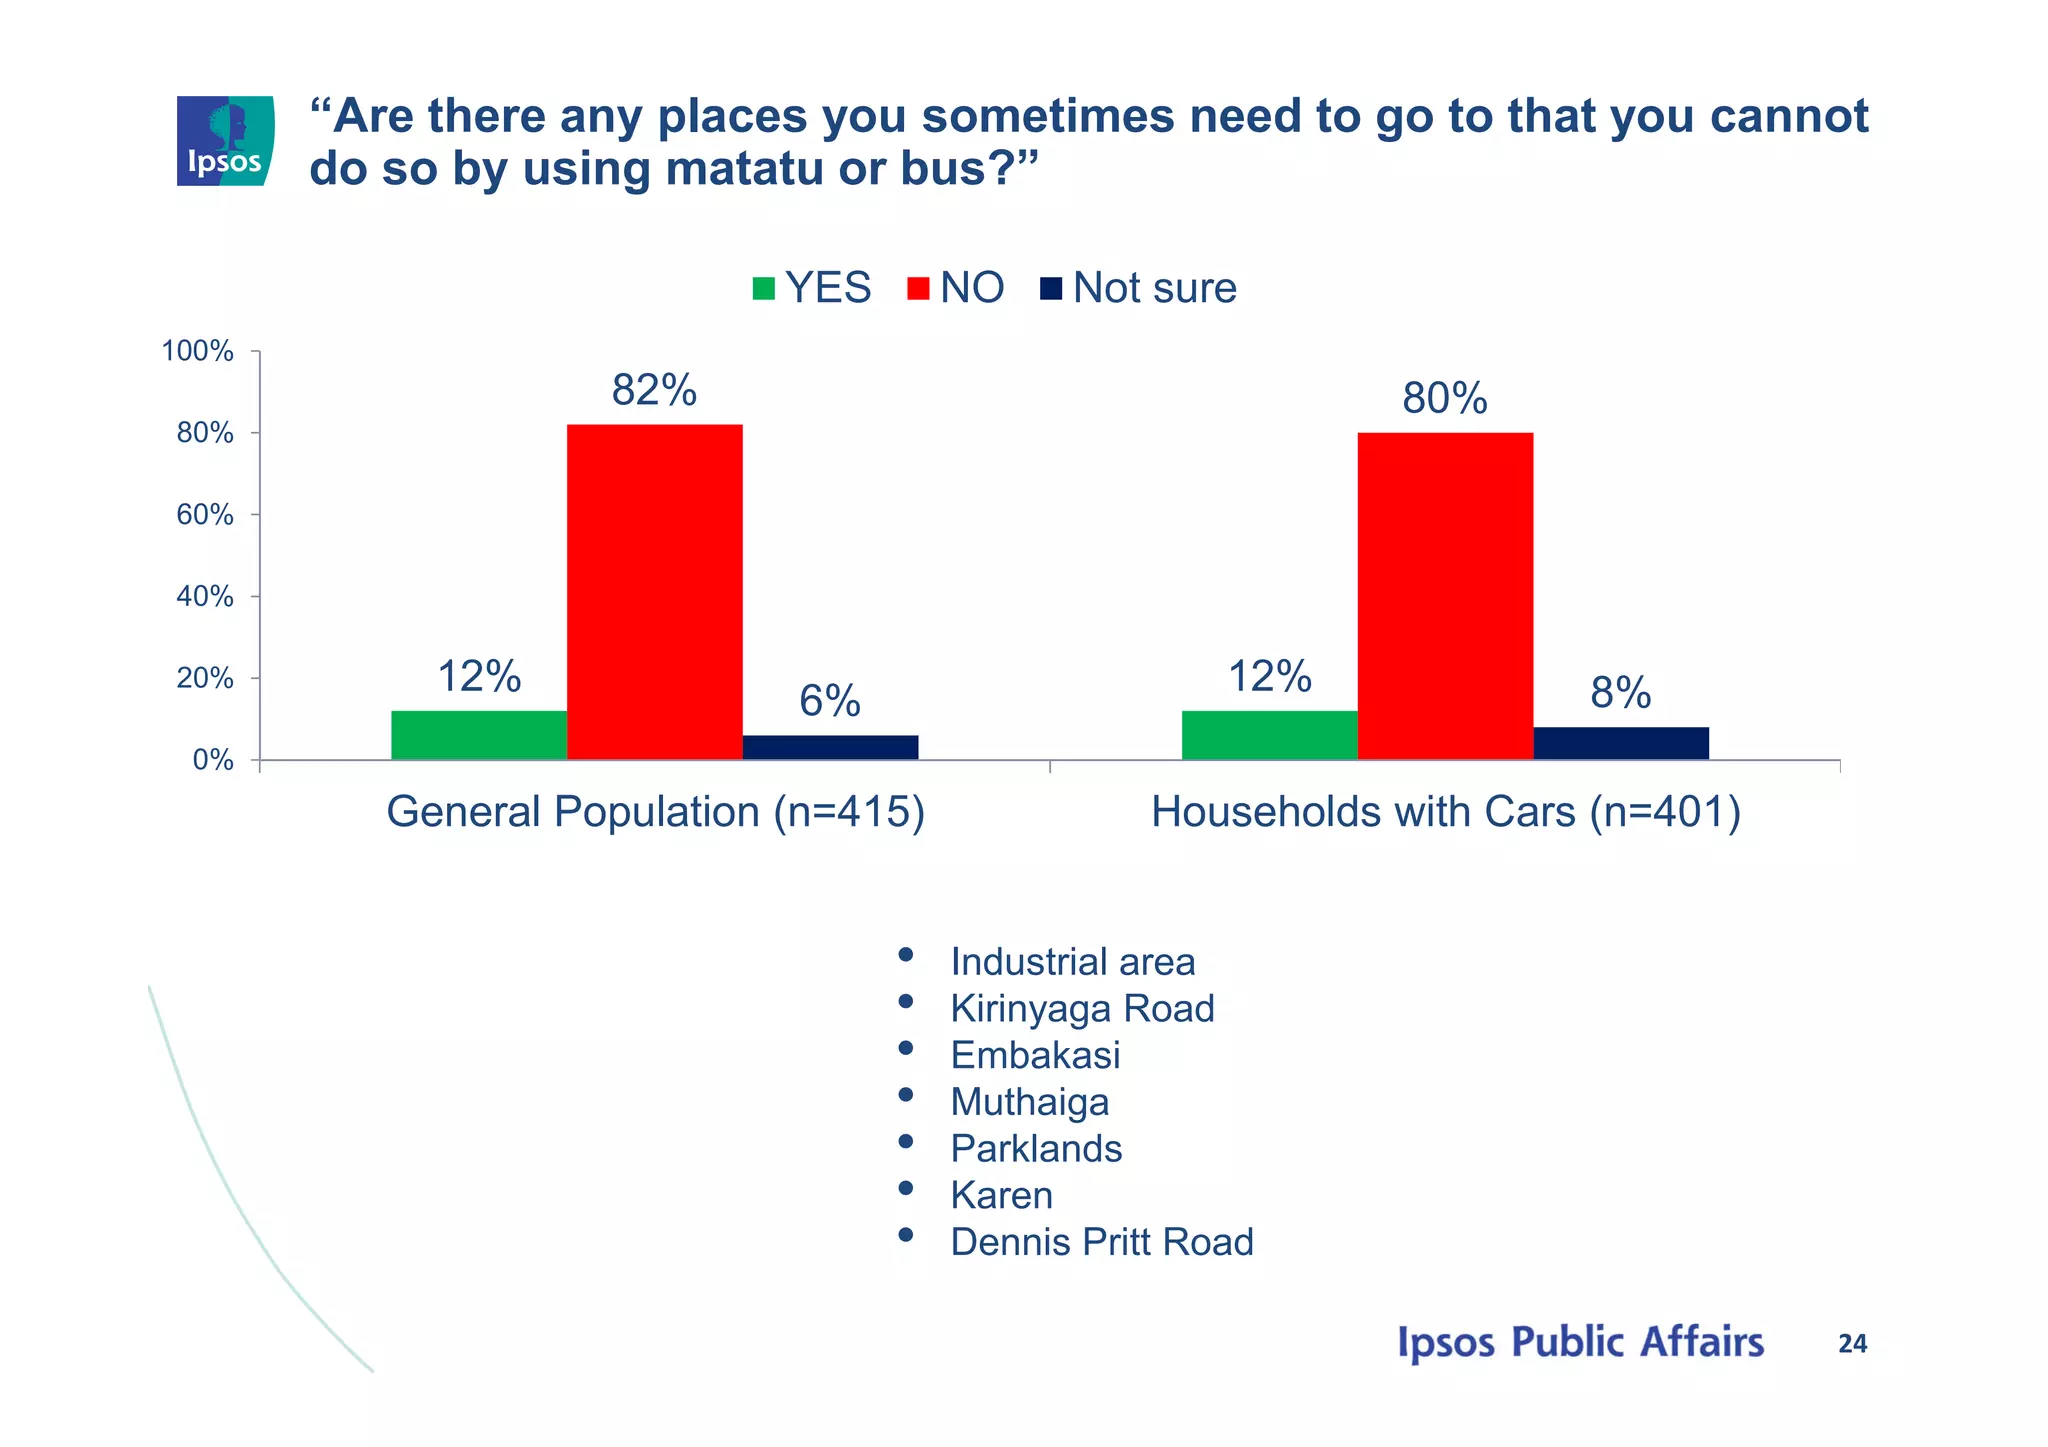


The document presents a transport sector survey conducted in Nairobi City County by Ipsos Limited, highlighting the demographics of participants and various aspects of car ownership and usage. It includes insights on public participation in transport policymaking, common travel destinations, and experiences with crime related to transportation. Key findings reveal significant time lost due to traffic, accessibility issues, and public opinions on non-motorized transport options.