Download to read offline
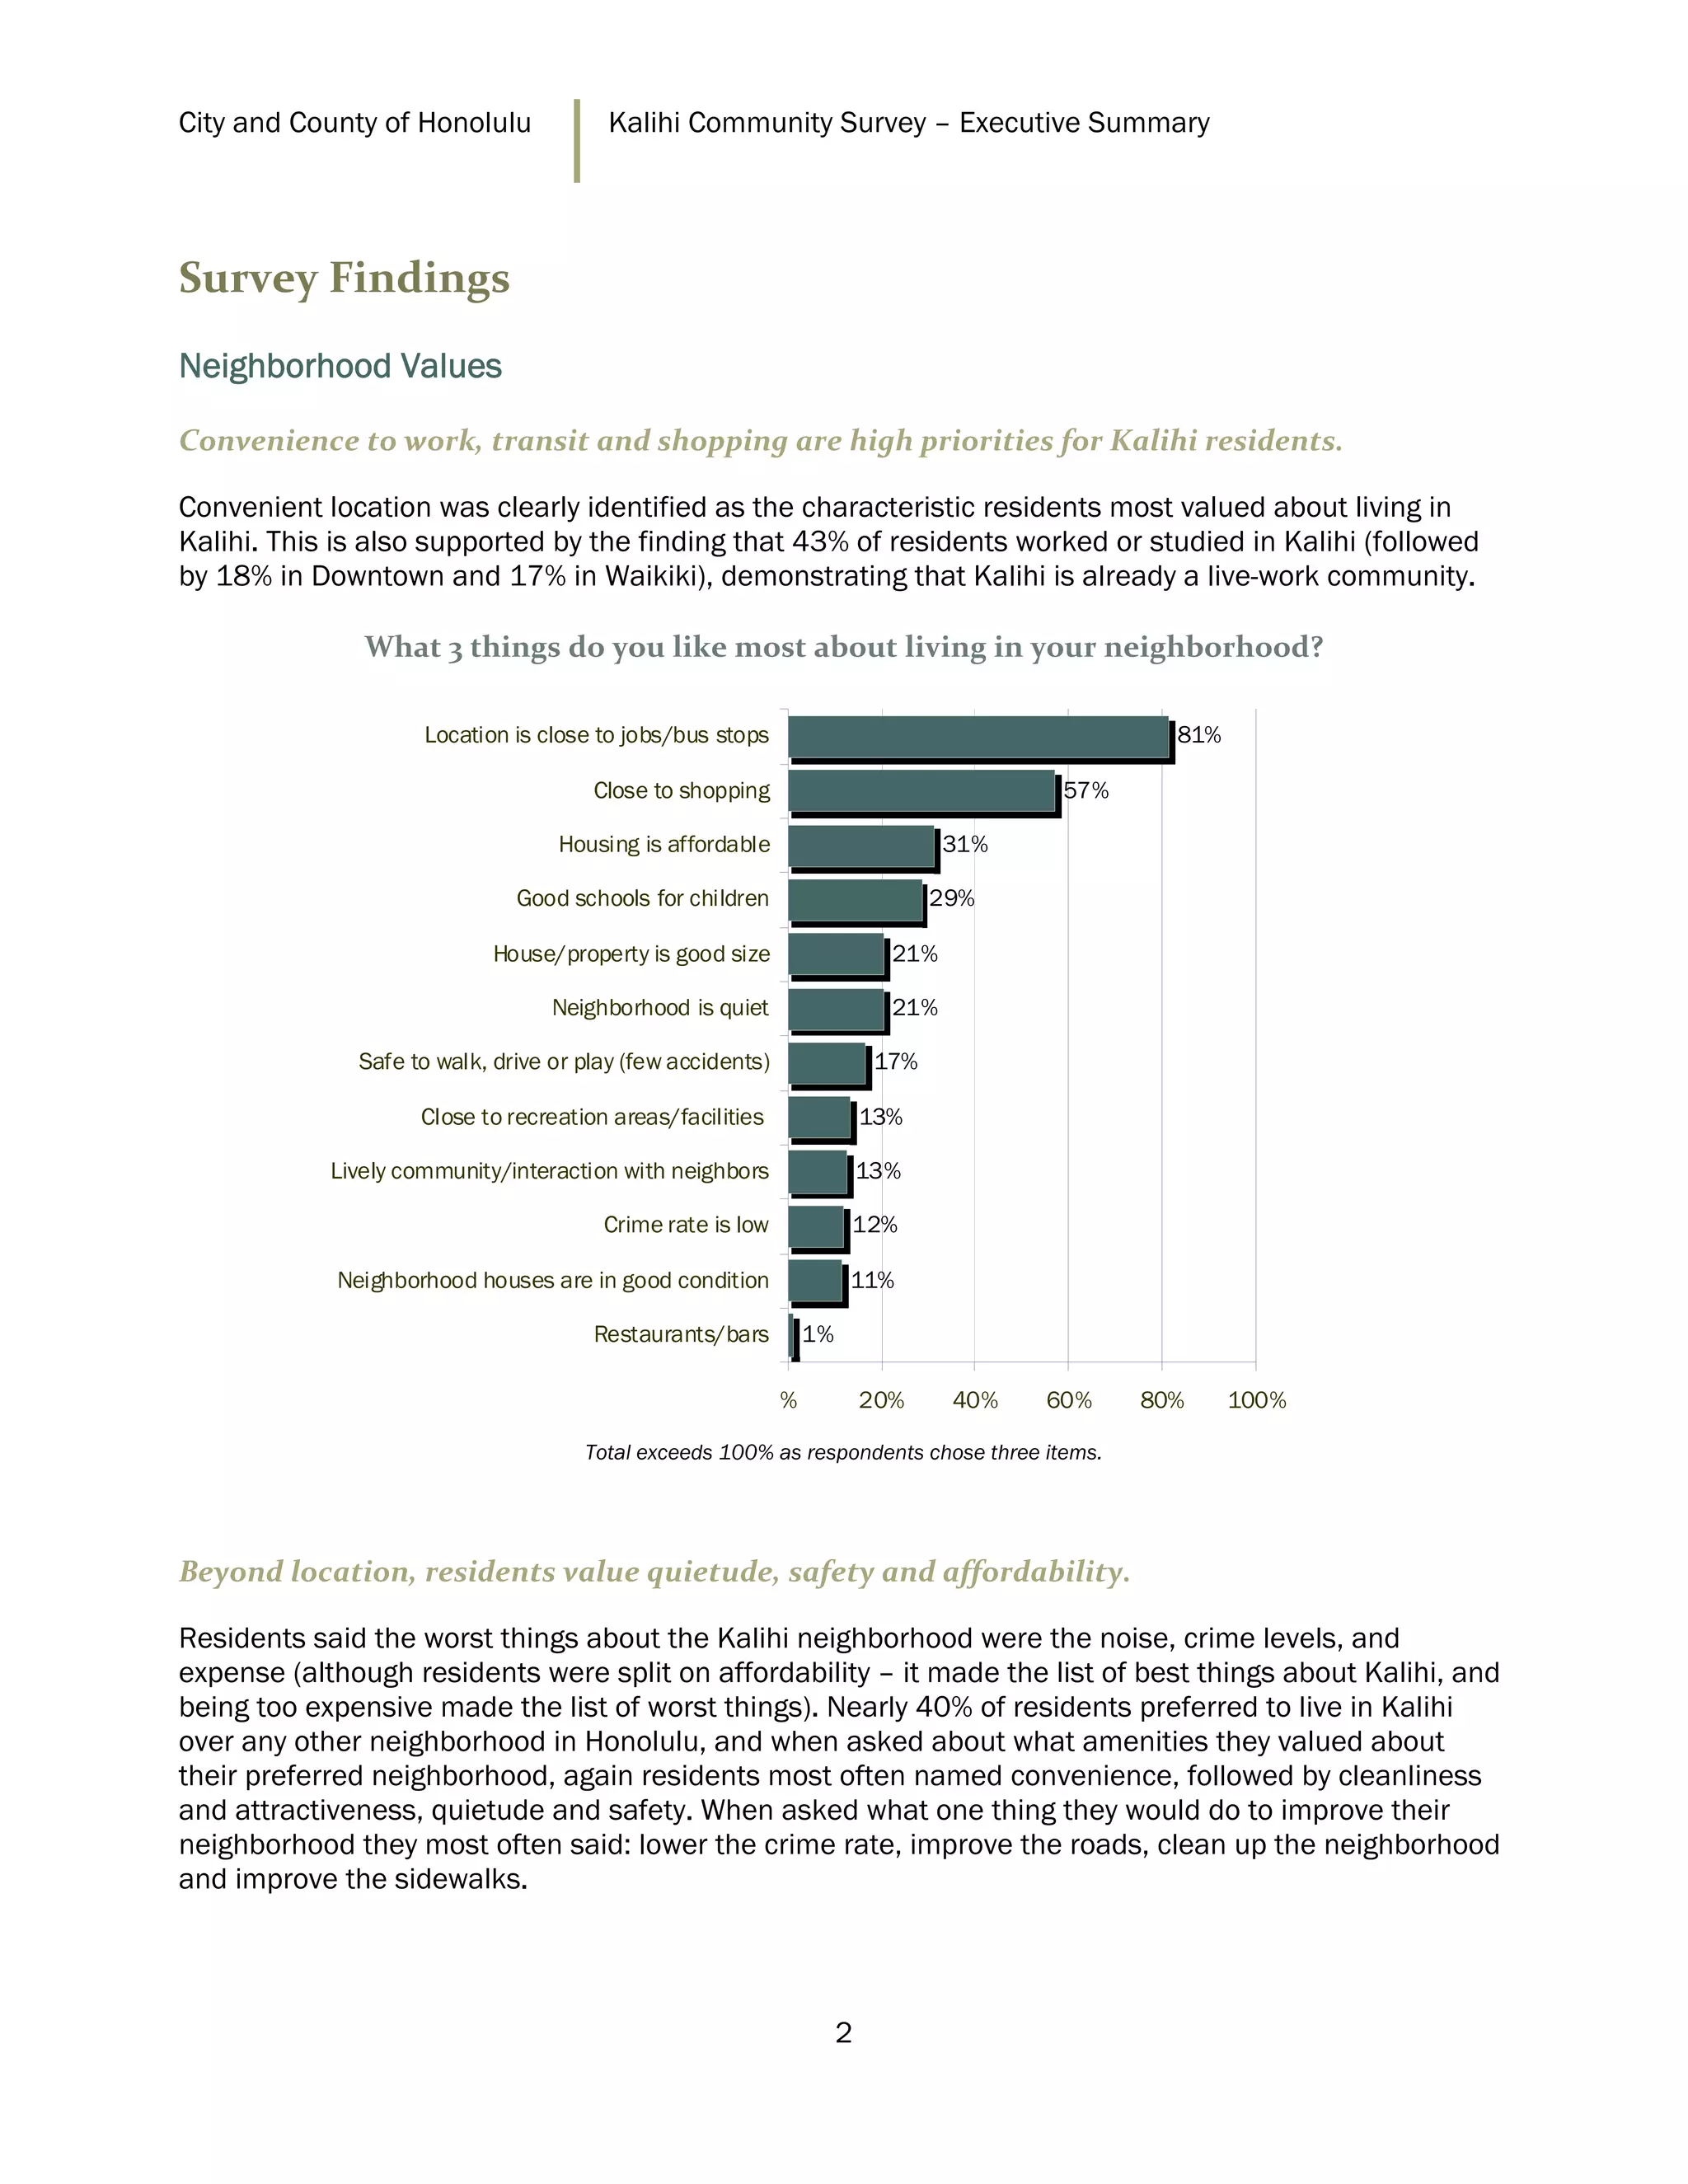
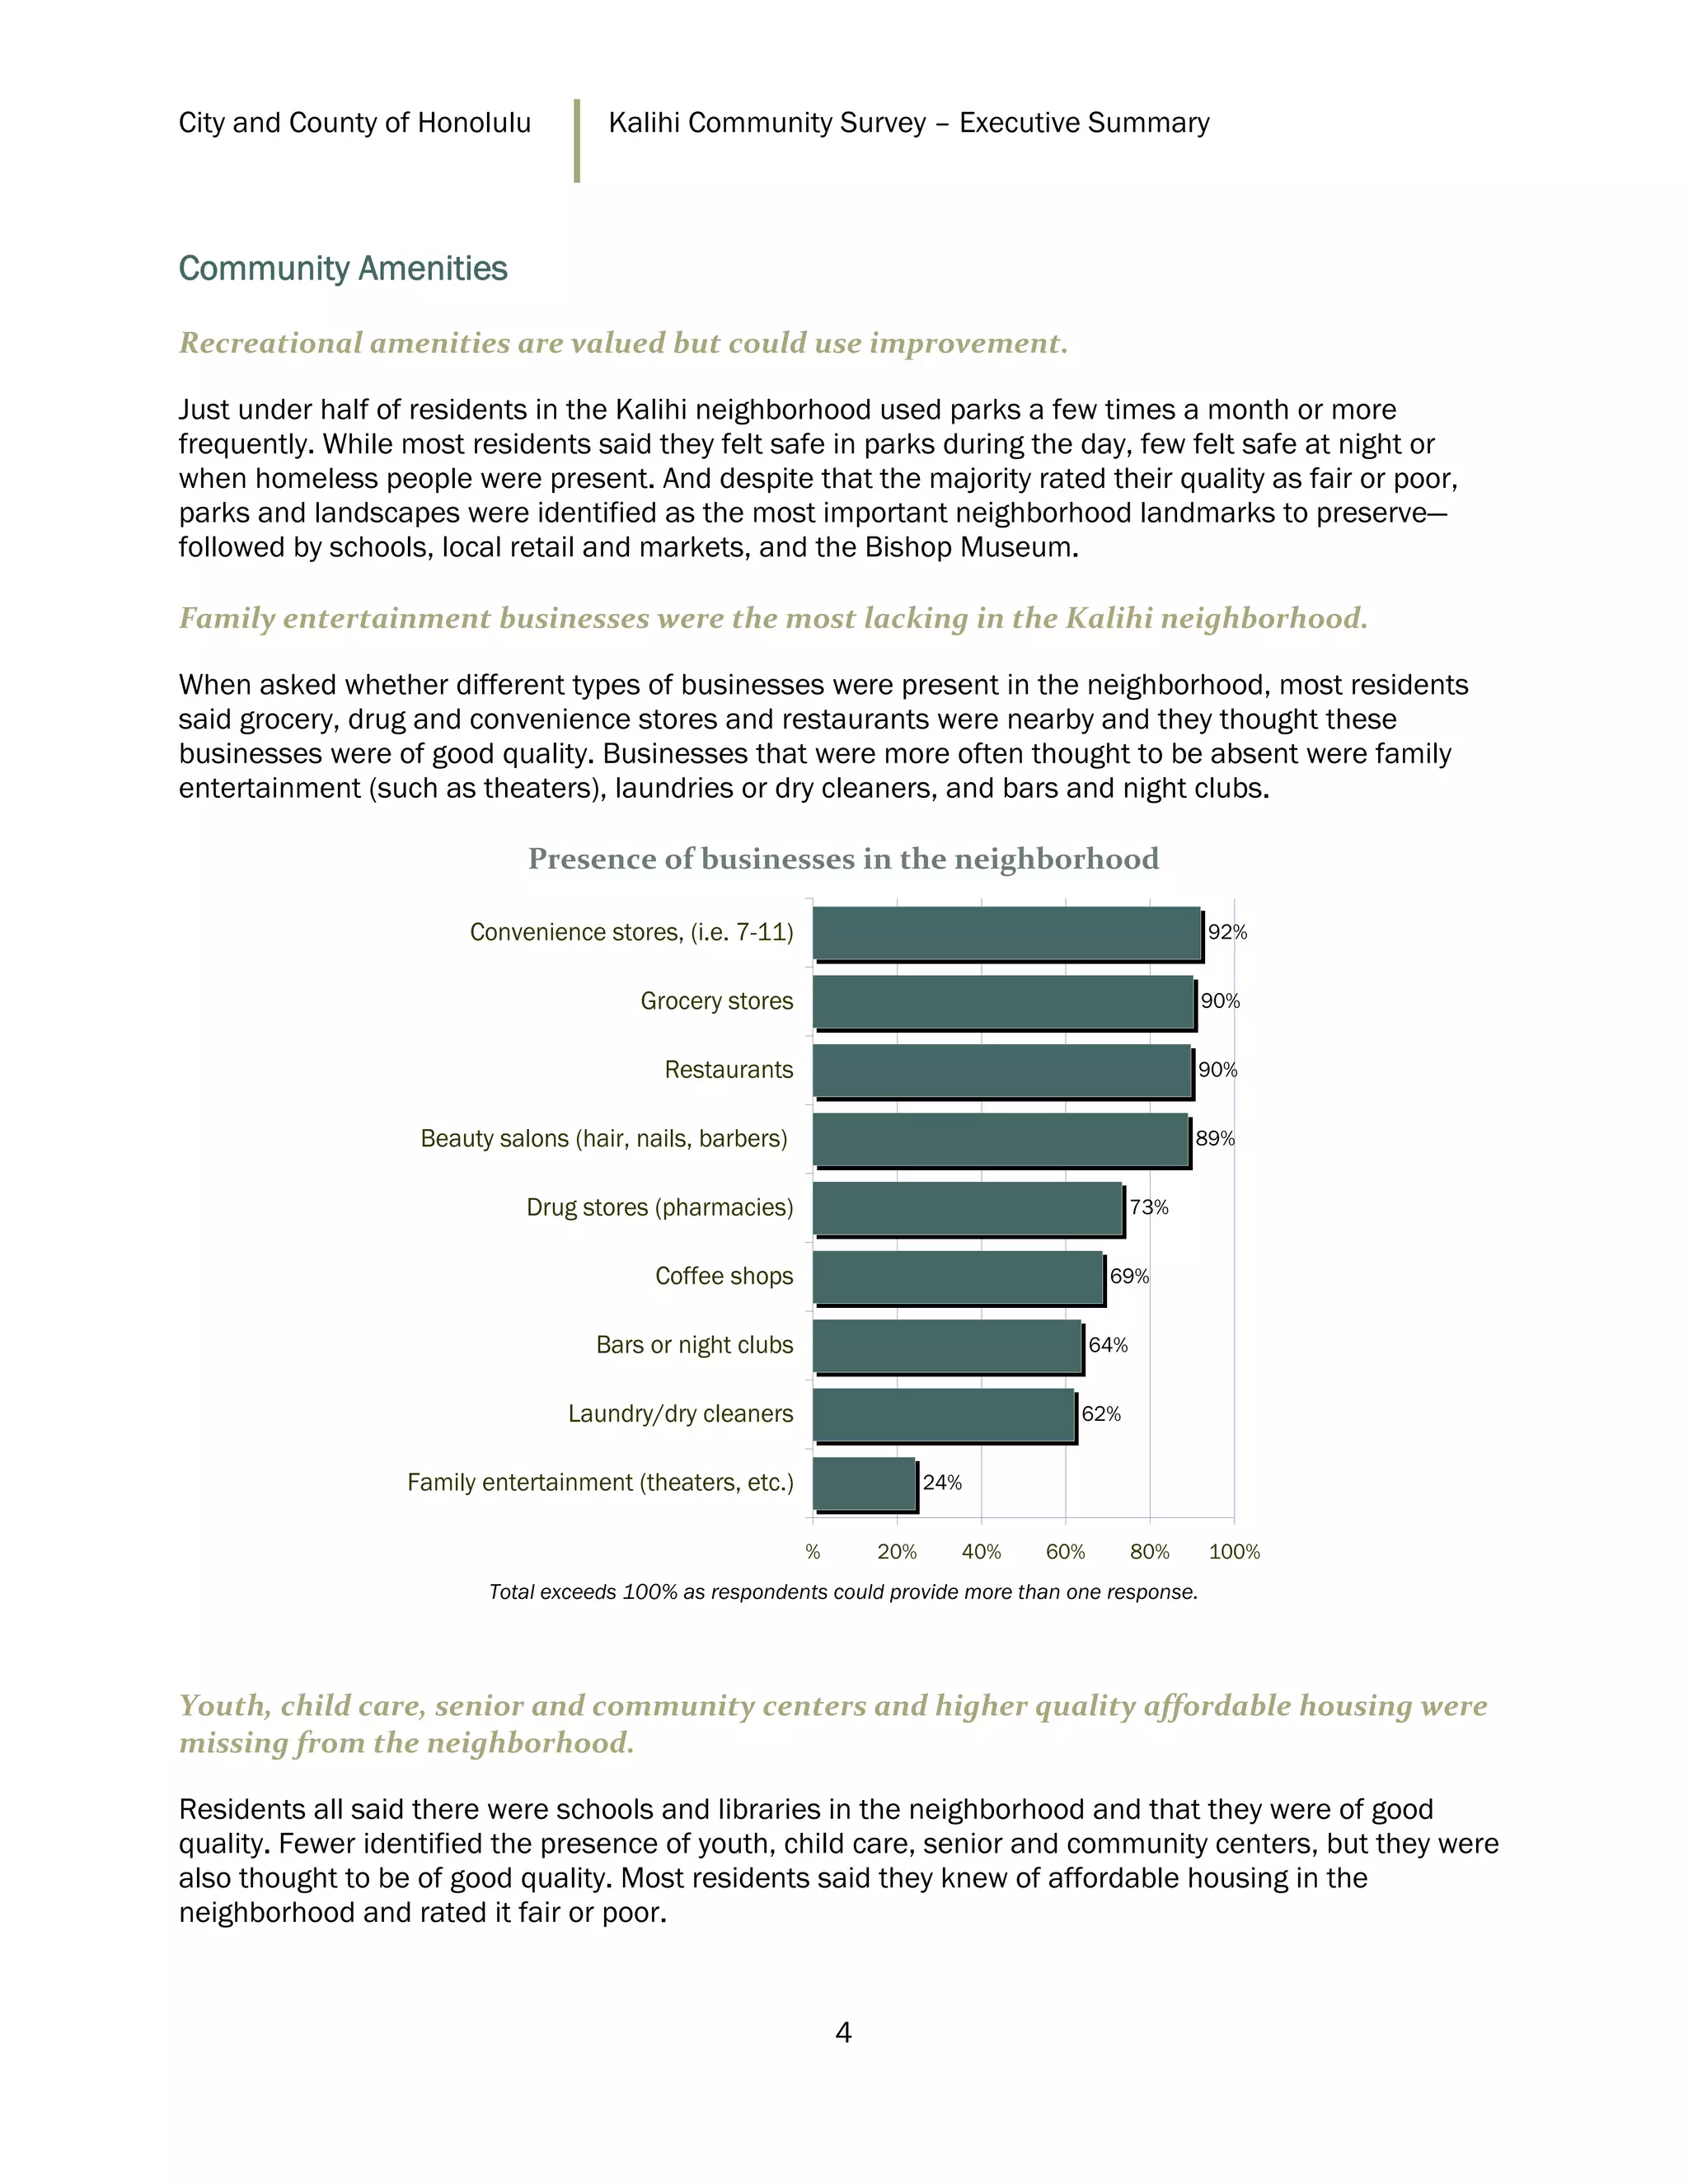
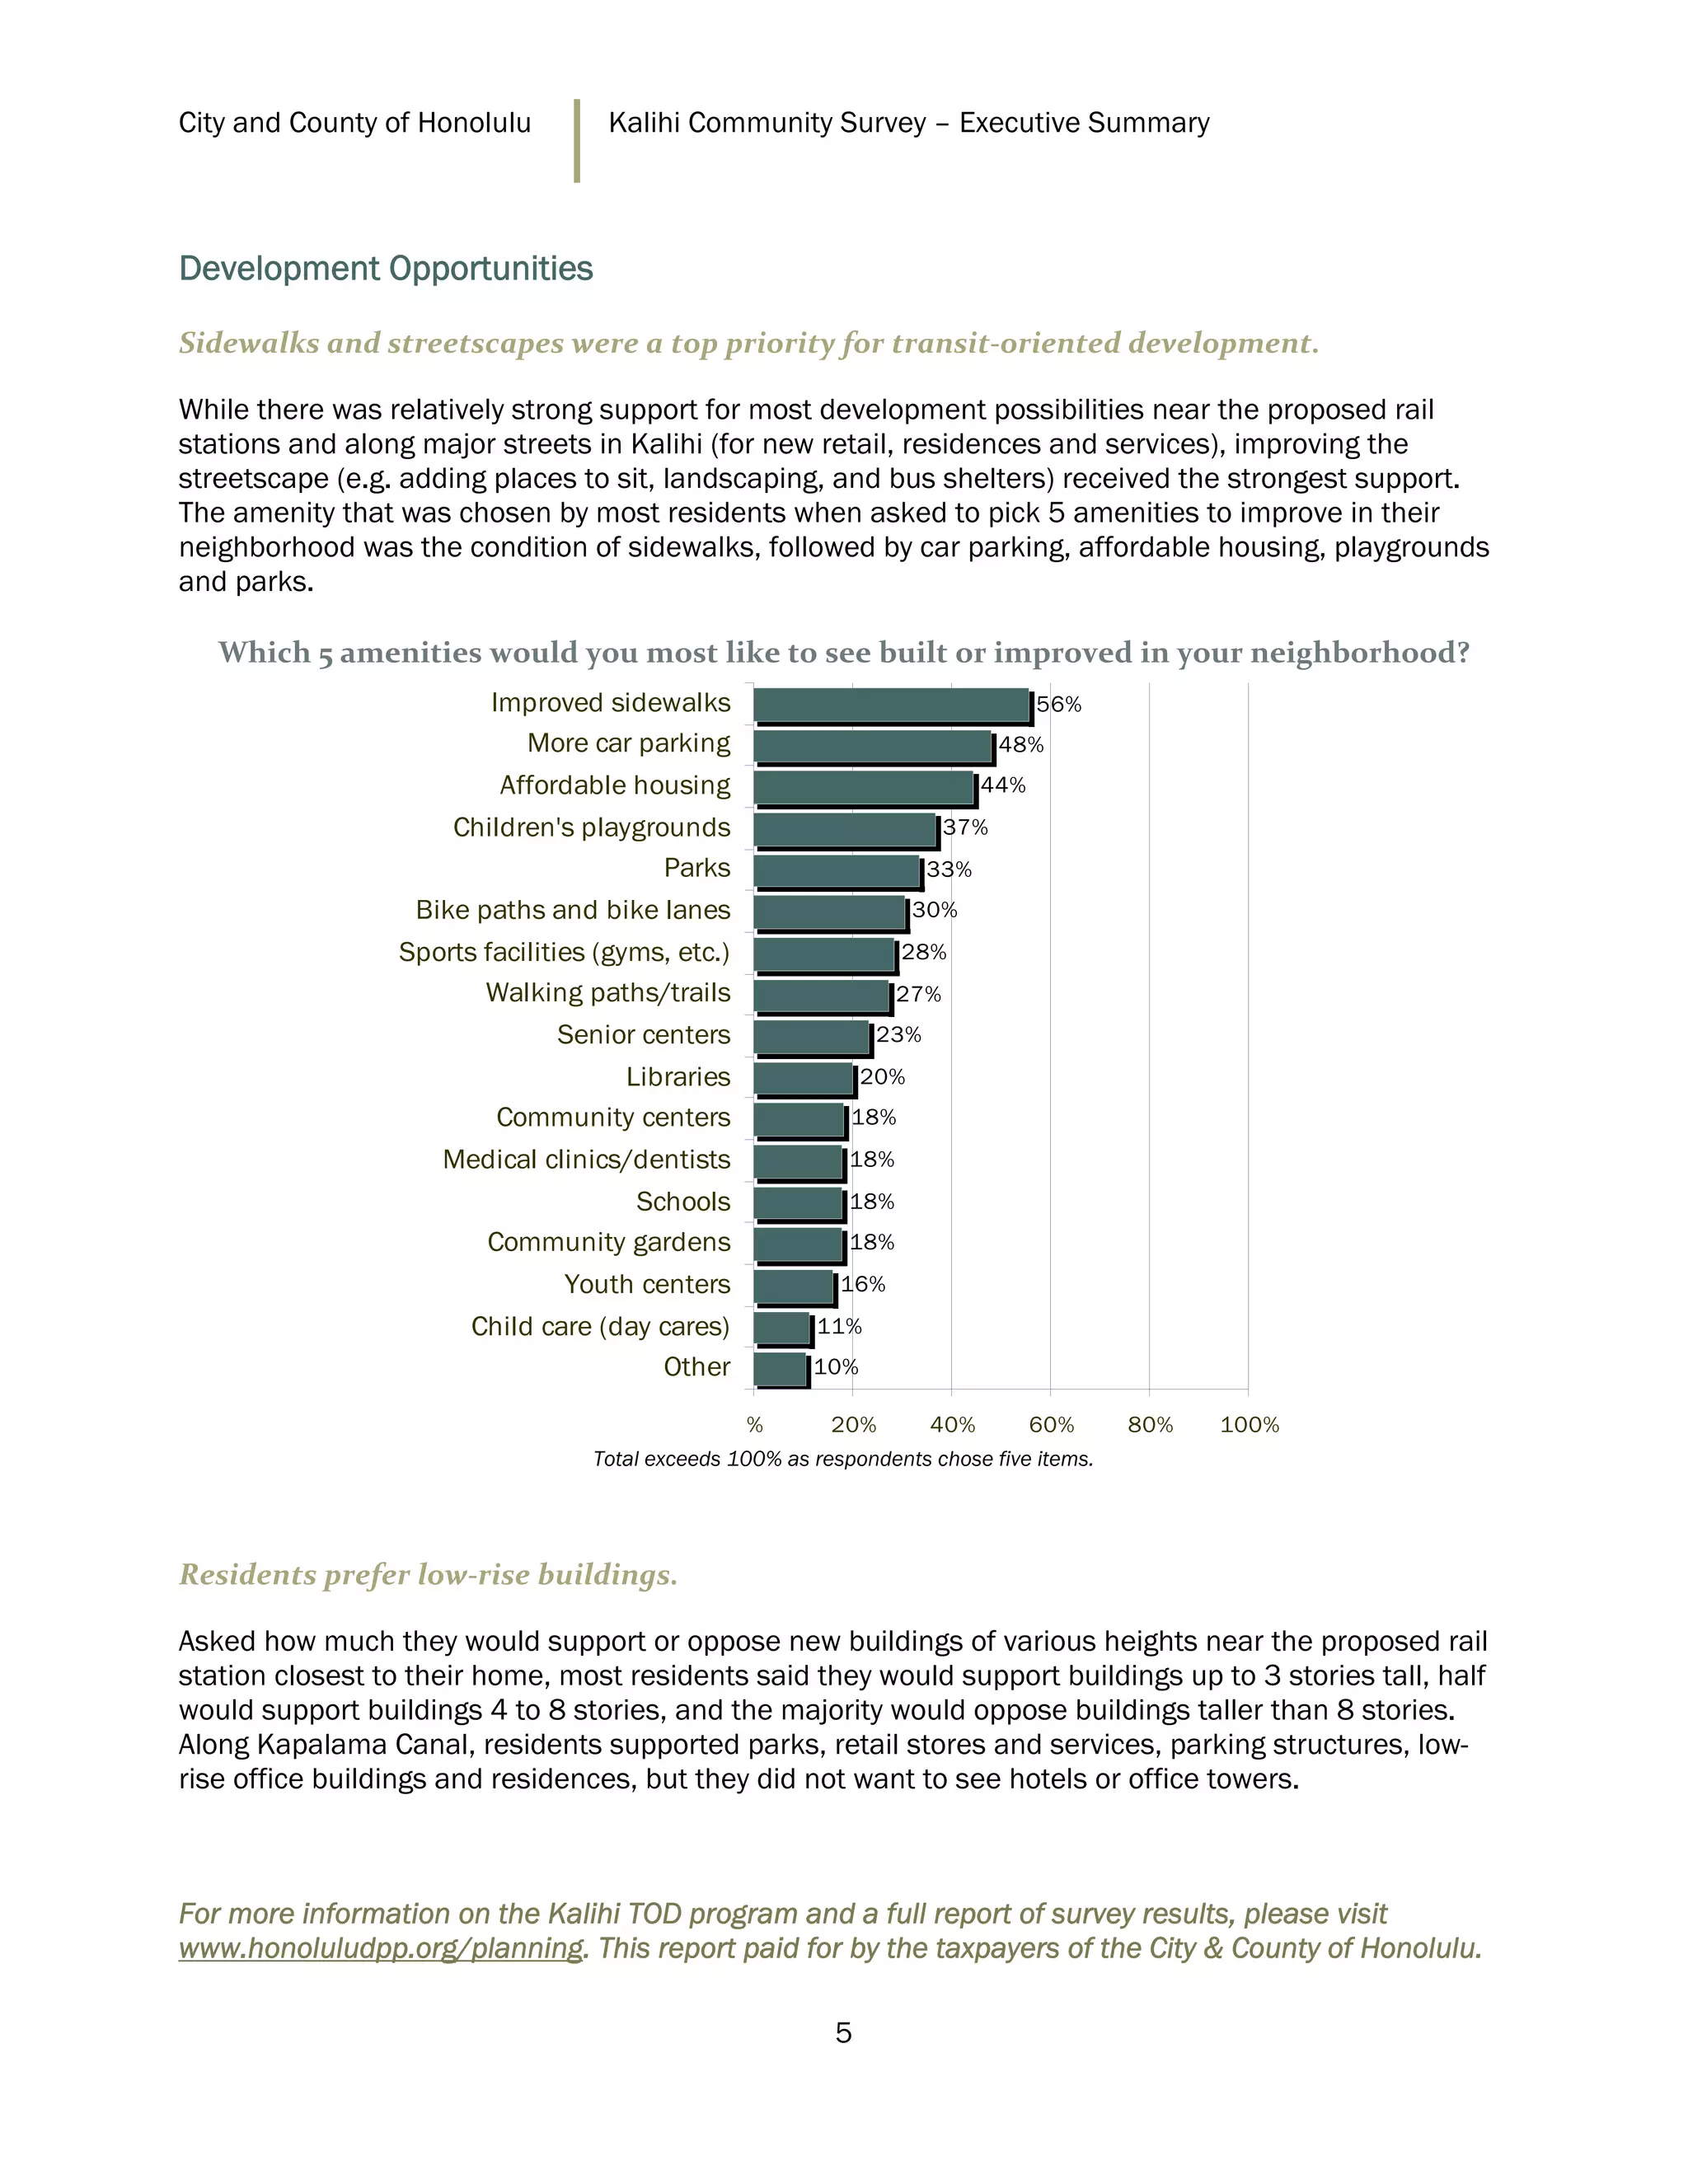

The Kalihi neighborhood transit-oriented development plan survey captured resident perspectives on development opportunities near three planned rail stations in Kalihi. Key findings highlighted residents' priority for convenience to work and shopping, with a significant demand for improved sidewalks and streetscapes, as well as concerns about noise and crime. Residents generally support low-rise buildings and a variety of community amenities, although family entertainment options were noted as lacking.


