Download to read offline

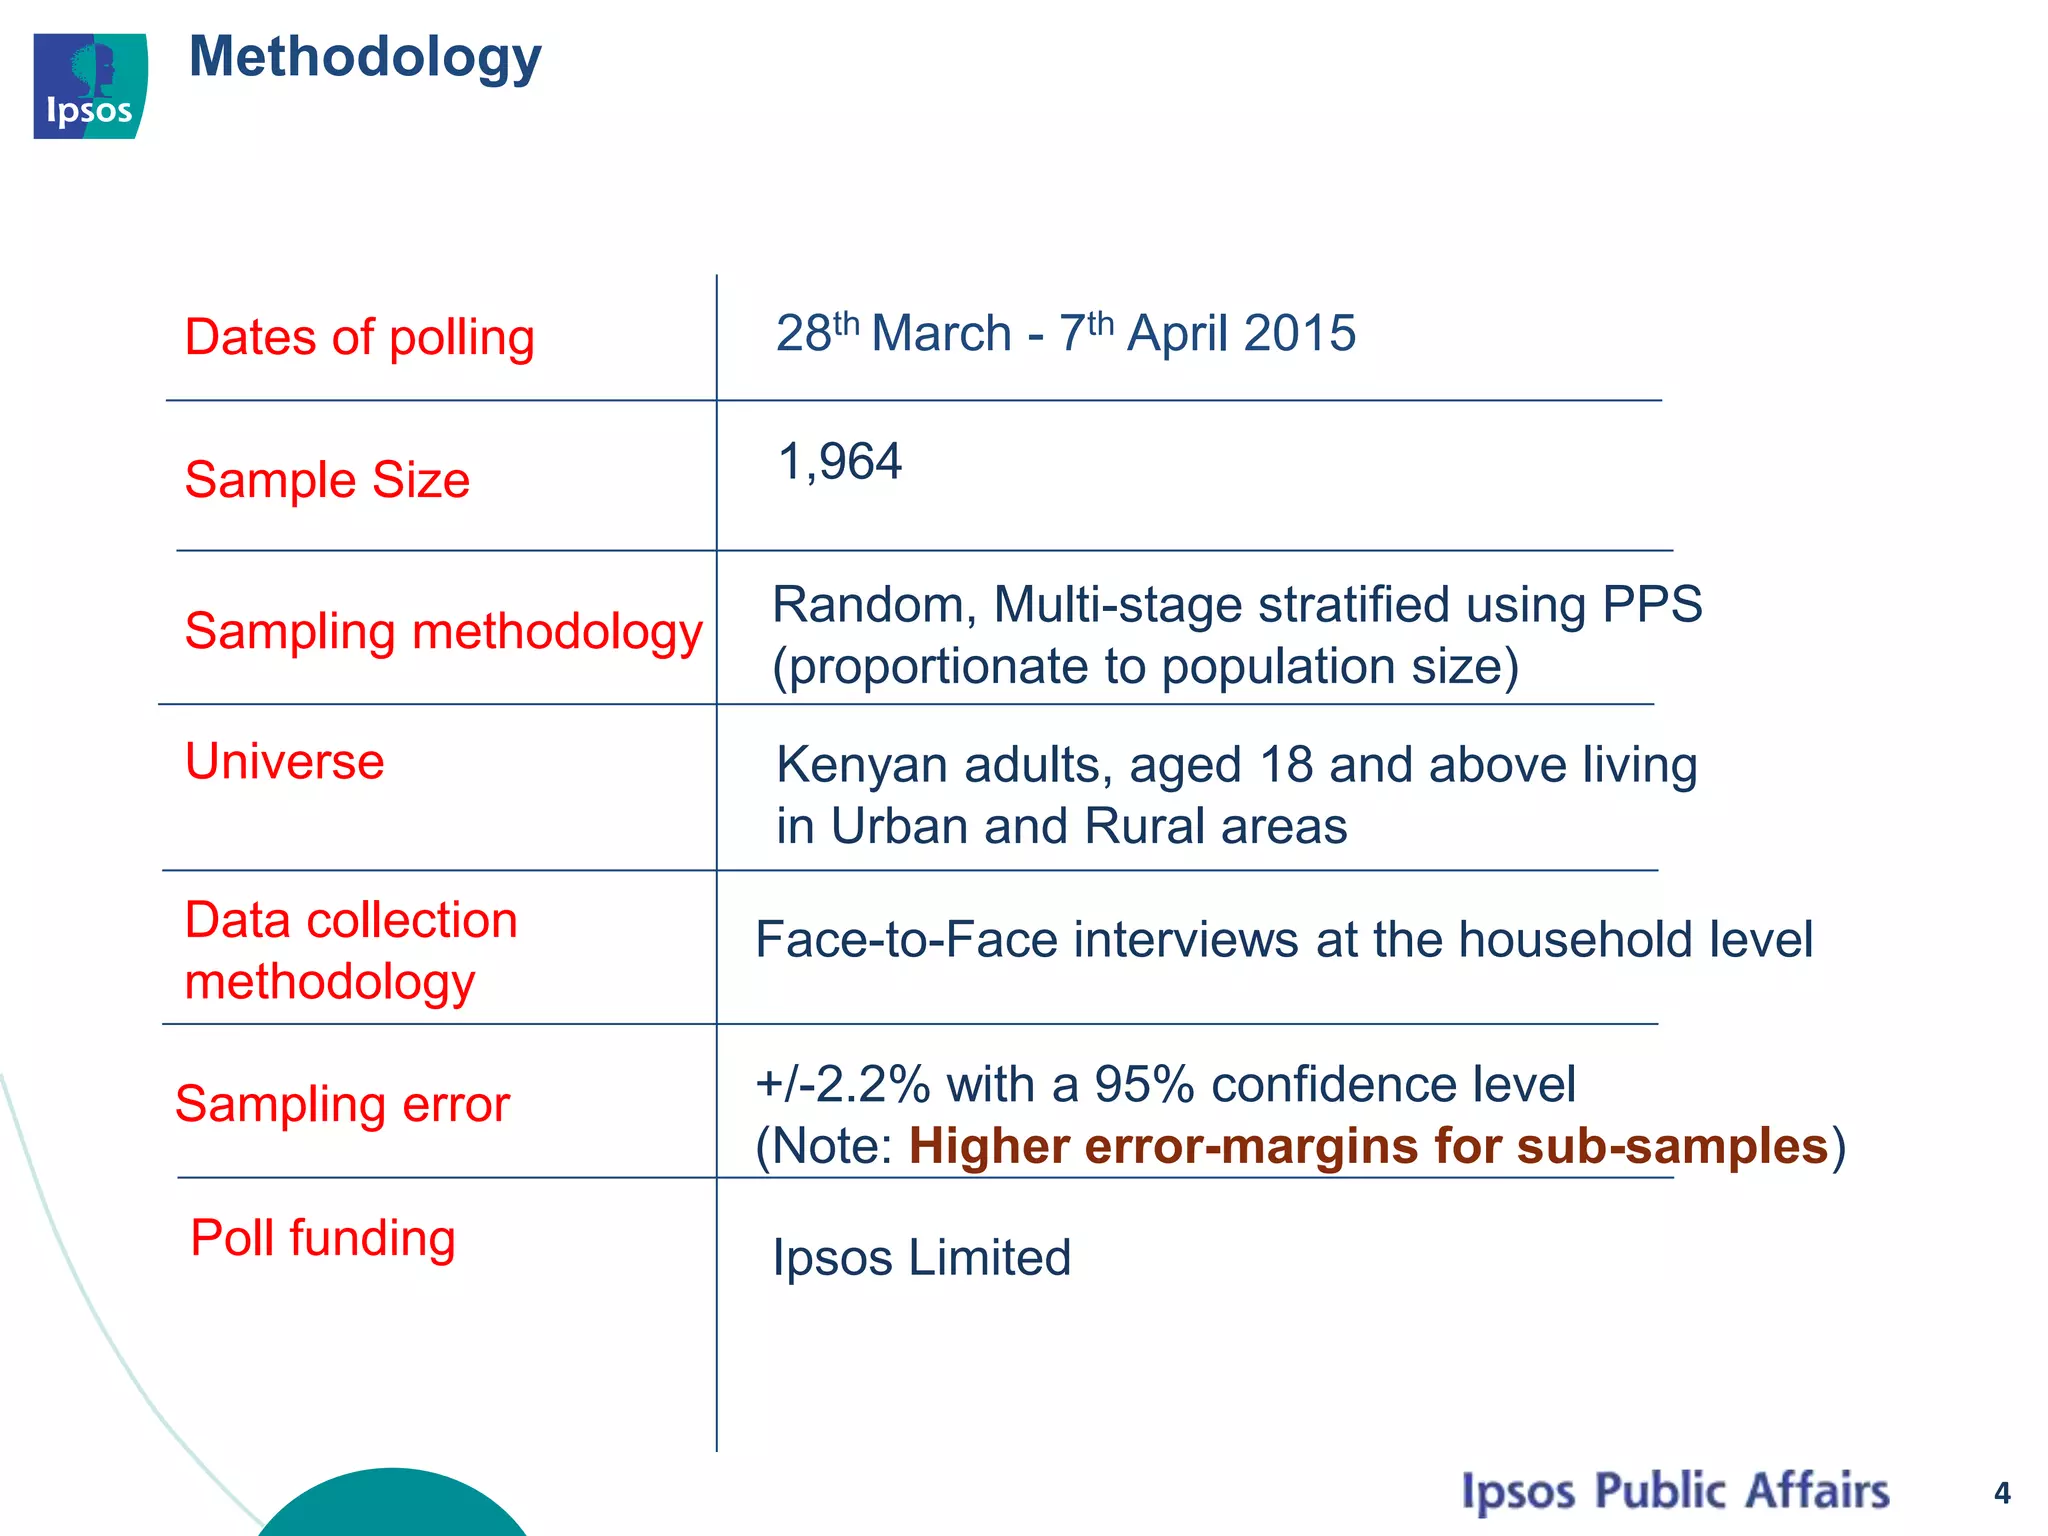
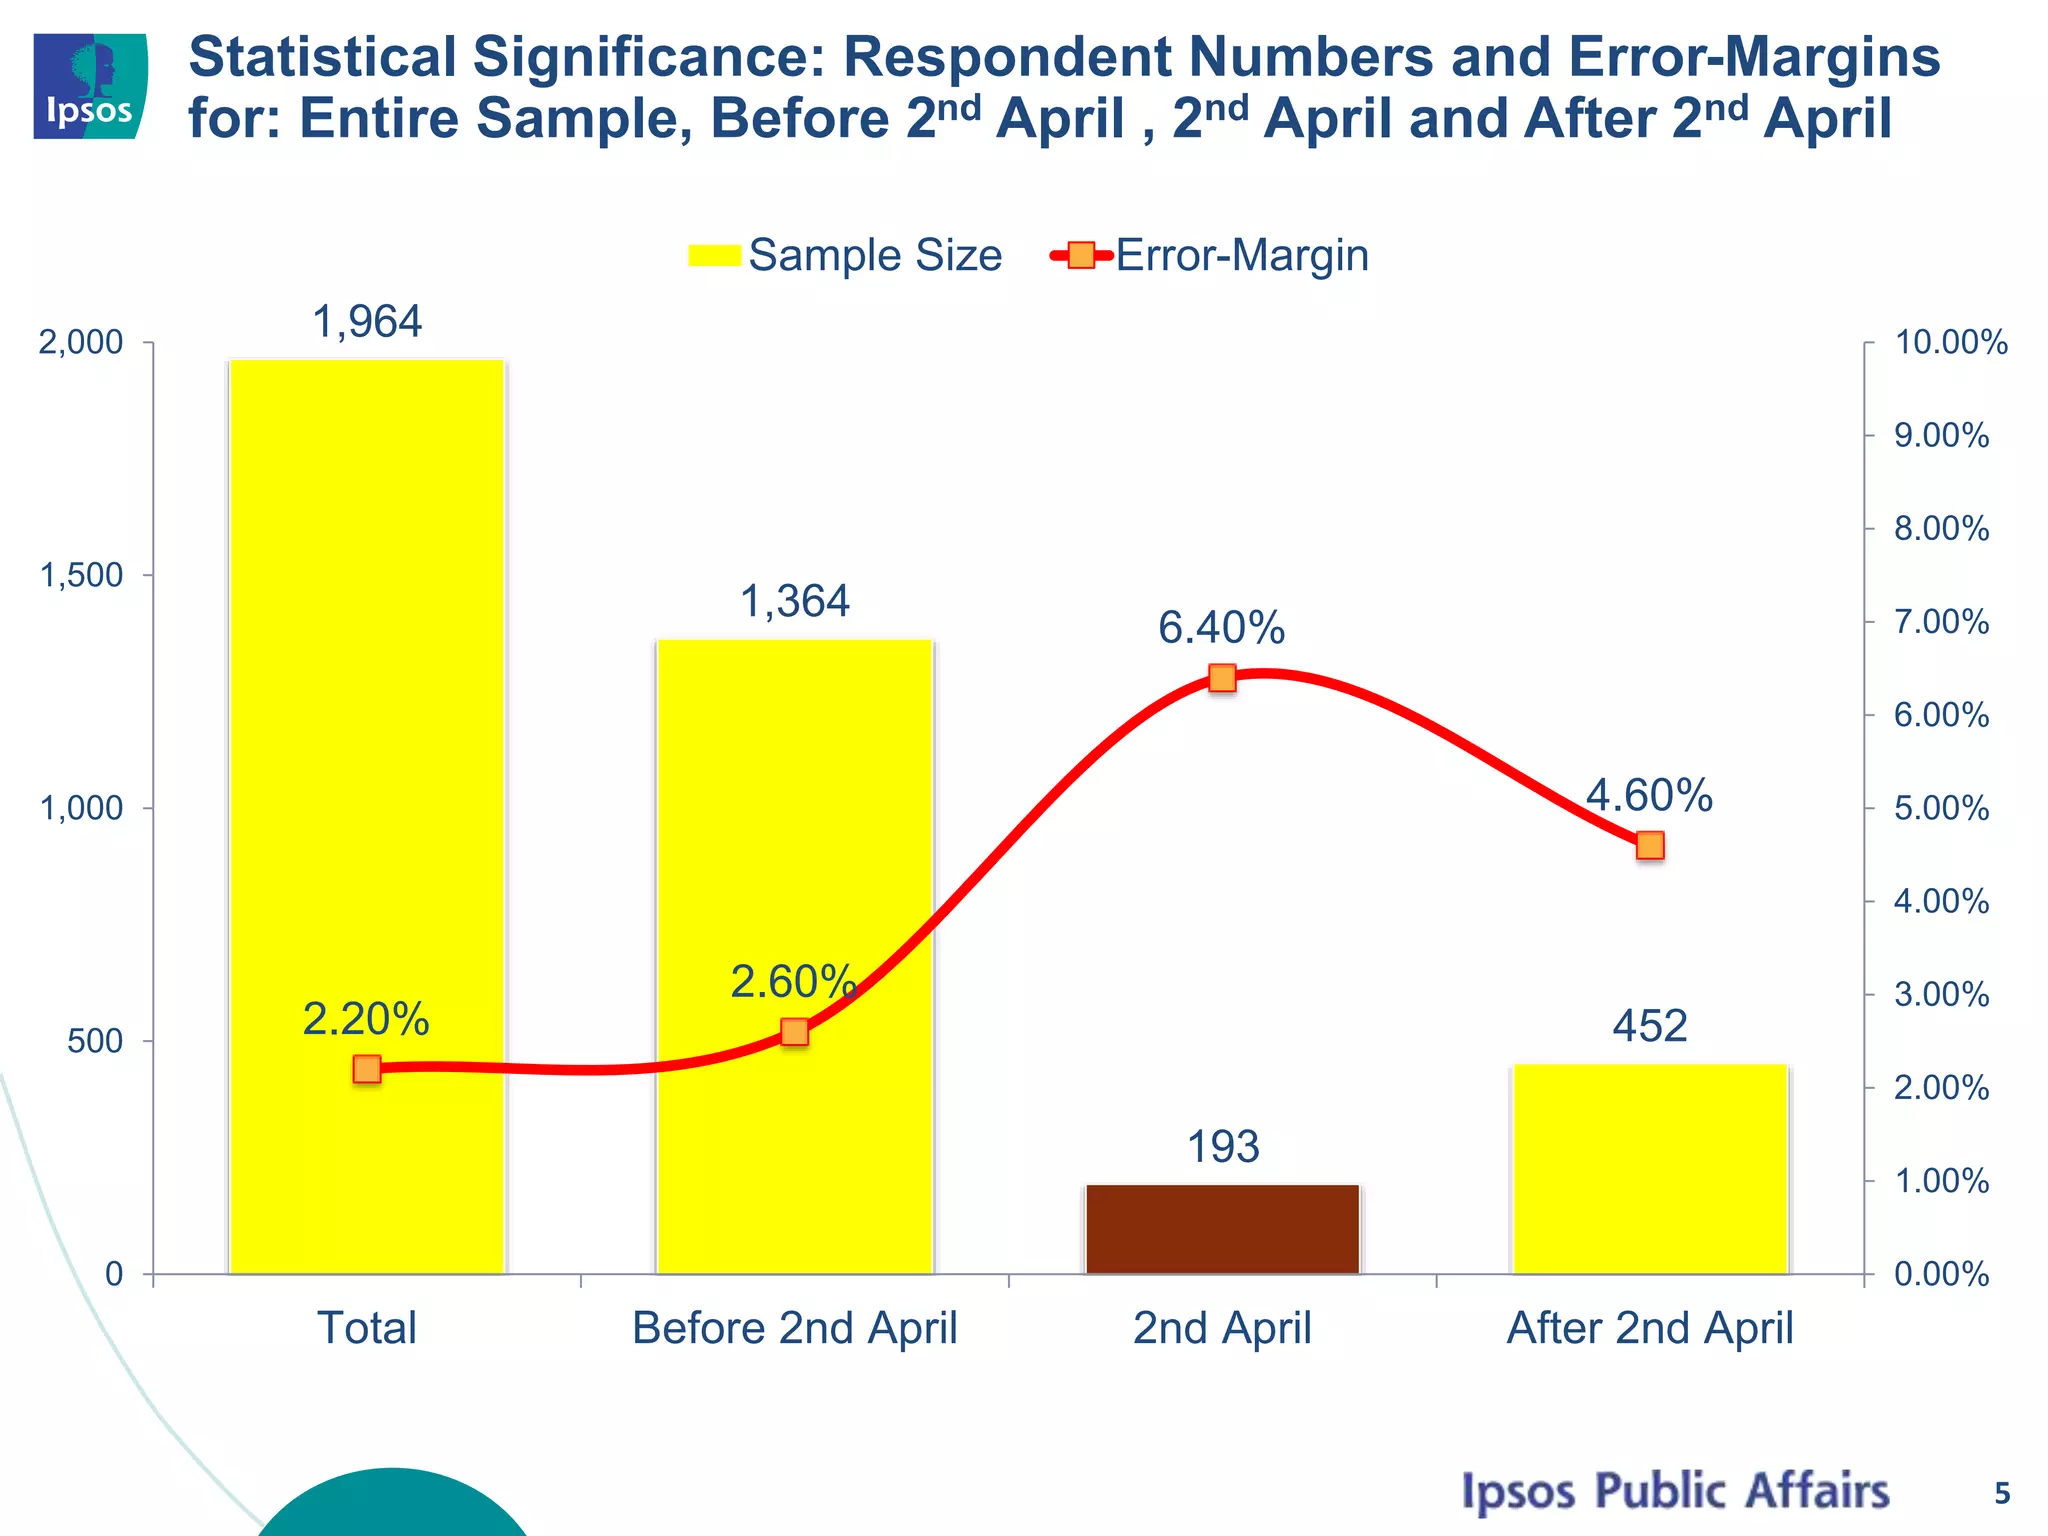
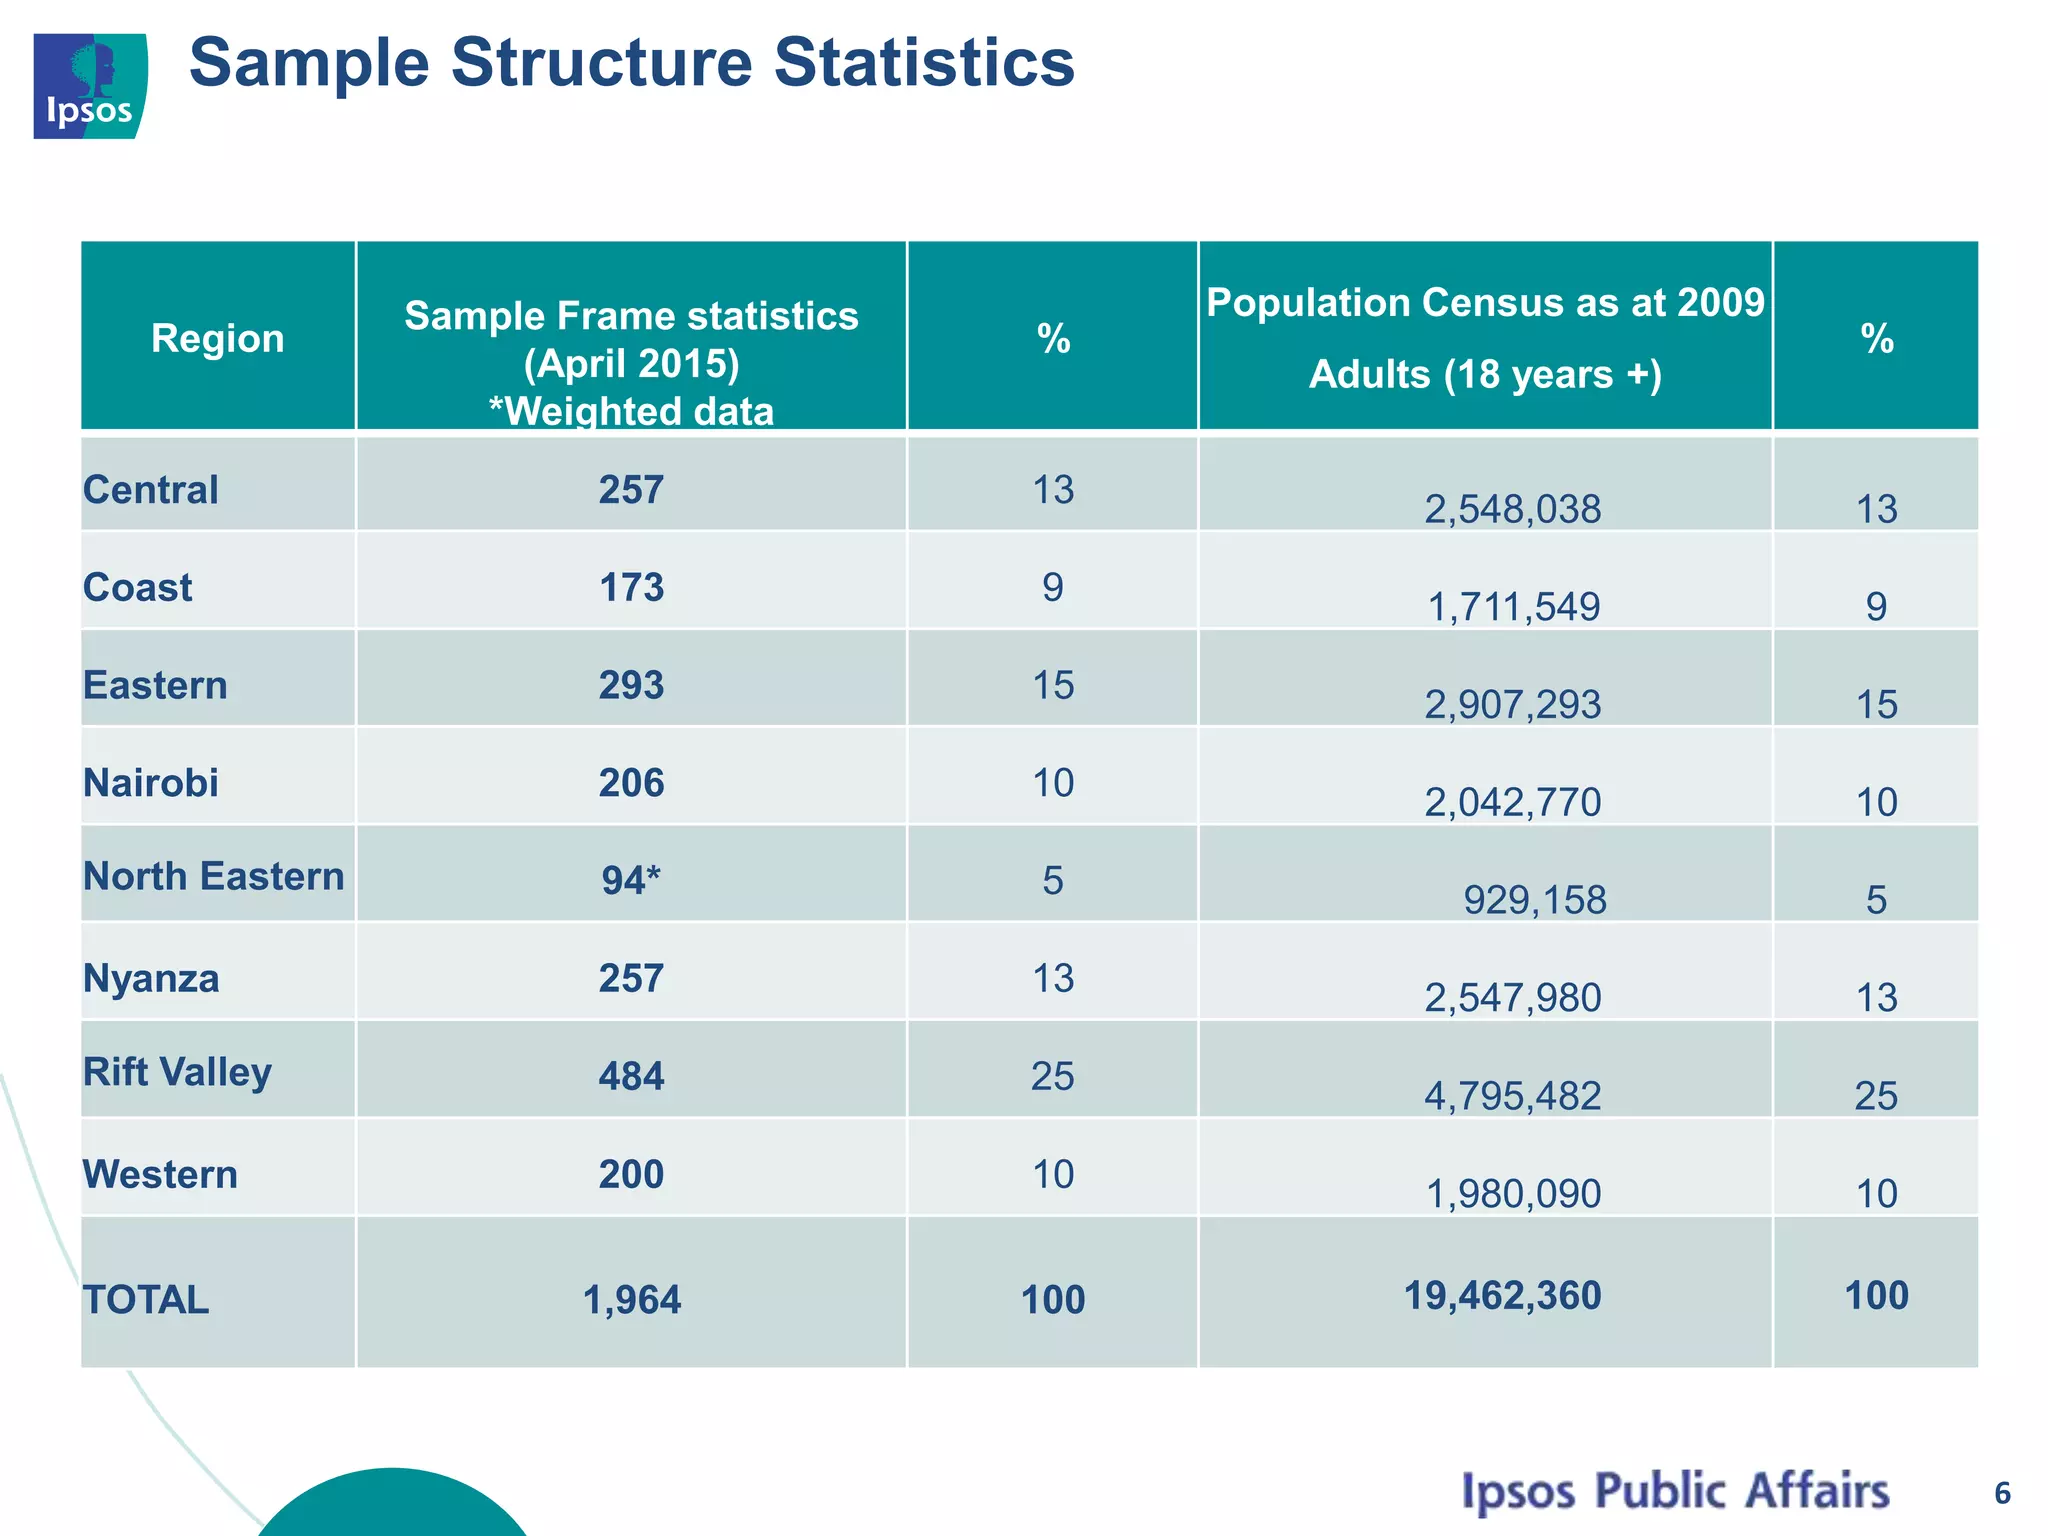
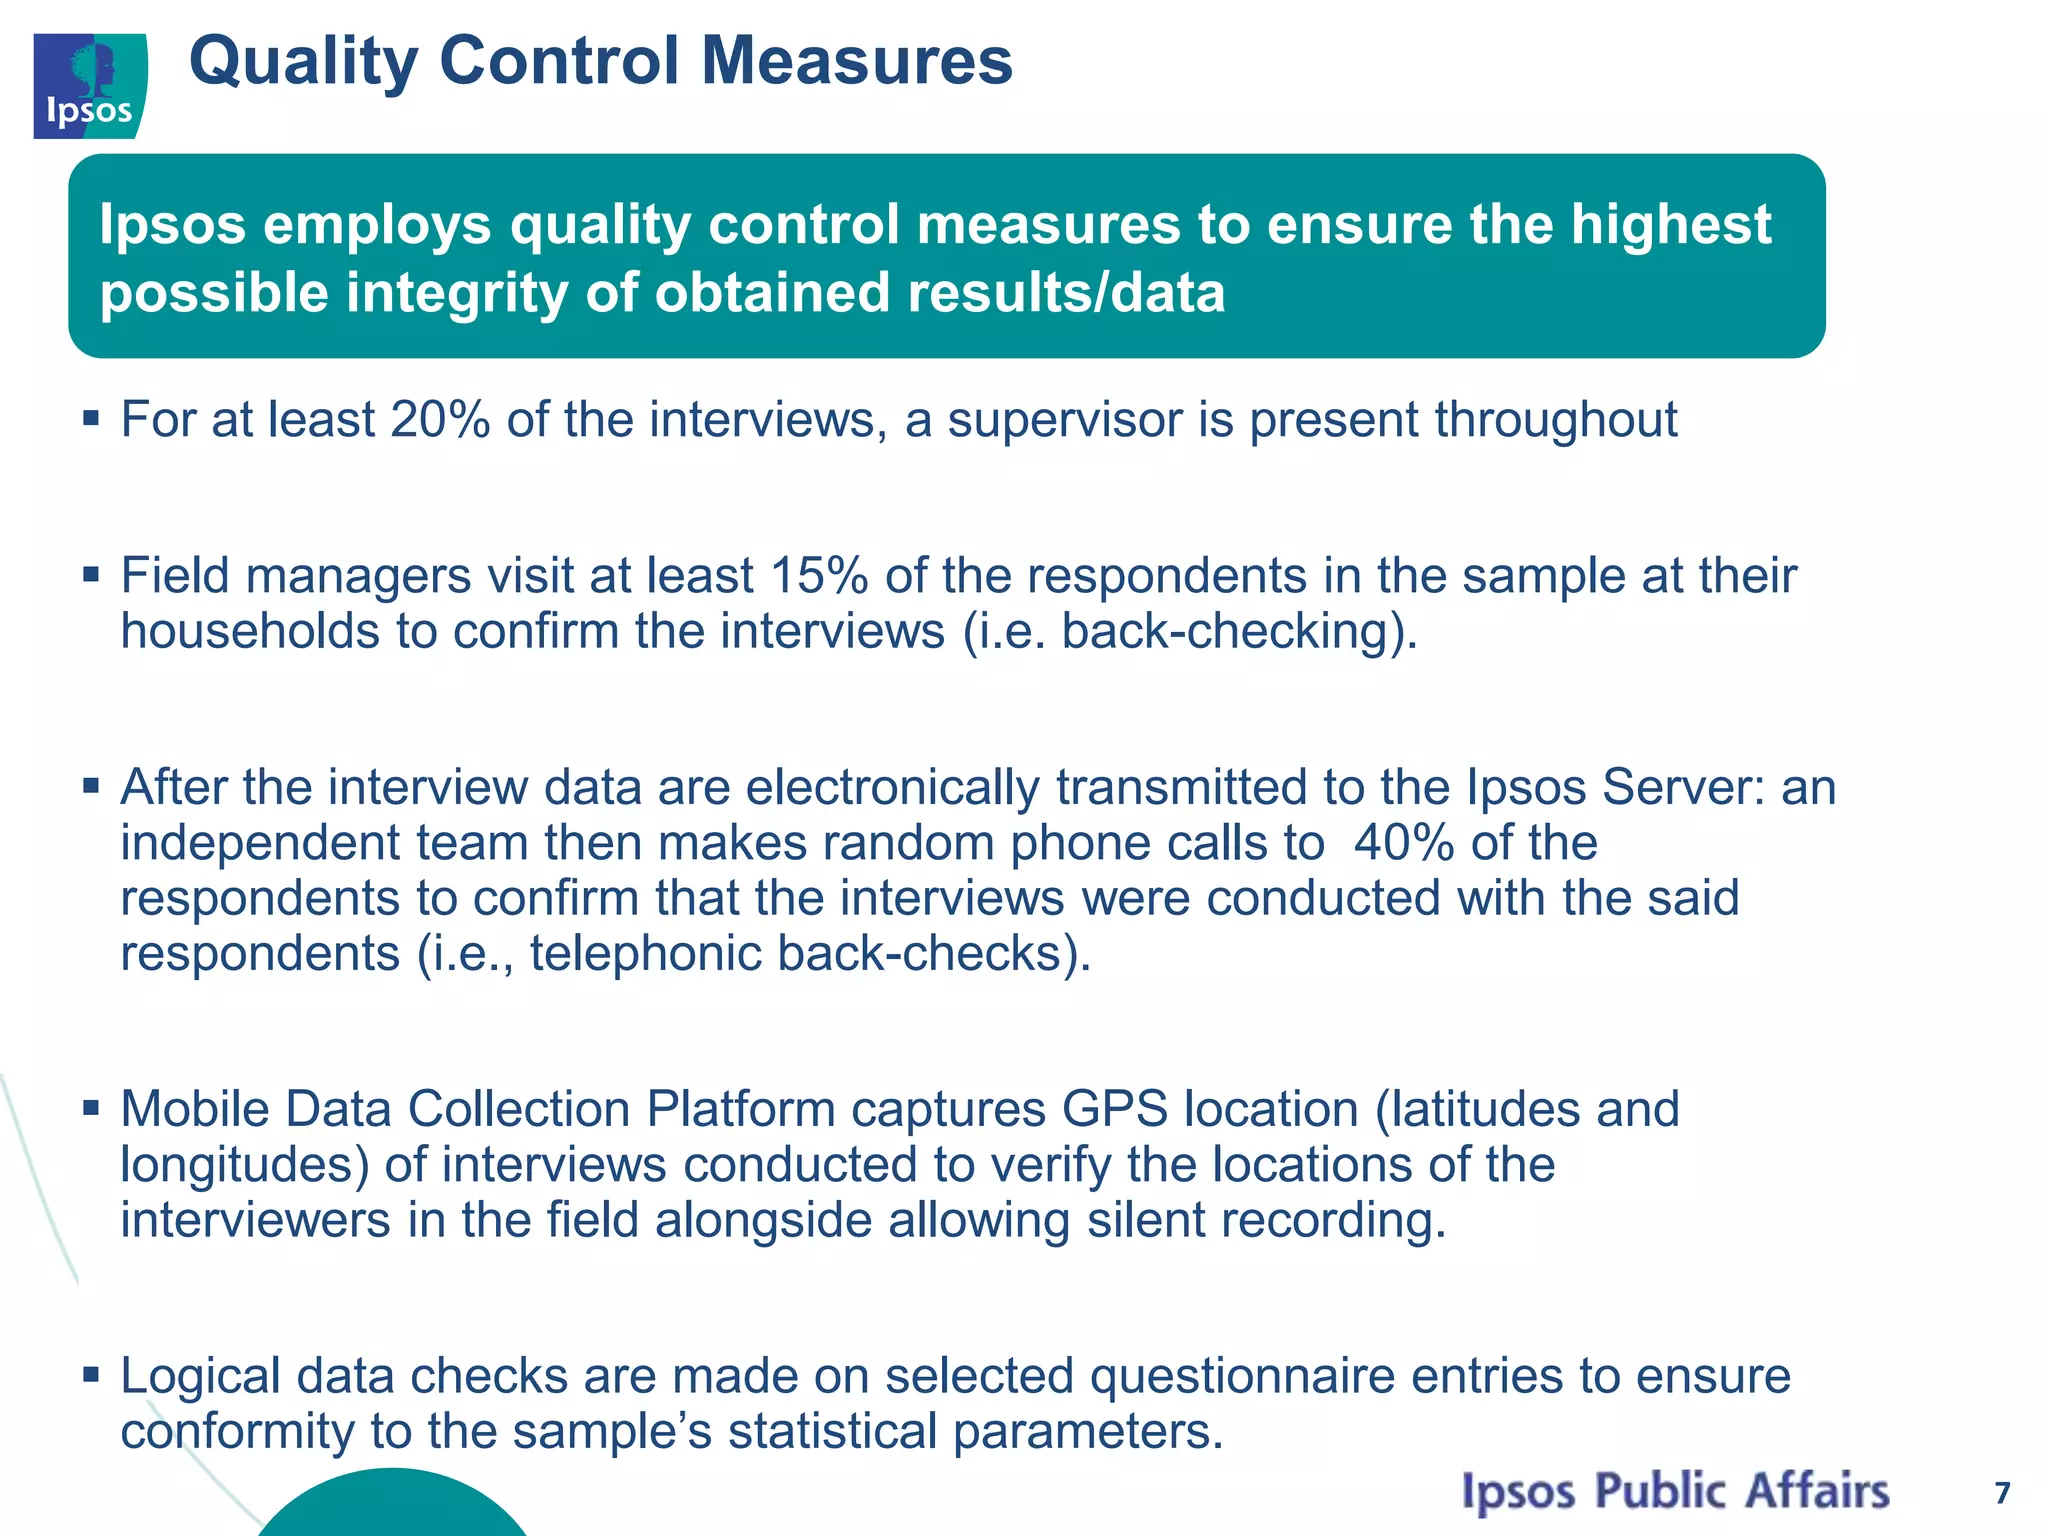
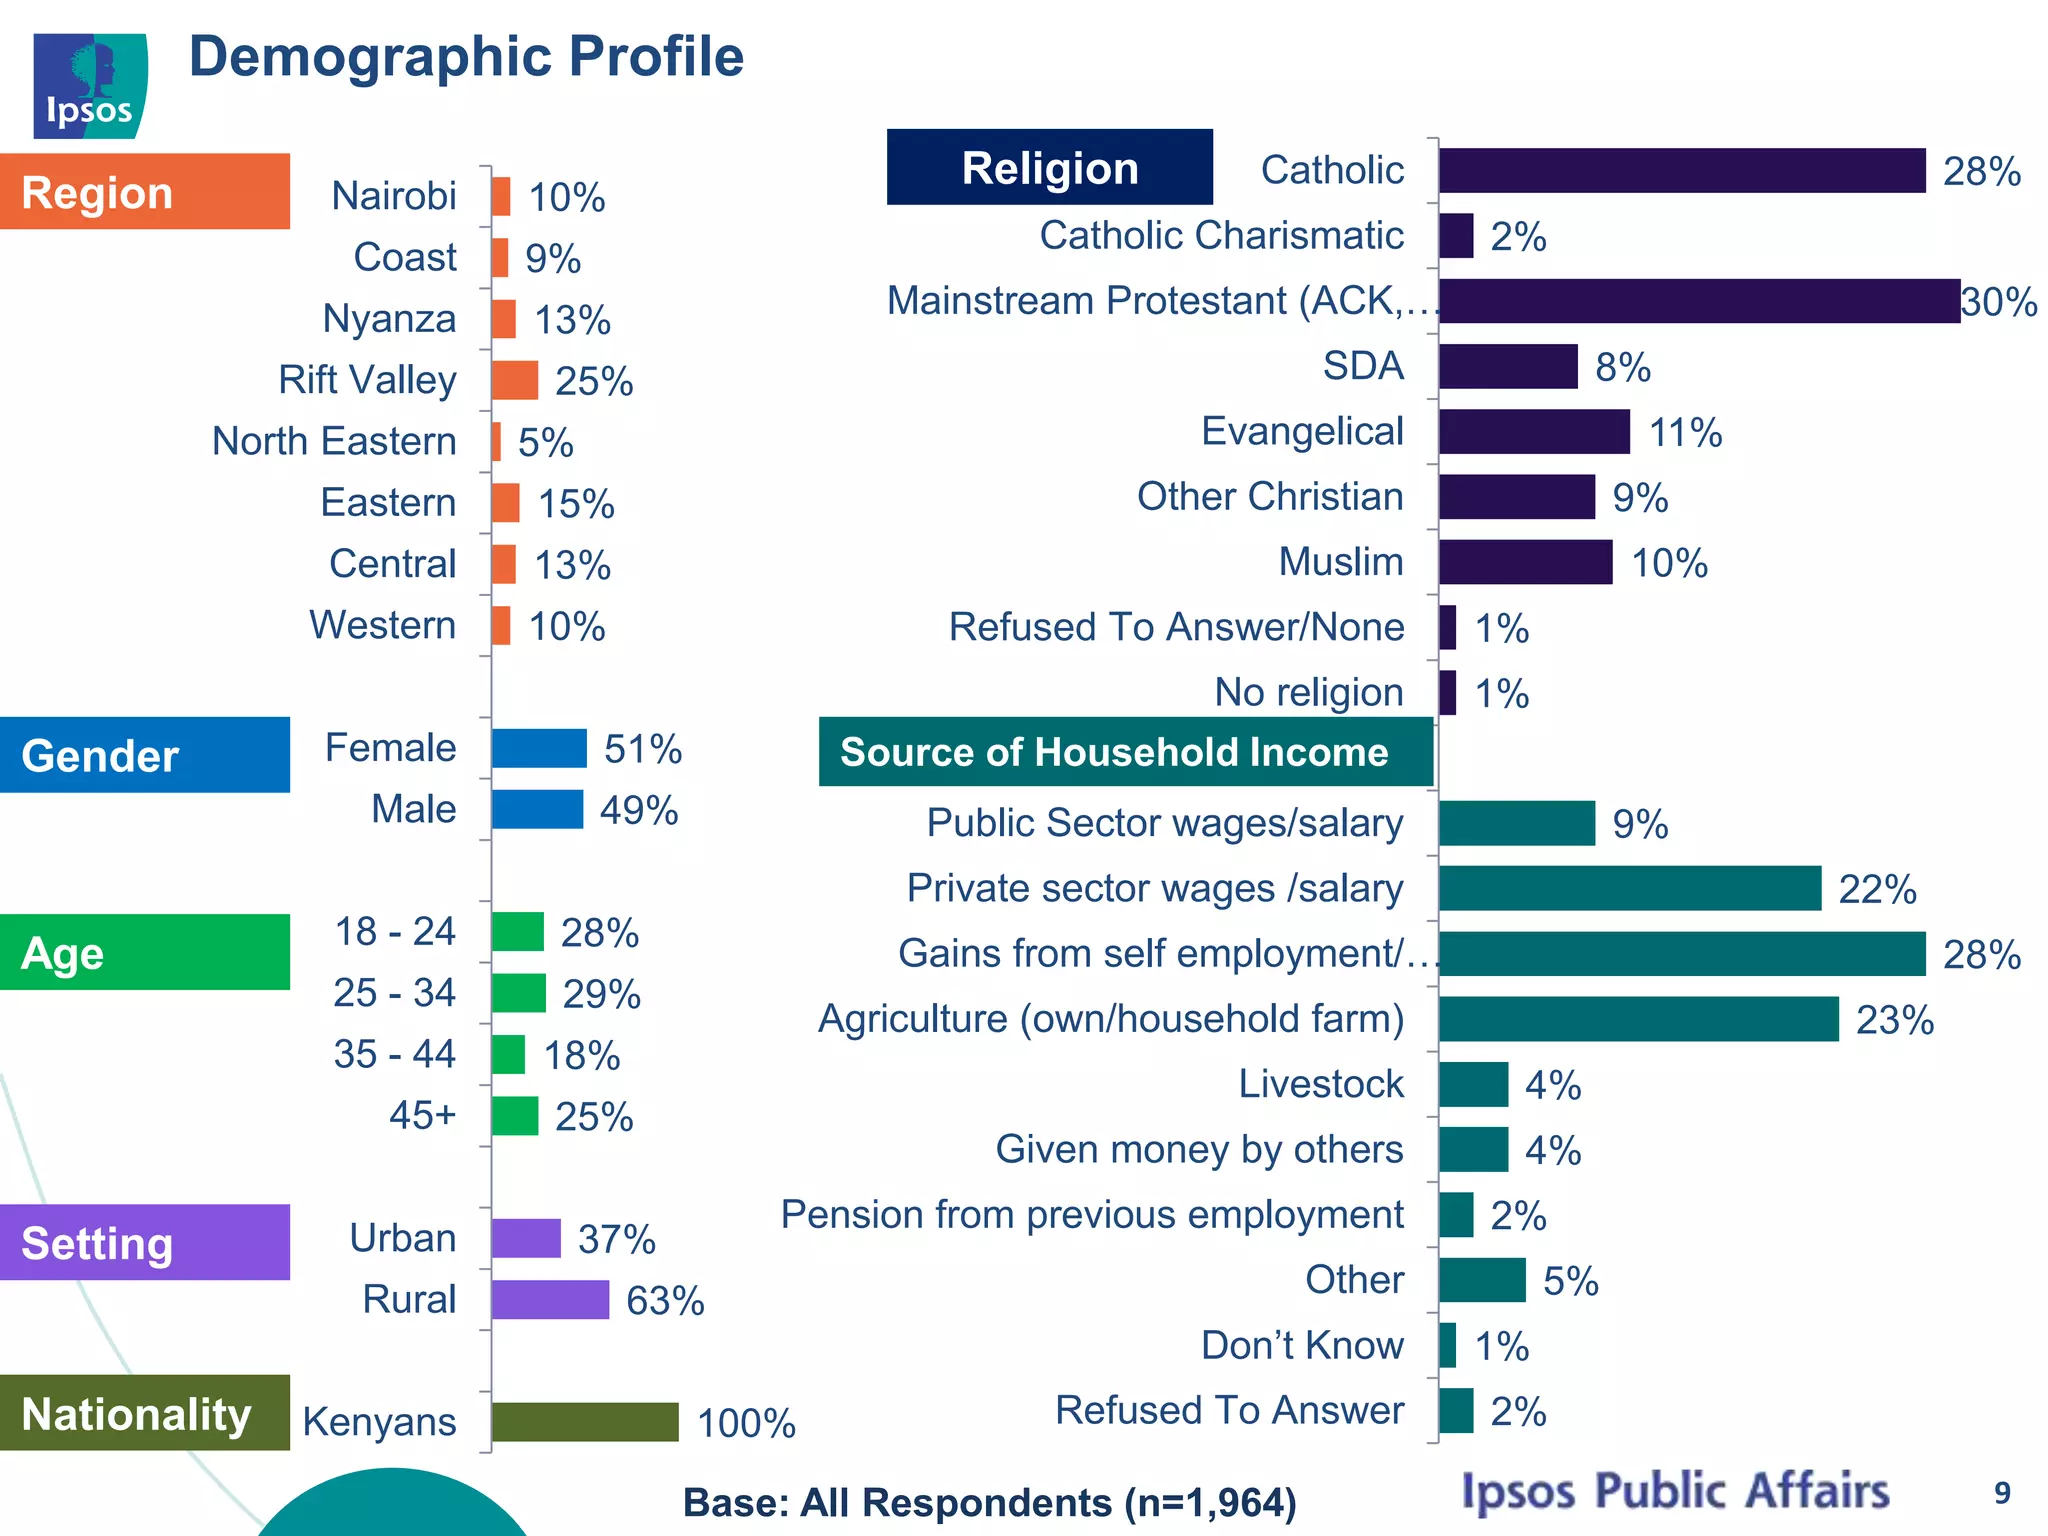
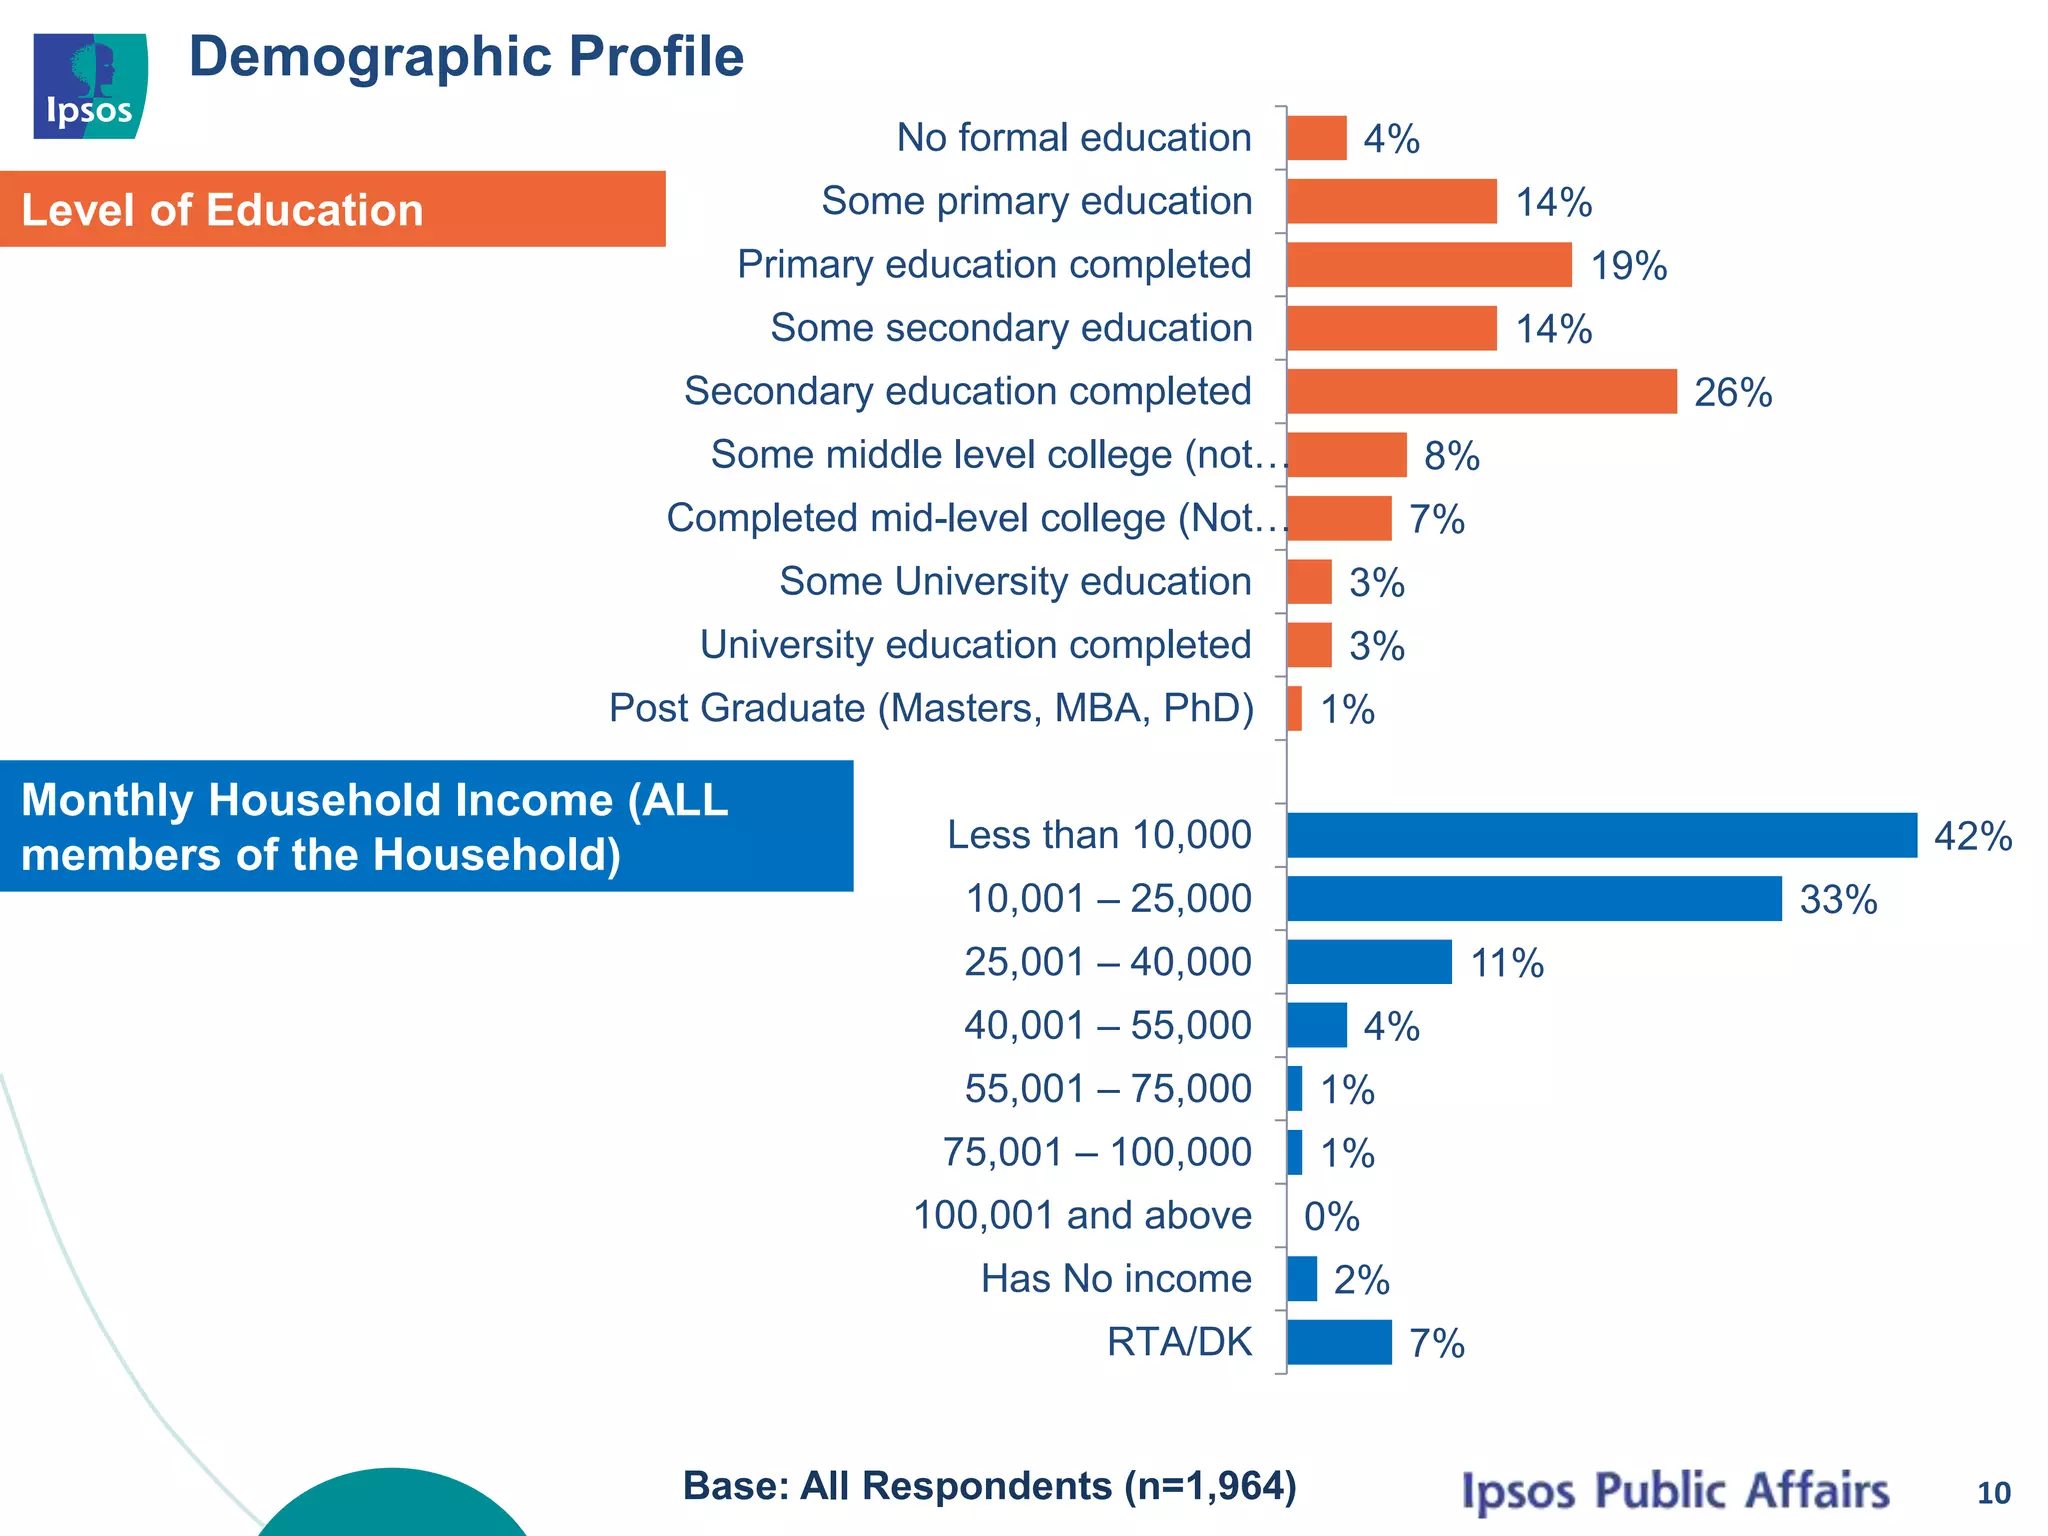
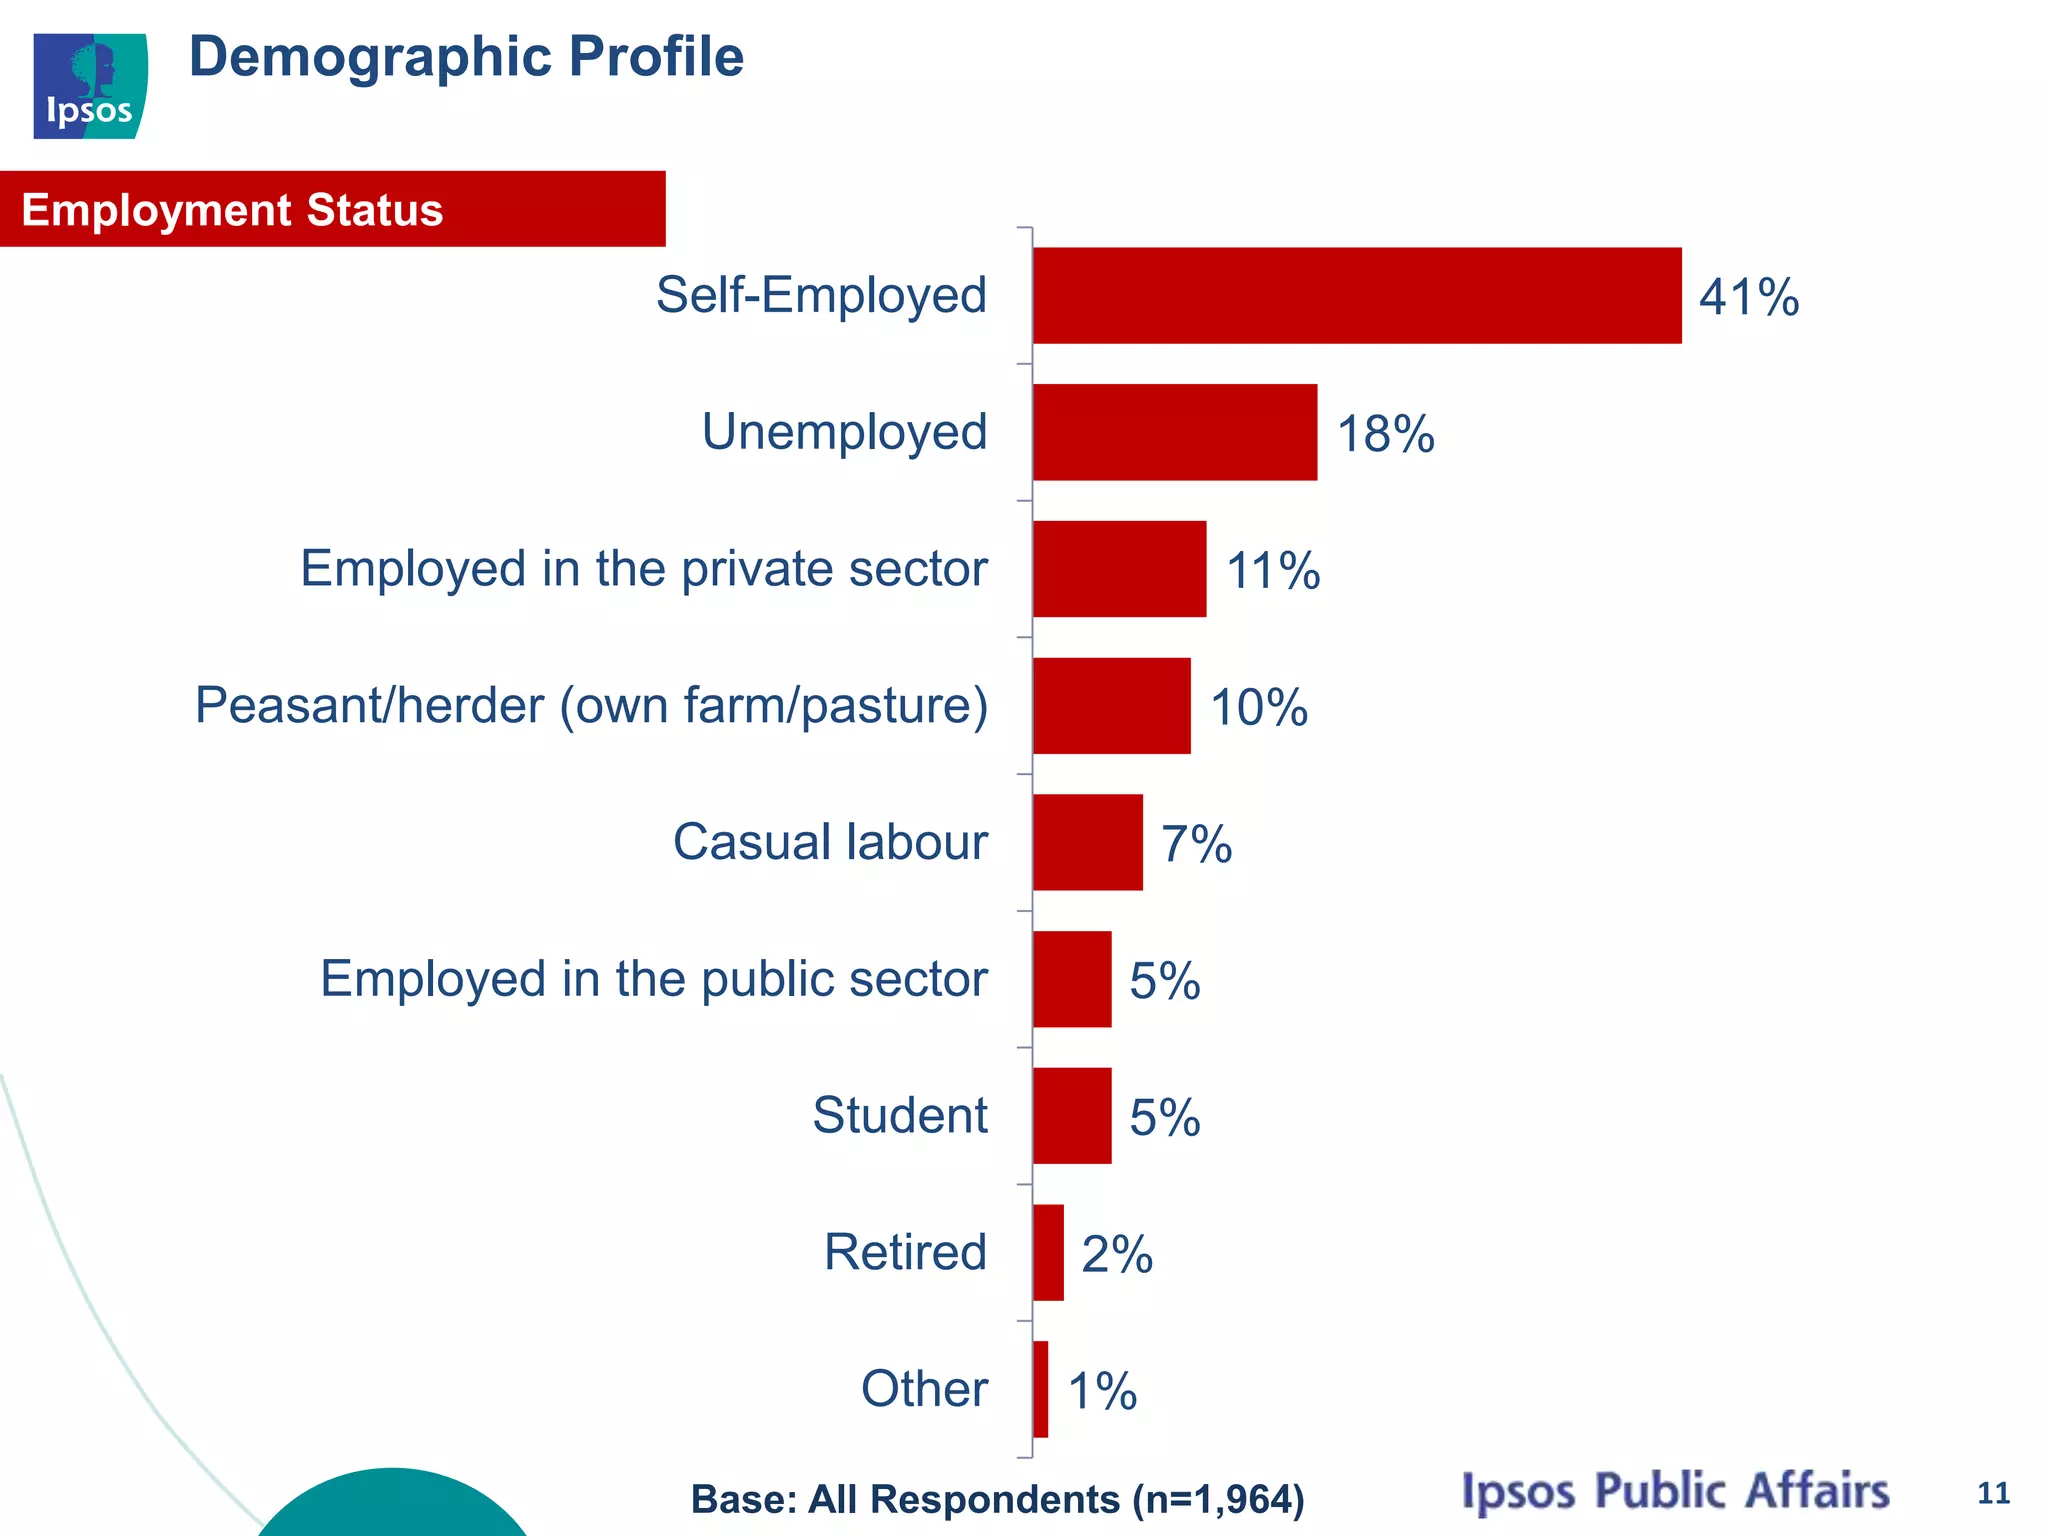
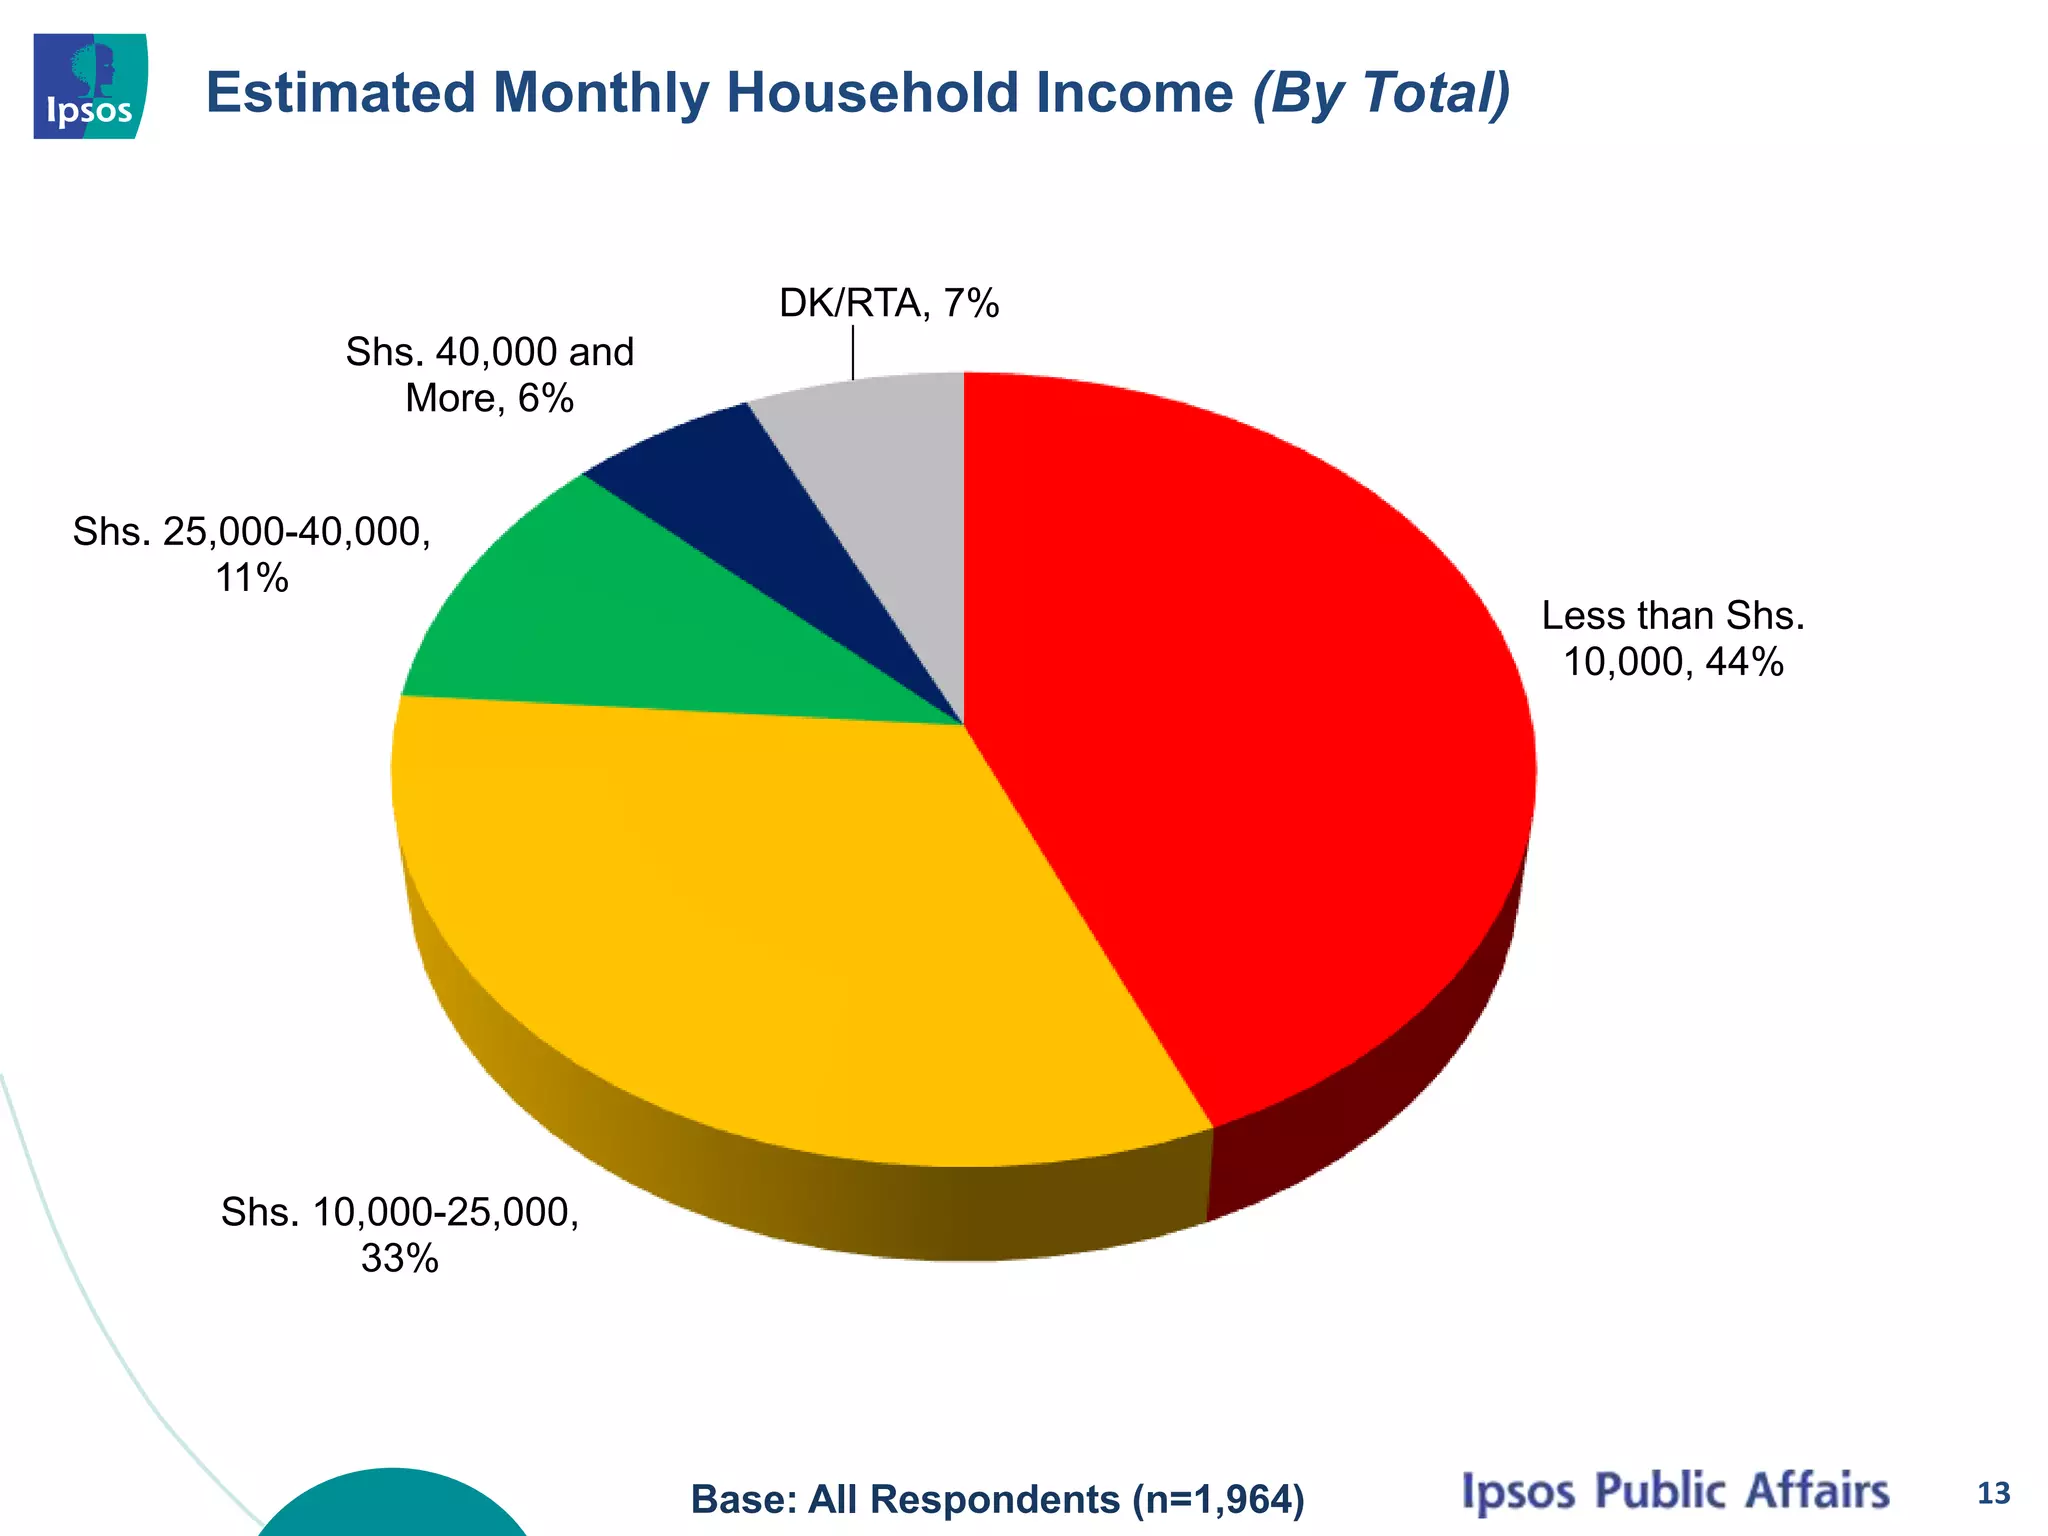
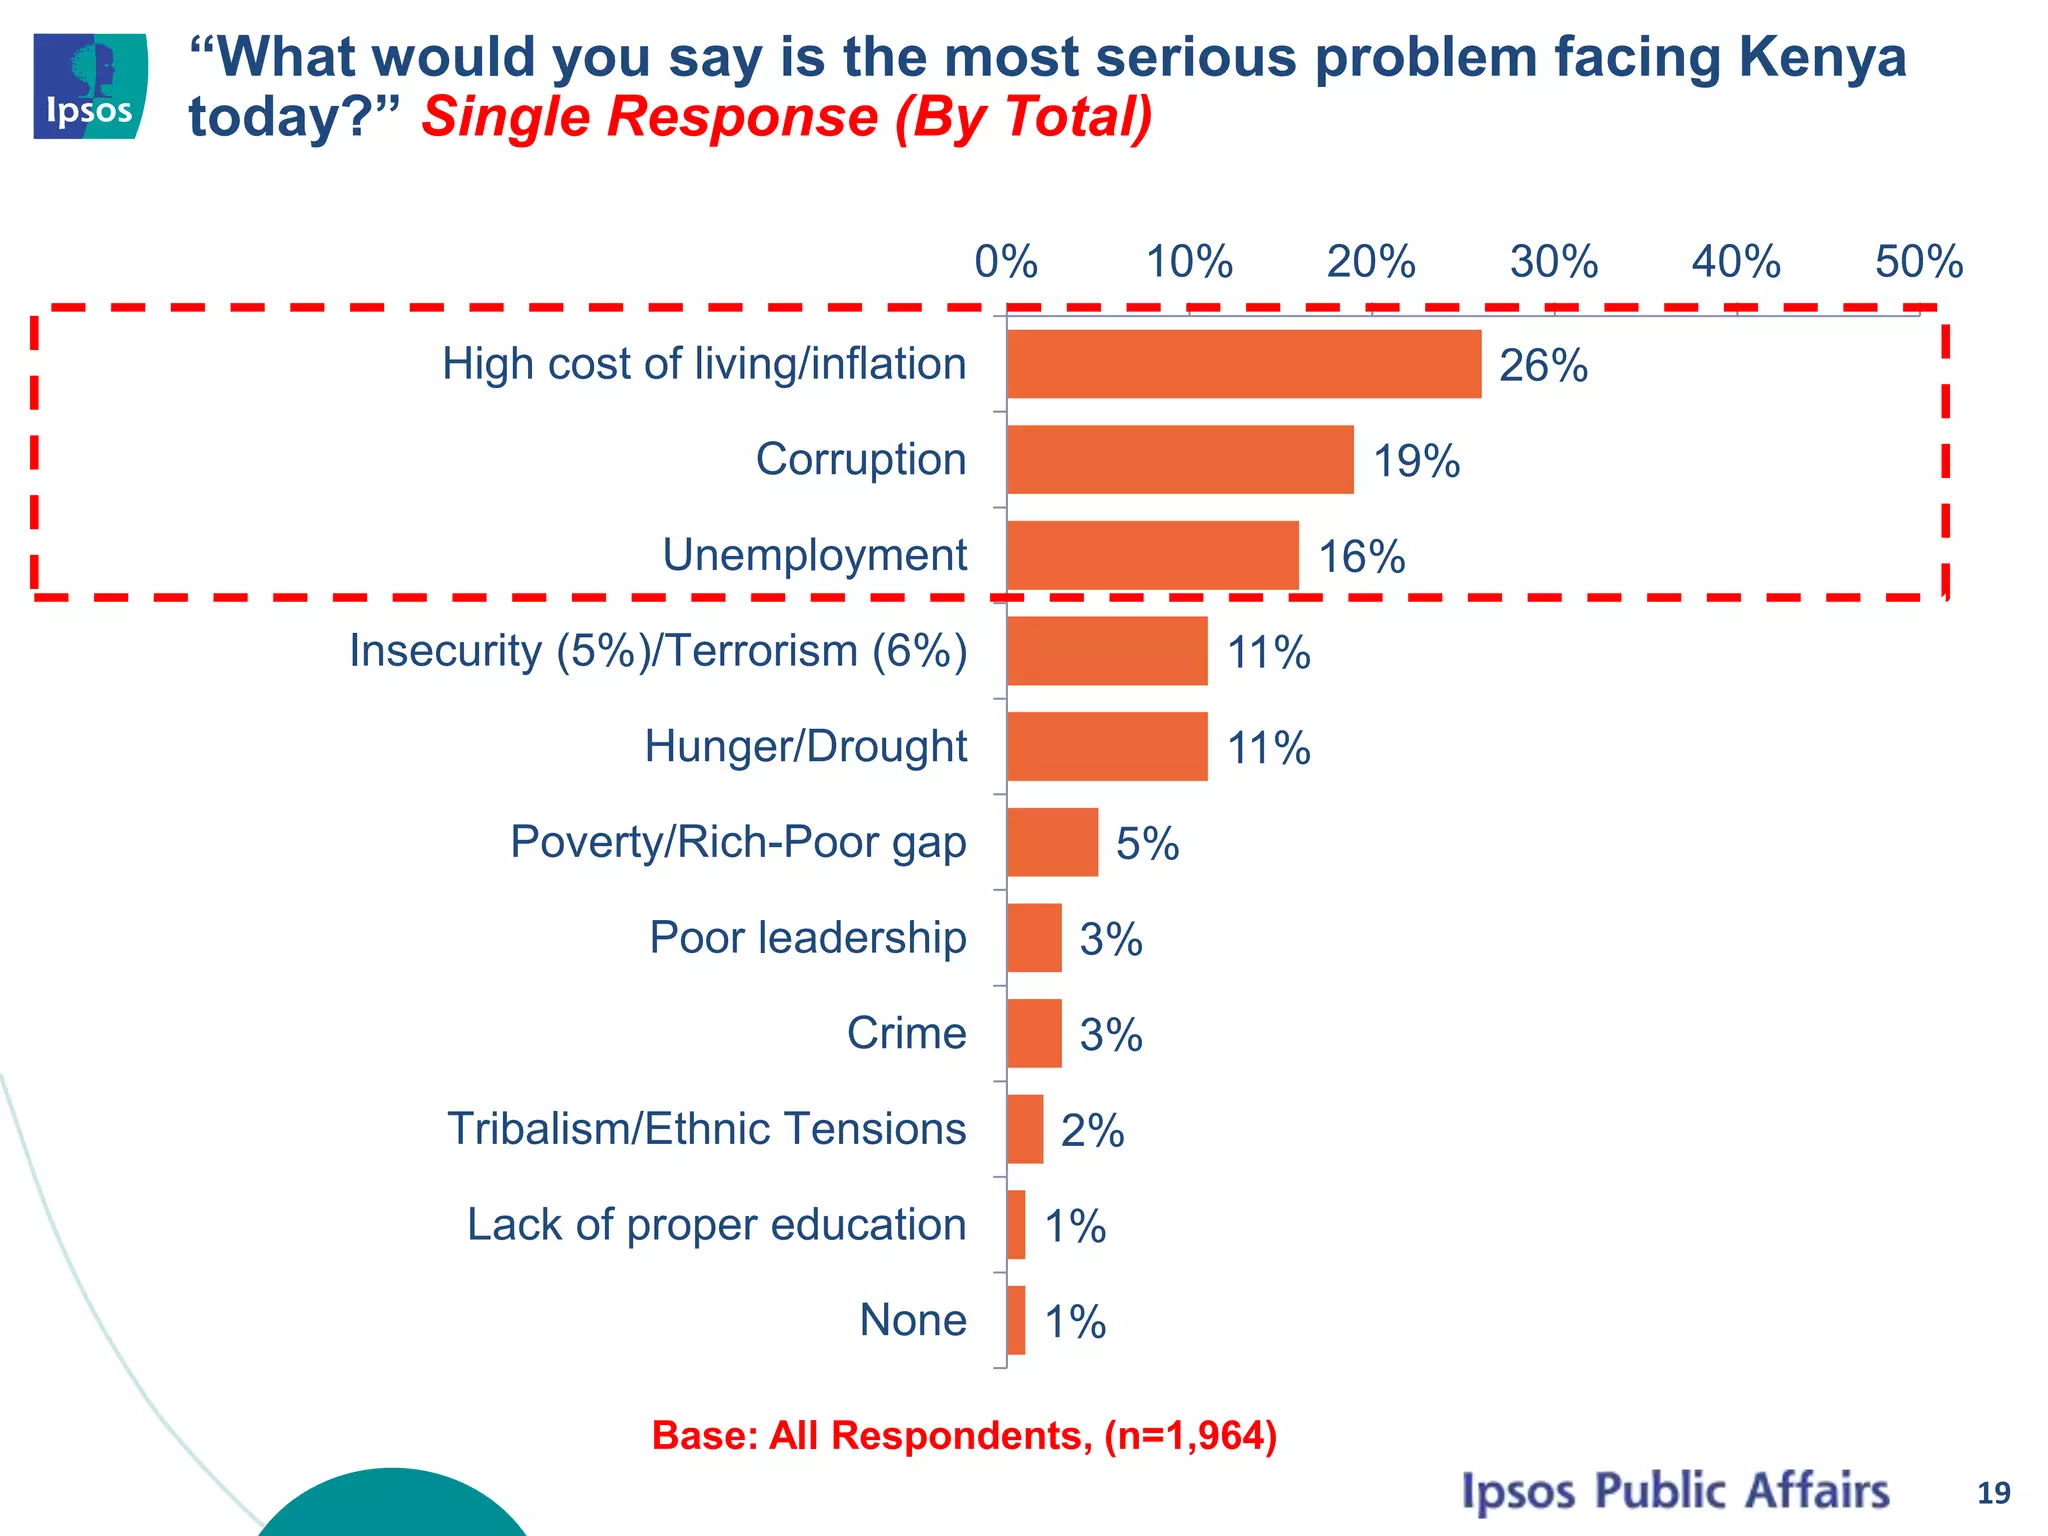
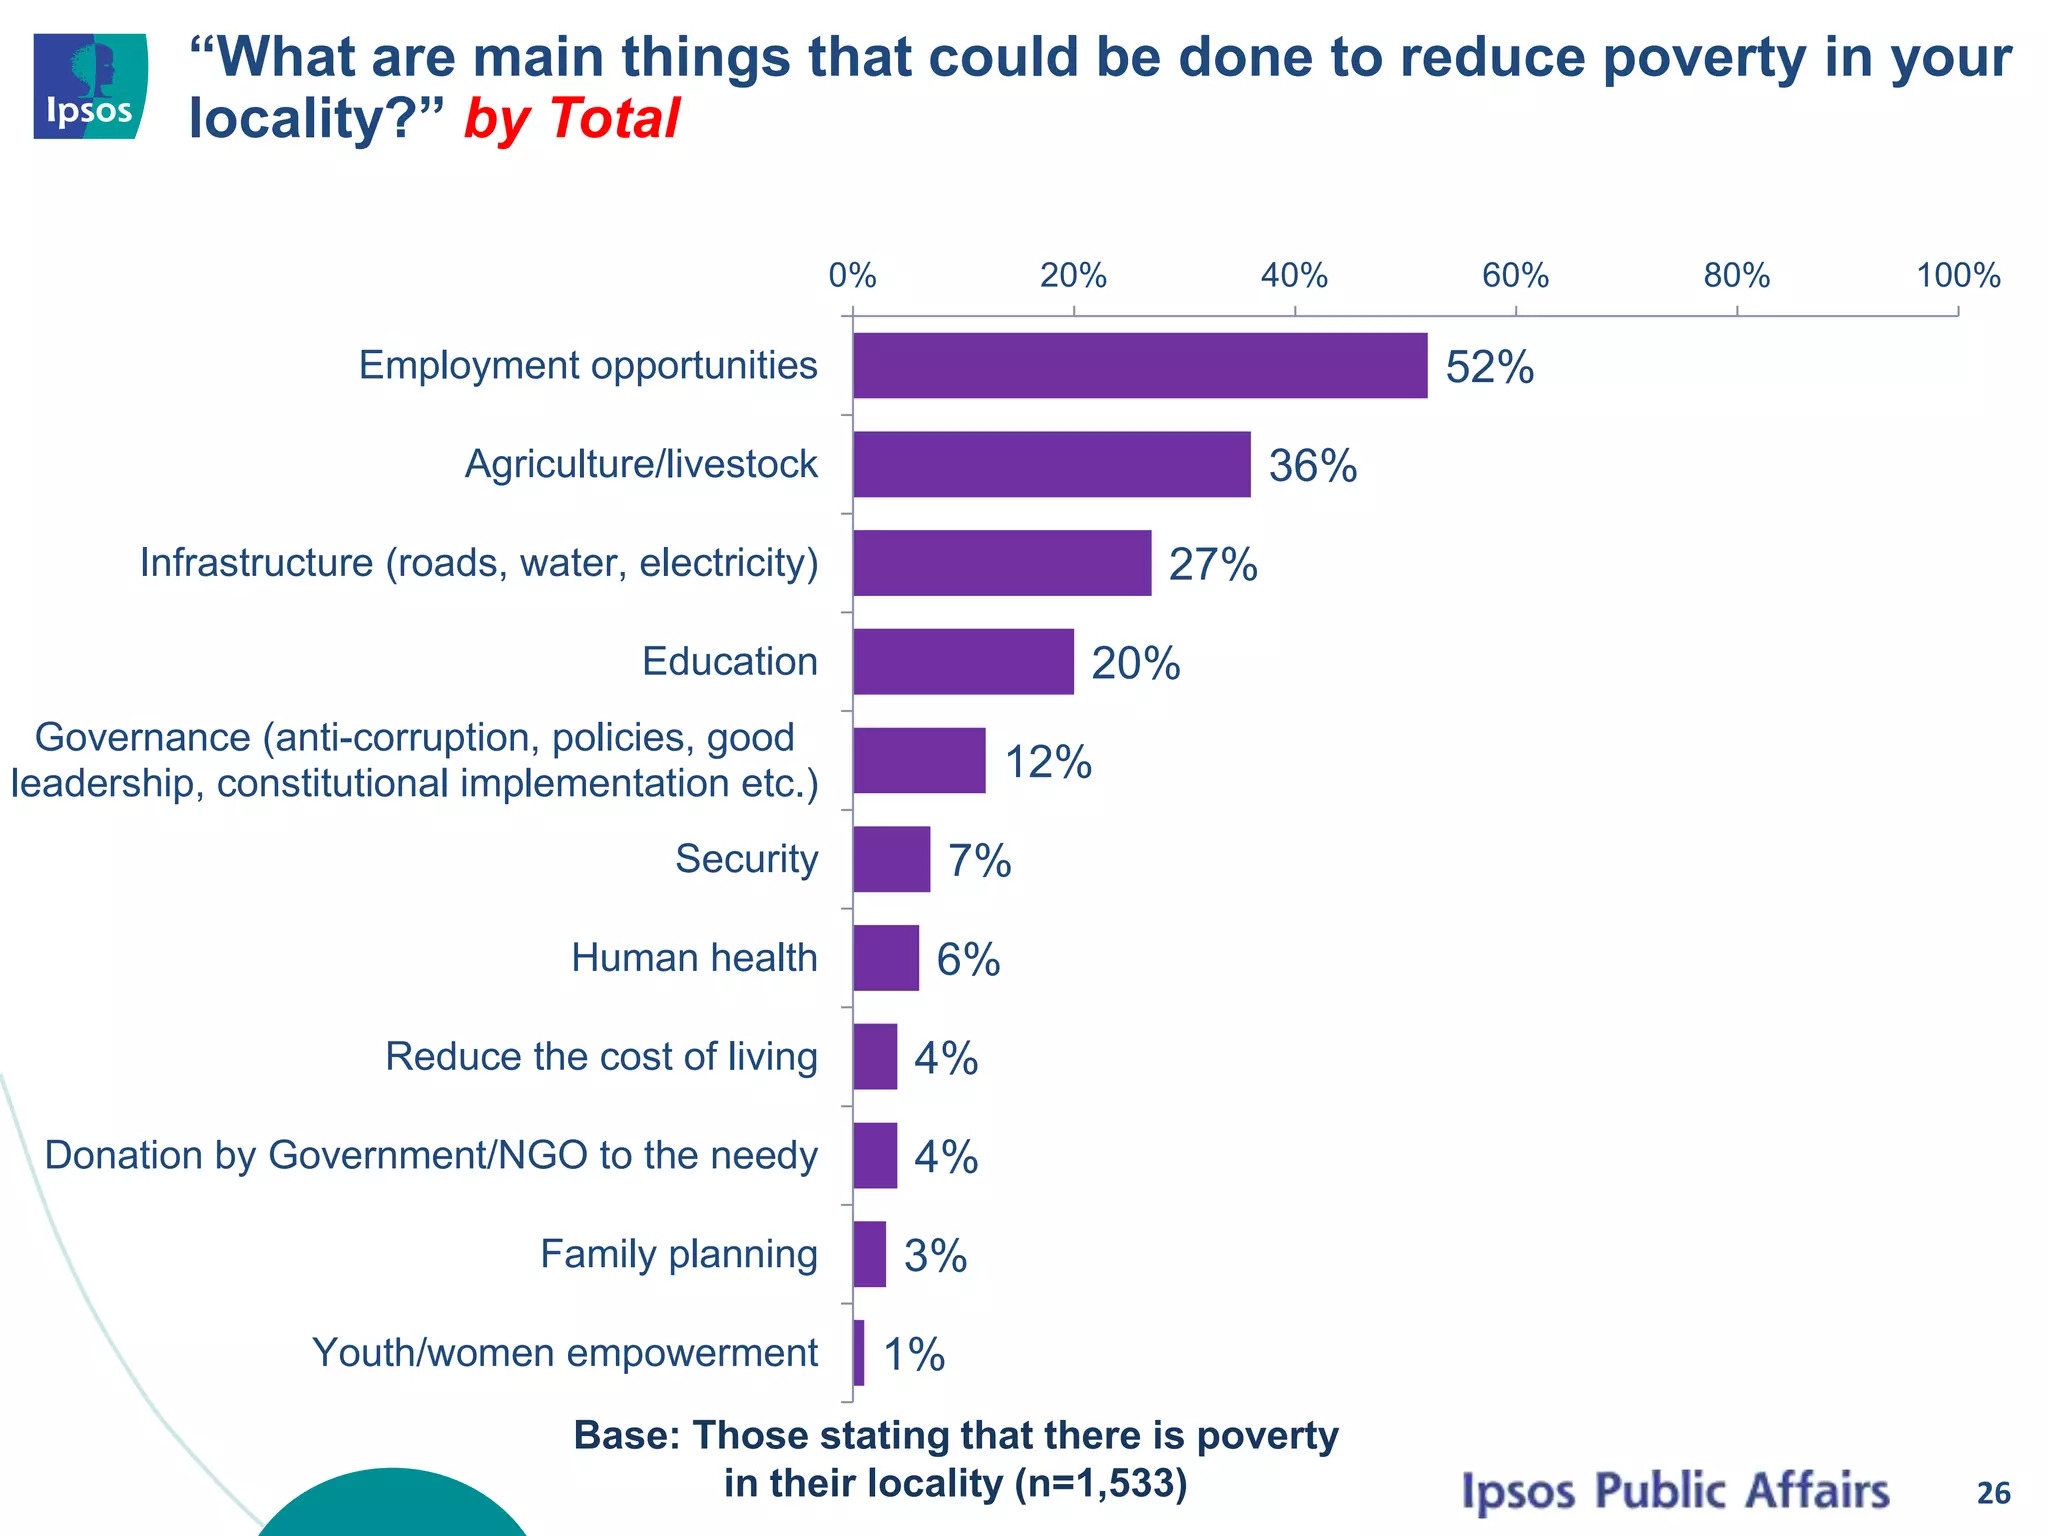
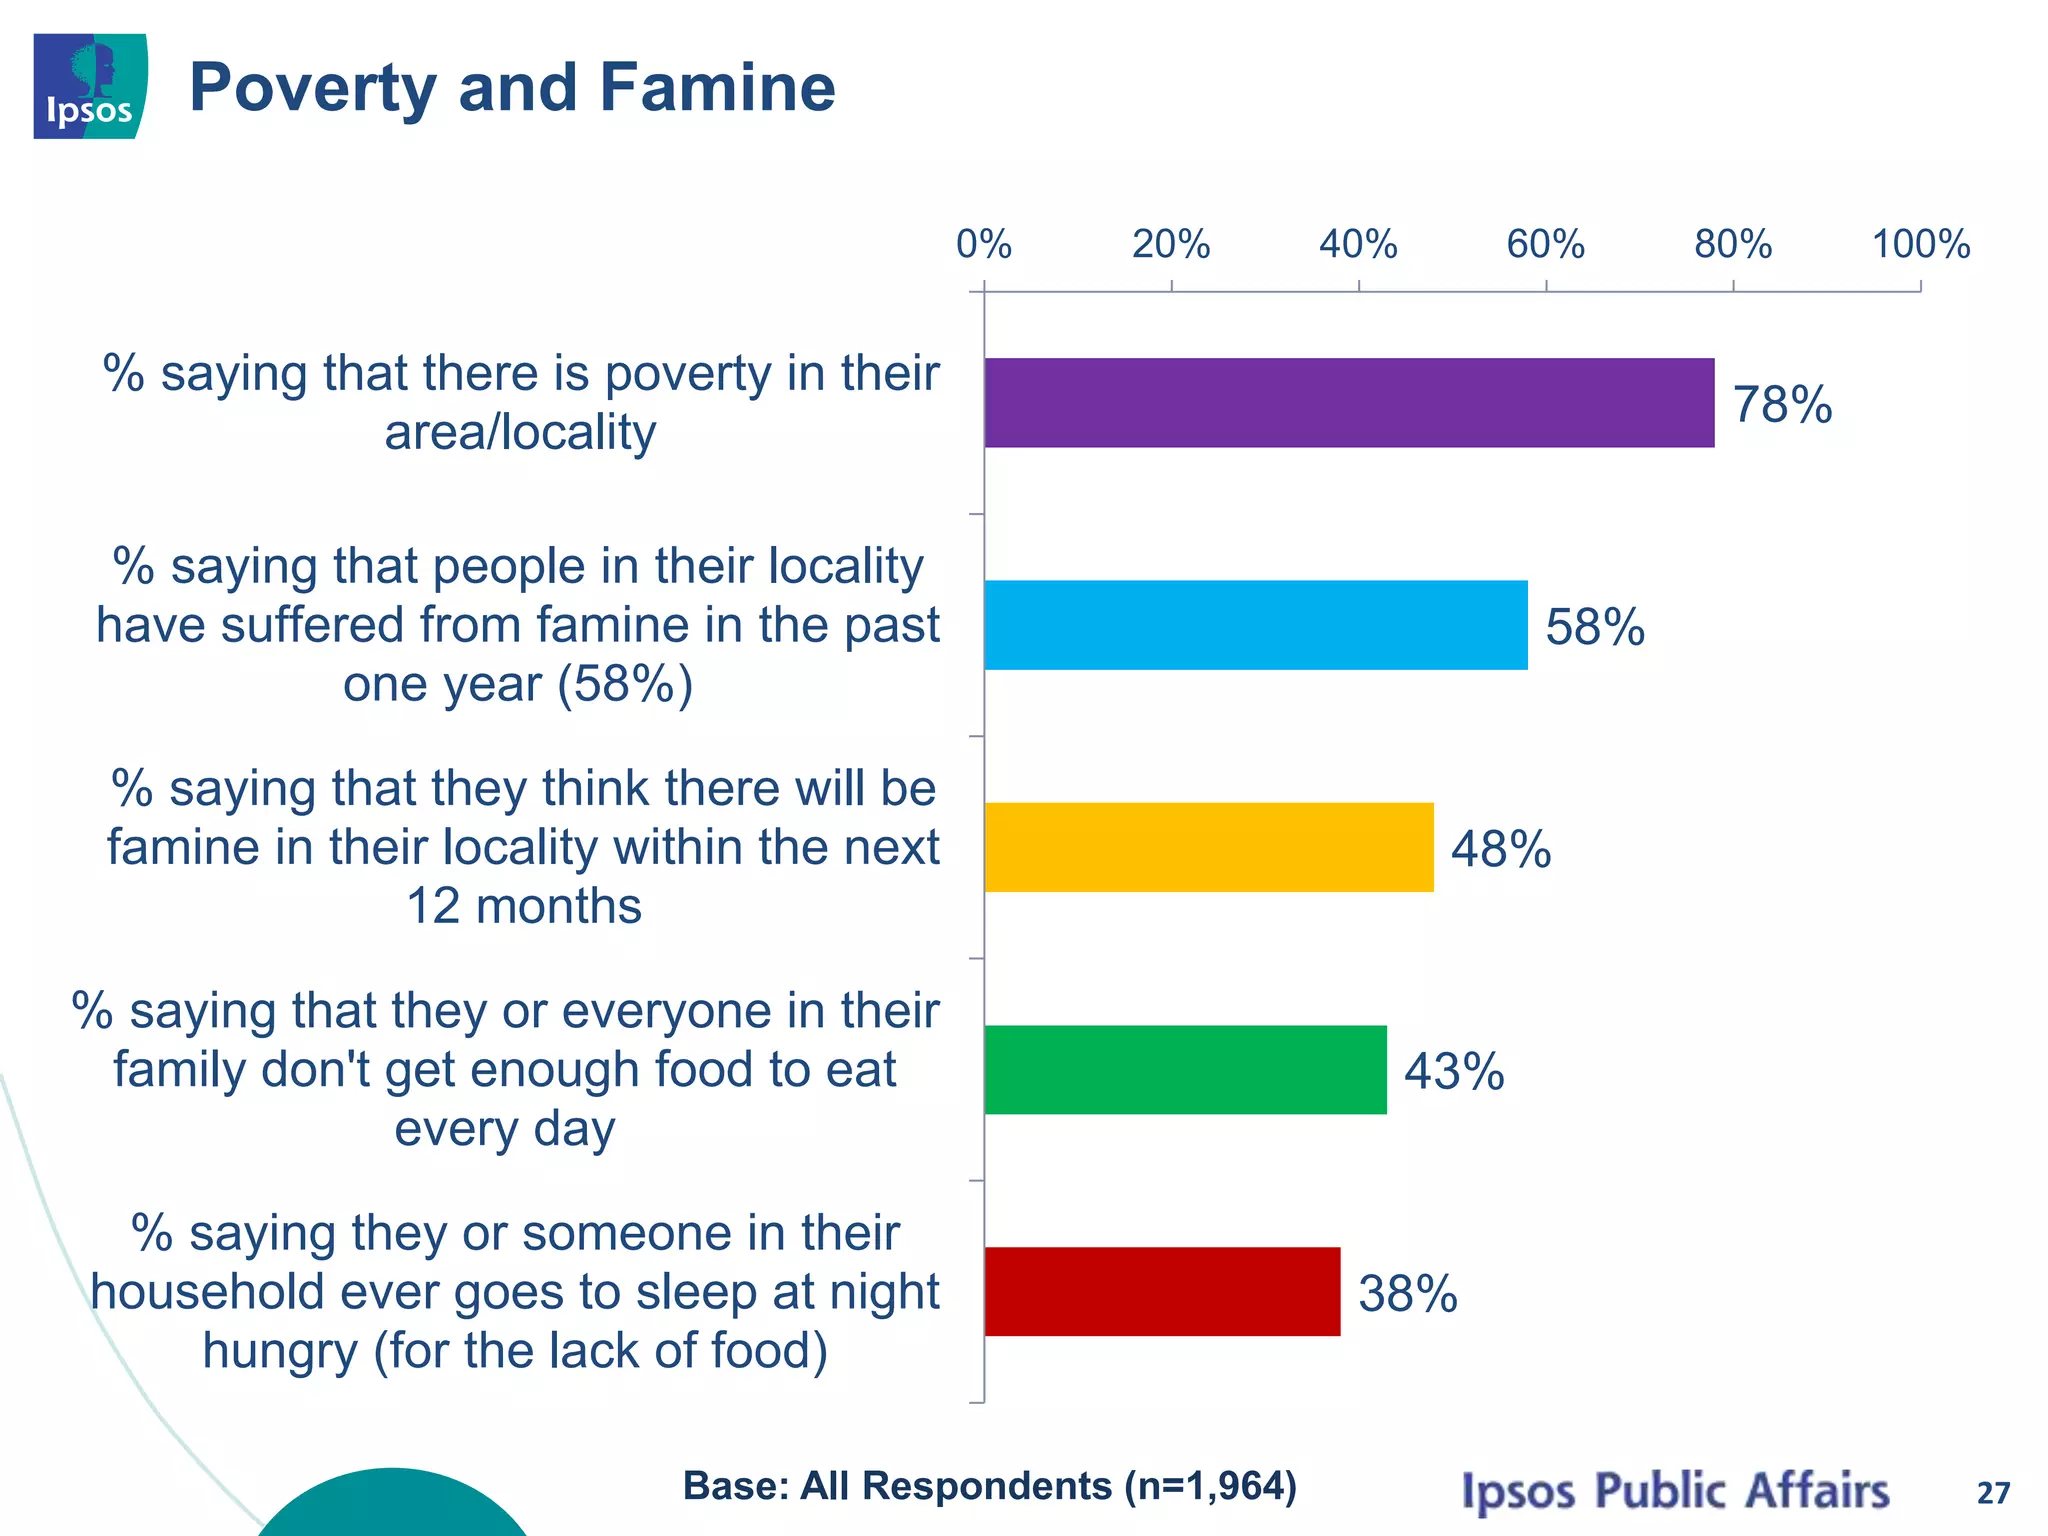
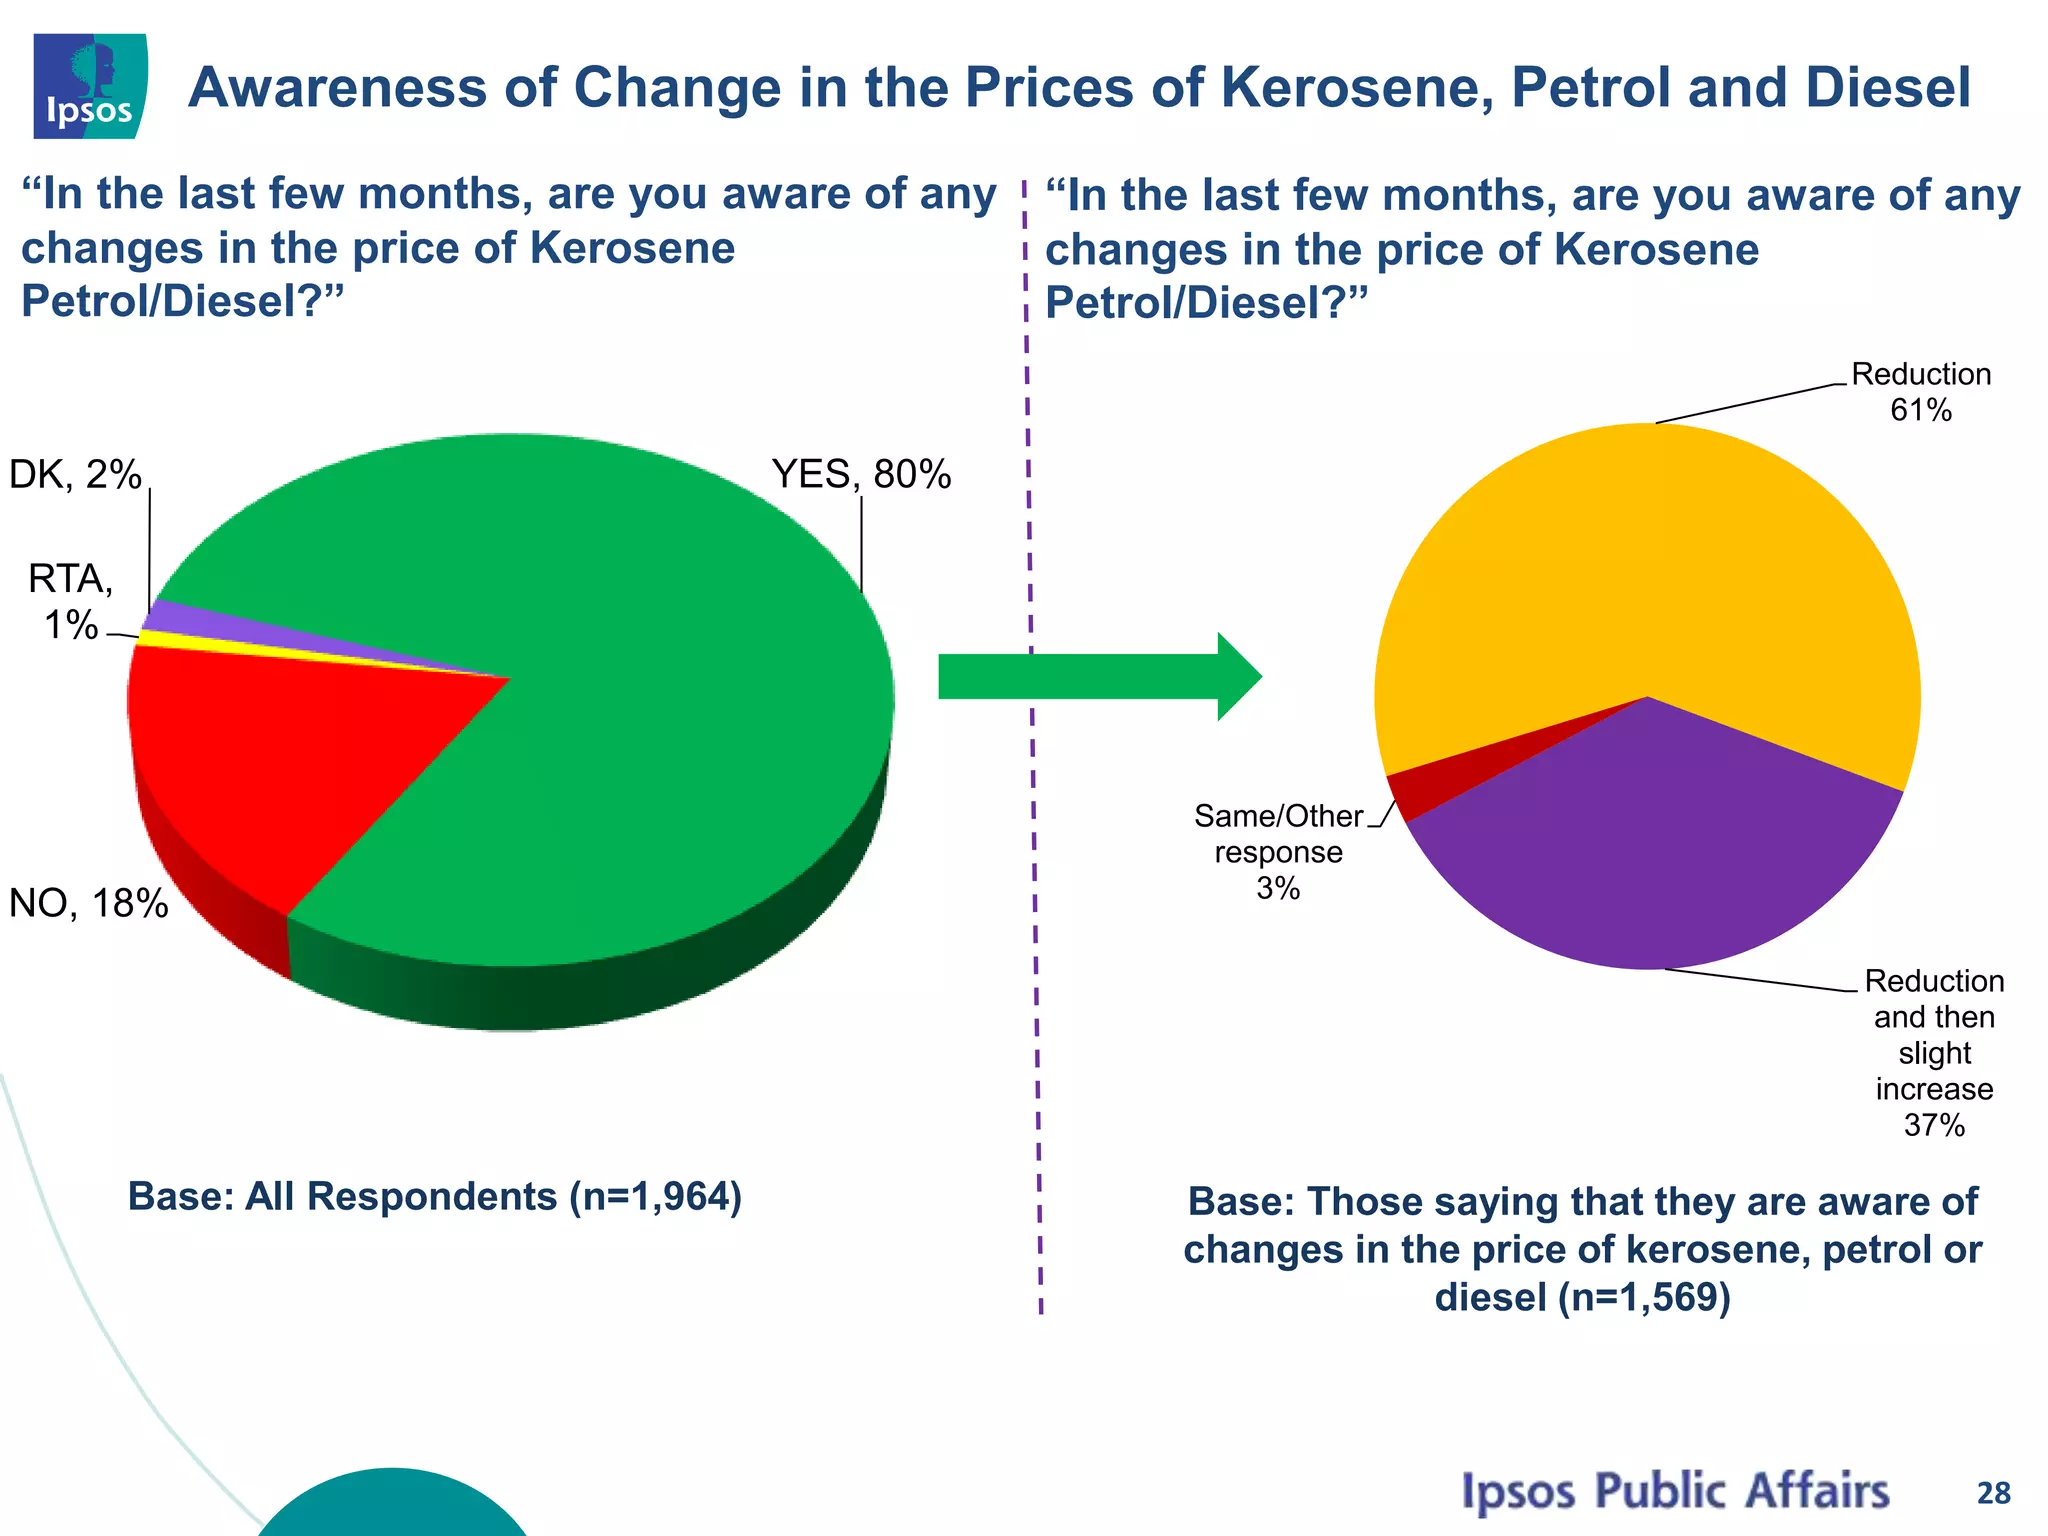
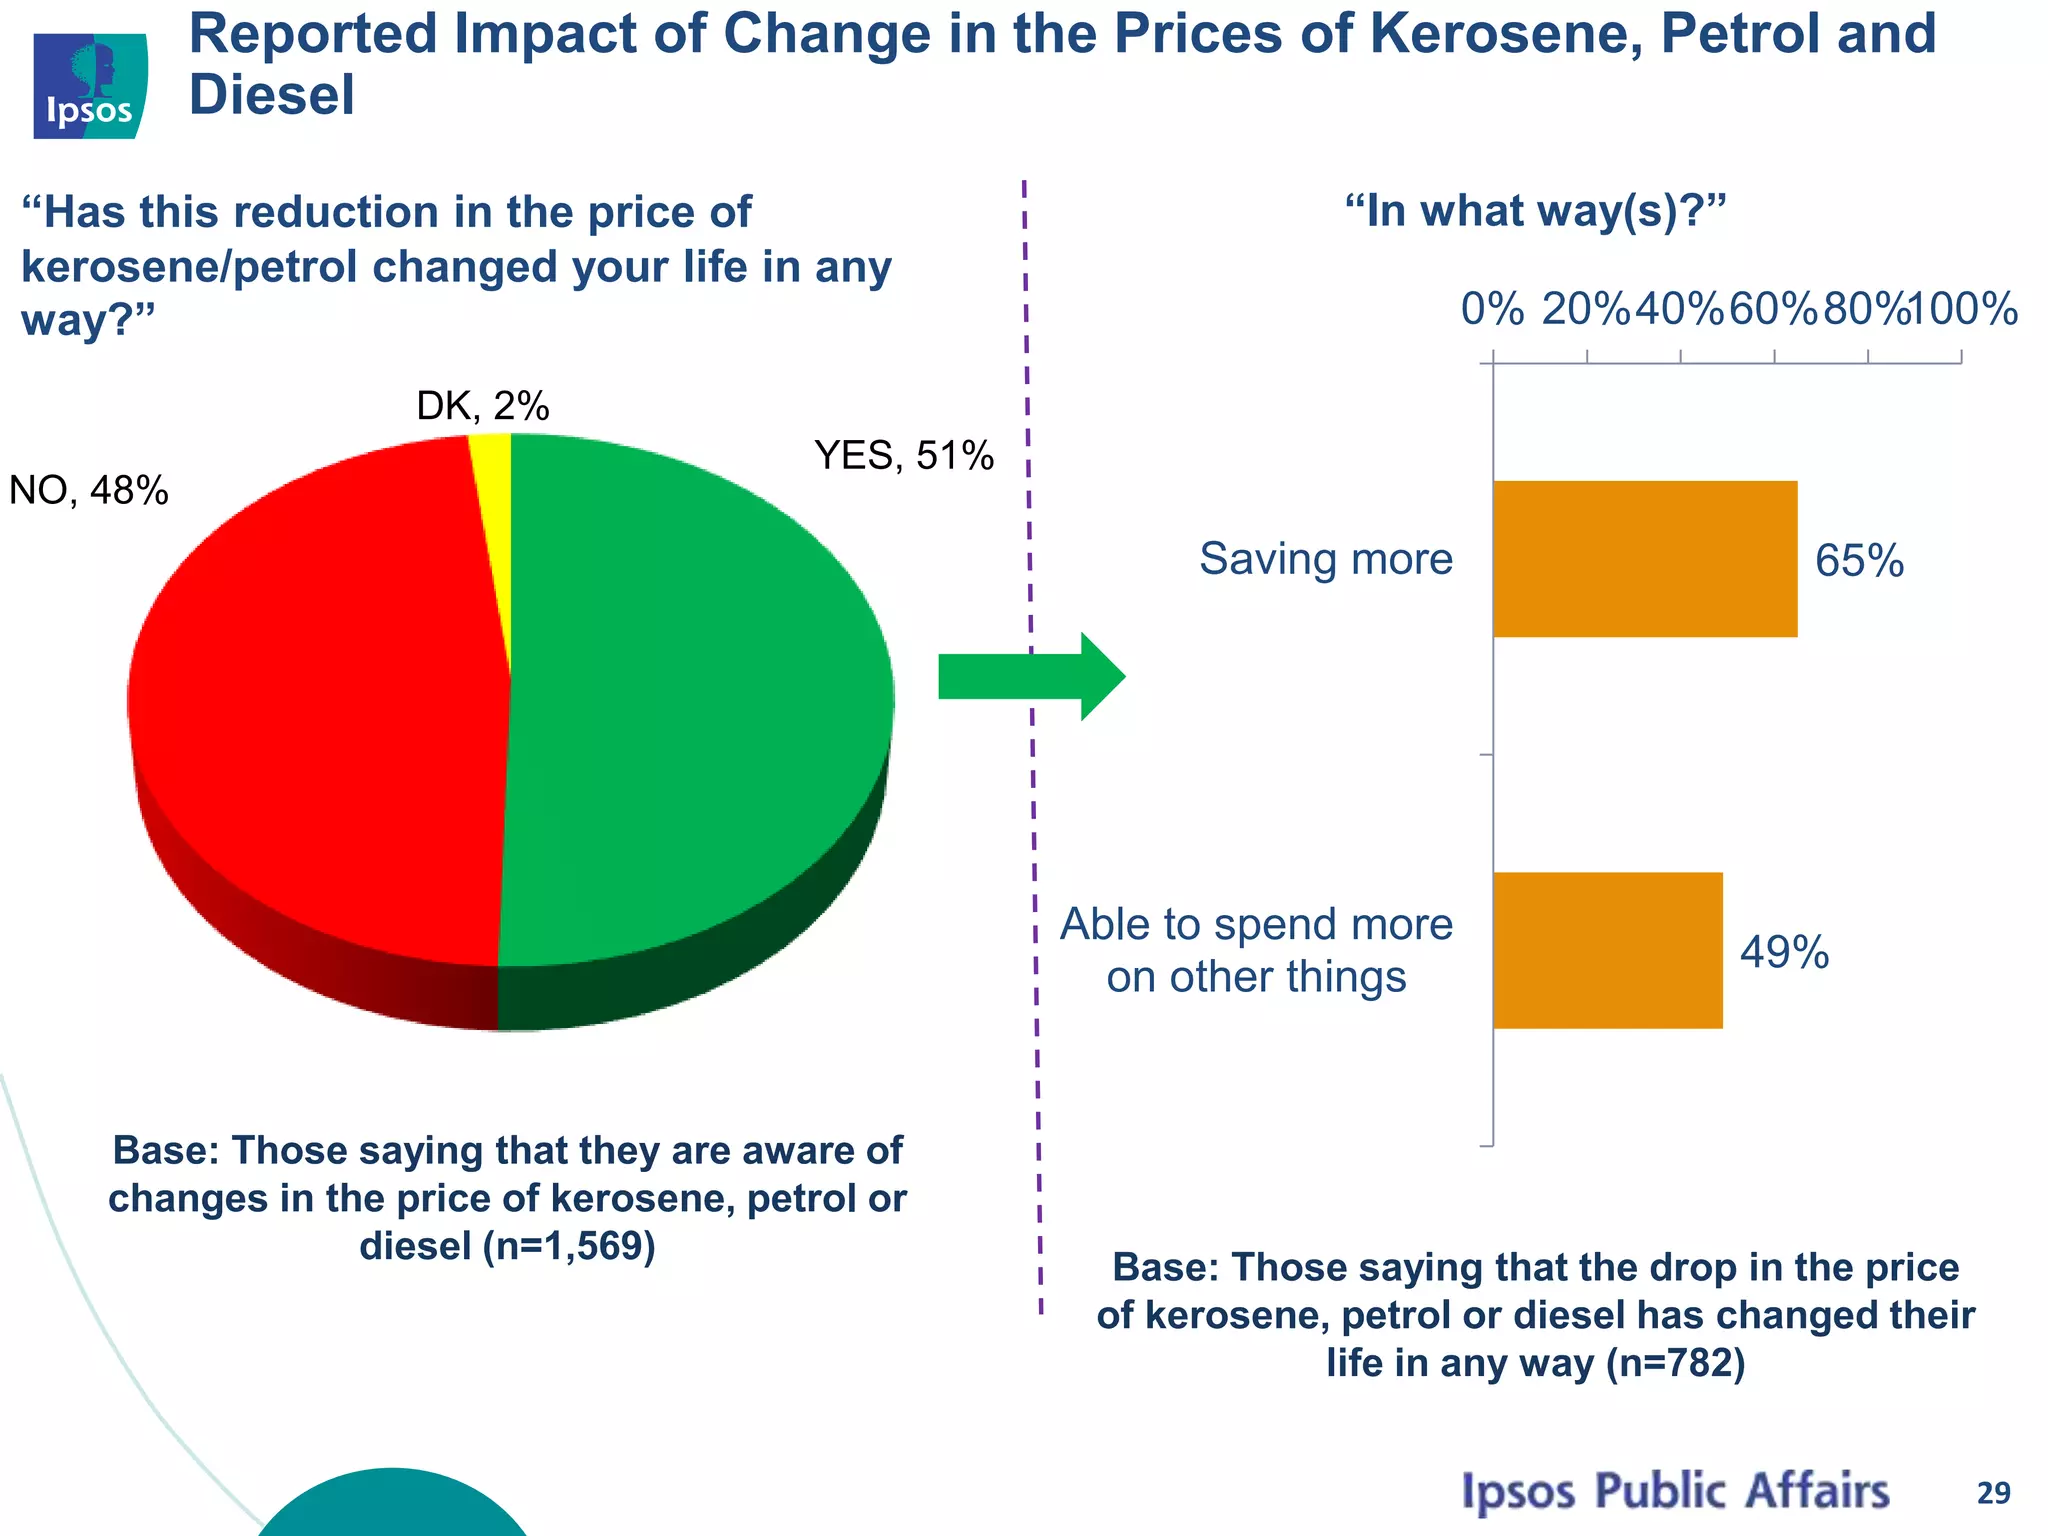


The document presents a press release by Ipsos detailing a poll regarding various social and economic issues in Kenya, conducted from March 28 to April 7, 2015, with a sample size of 1,964 respondents. Key findings include concerns about poverty, hunger, and the high cost of living, with significant proportions of the population reporting experiences of famine and economic hardships. The polling methodology and demographics of the respondents are also outlined, emphasizing the need for quality control in data collection.


![Sales_manager_resume[1]](https://cdn.slidesharecdn.com/ss_thumbnails/42d8bf33-a6e7-49e9-ae50-76acbb513cc0-150417112045-conversion-gate02-thumbnail.jpg?width=640&height=640&fit=bounds)


