Downloaded 36 times
![Existing Fraud detection methods Insurance fraud The hot spot methodology applies a three step process: the k-means for cluster detection, the C4.5 for decision tree rule induction, and domain knowledge , statistical summaries and visualization tools for rule evaluation. [Williams G, Hung Z,1997] Expanded the hot spot architecture to use genetic algorithm to generate rules and to allow the domain user. [Williams G, 1999] Credit Card Fraud The Bayesian Belief Network (BBN) and Artificial Neural Network (ANN) comparison the STAGE algorithm for BBN and BP algorithm for ANN in fraud detection. [Maes S, Tuyls K, Vanschoenwinkel B, Manderick B, 2002]](https://image.slidesharecdn.com/minority-report-in-fraud-detection-classification-of-skewed-data-1225805827873748-9/75/11-04-Regular-Meeting-Monority-Report-in-Fraud-Detection-Classification-of-Skewed-Data-7-2048.jpg)
![Existing Fraud detection methods Telecommunications Fraud The advanced security for personal communications technologies (ASPECT) research group focuses on neural networks to train legal current user profiles that store recent user information and user profile histories that store long term information to define normal patterns of use. [Weatherford M, 2002]](https://image.slidesharecdn.com/minority-report-in-fraud-detection-classification-of-skewed-data-1225805827873748-9/75/11-04-Regular-Meeting-Monority-Report-in-Fraud-Detection-Classification-of-Skewed-Data-8-2048.jpg)
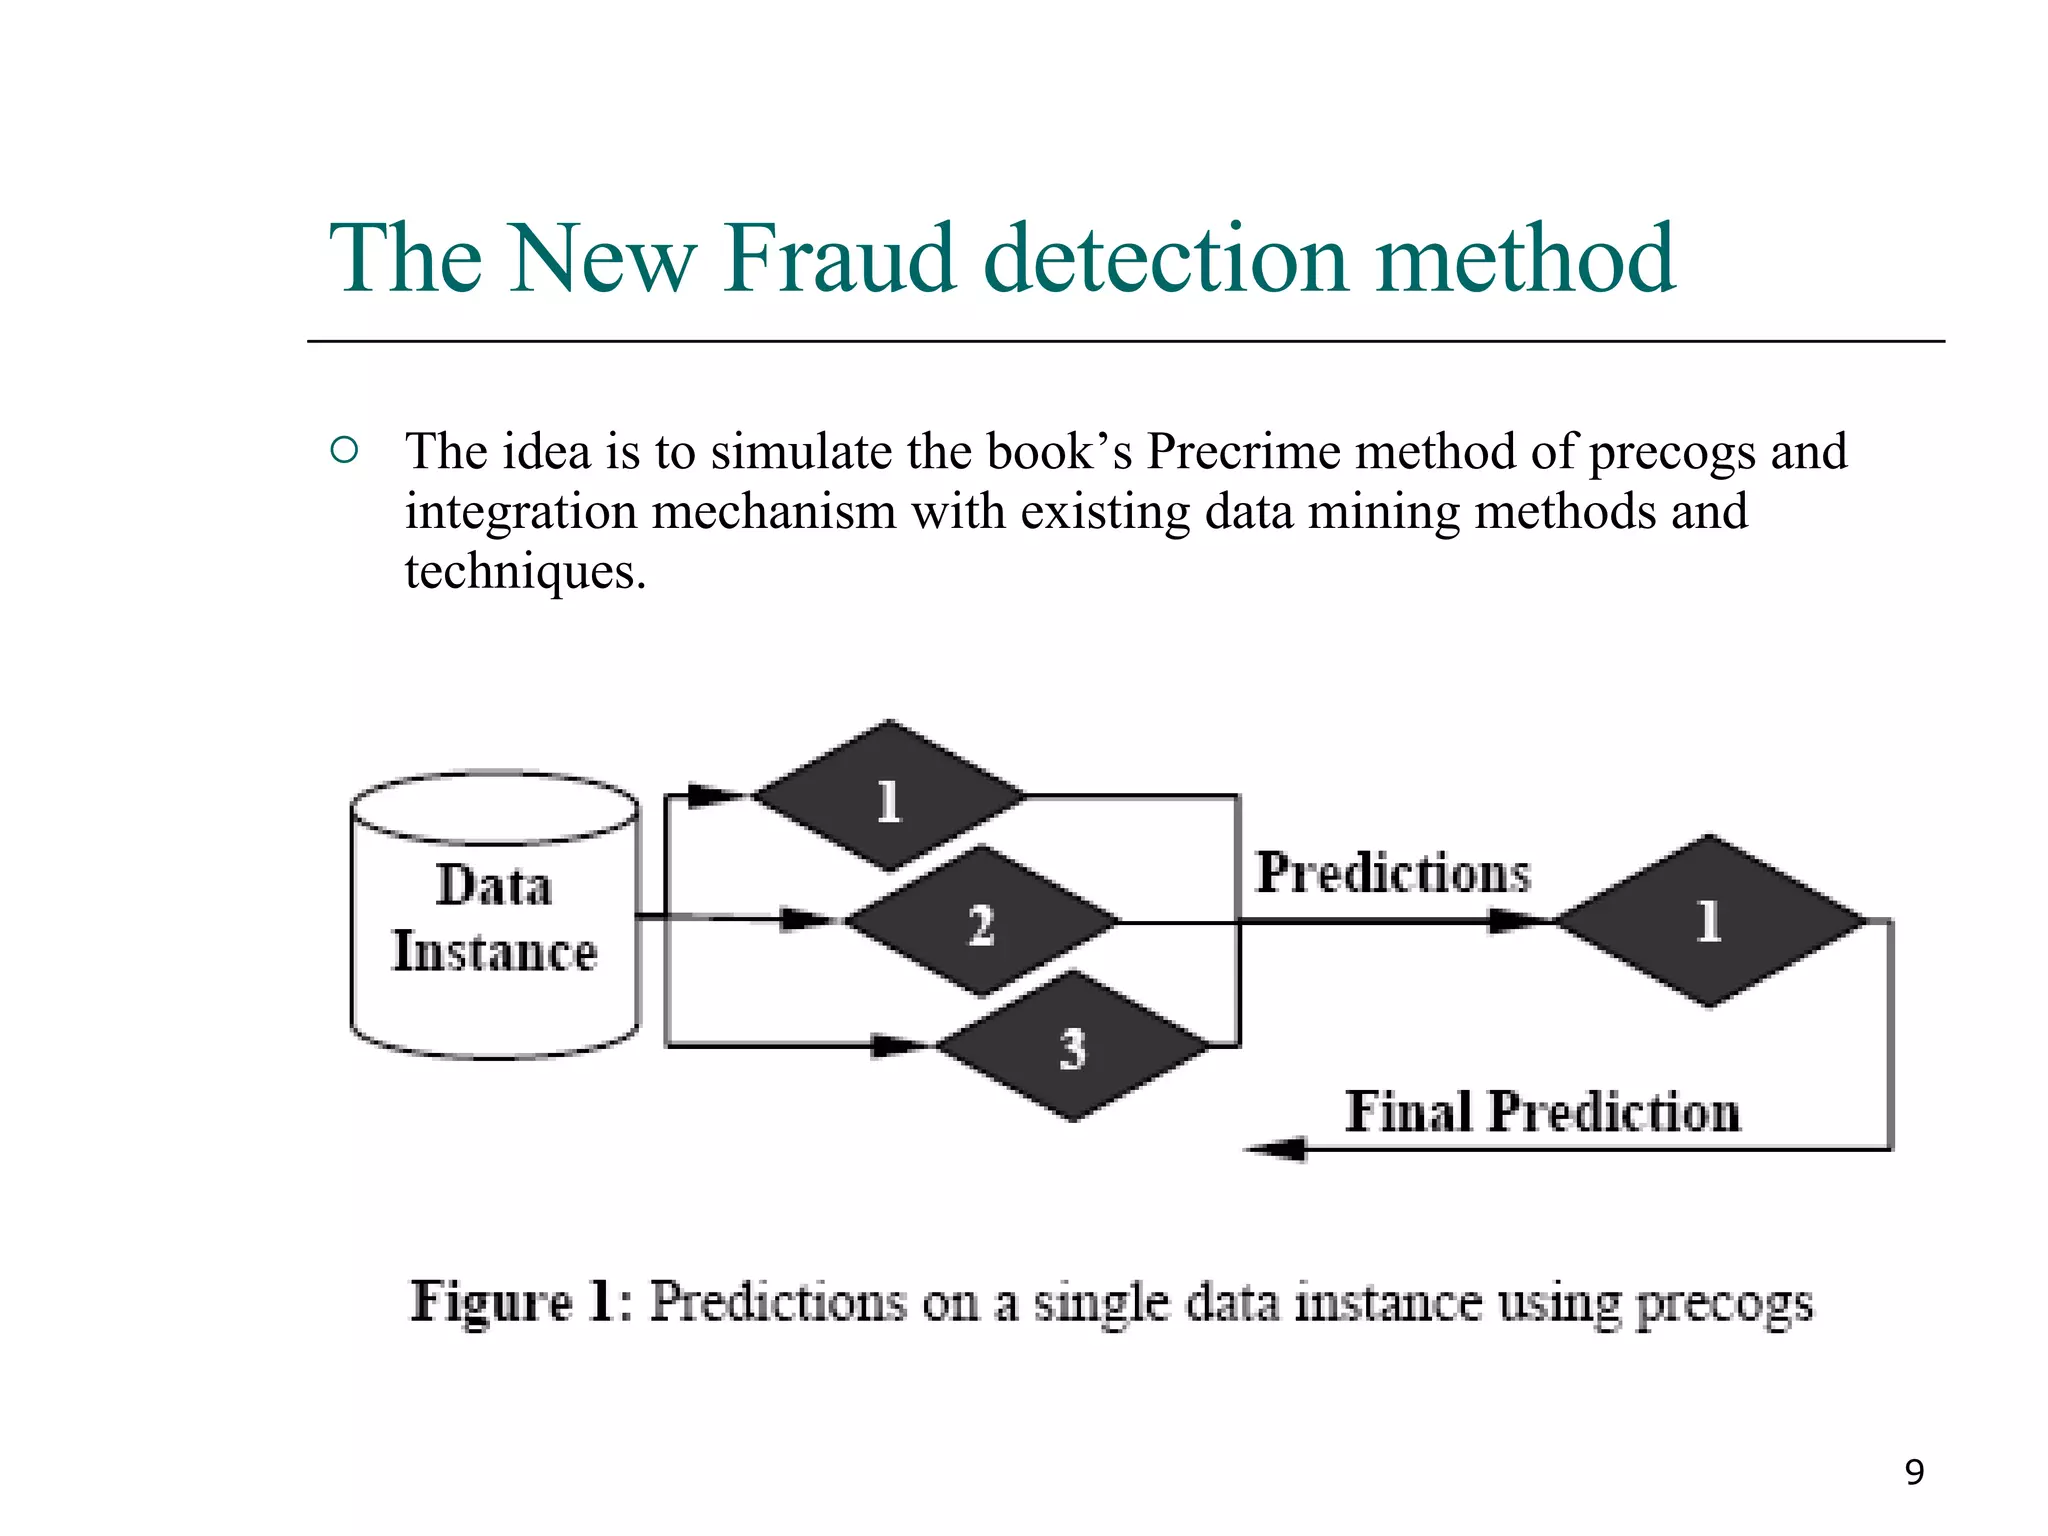
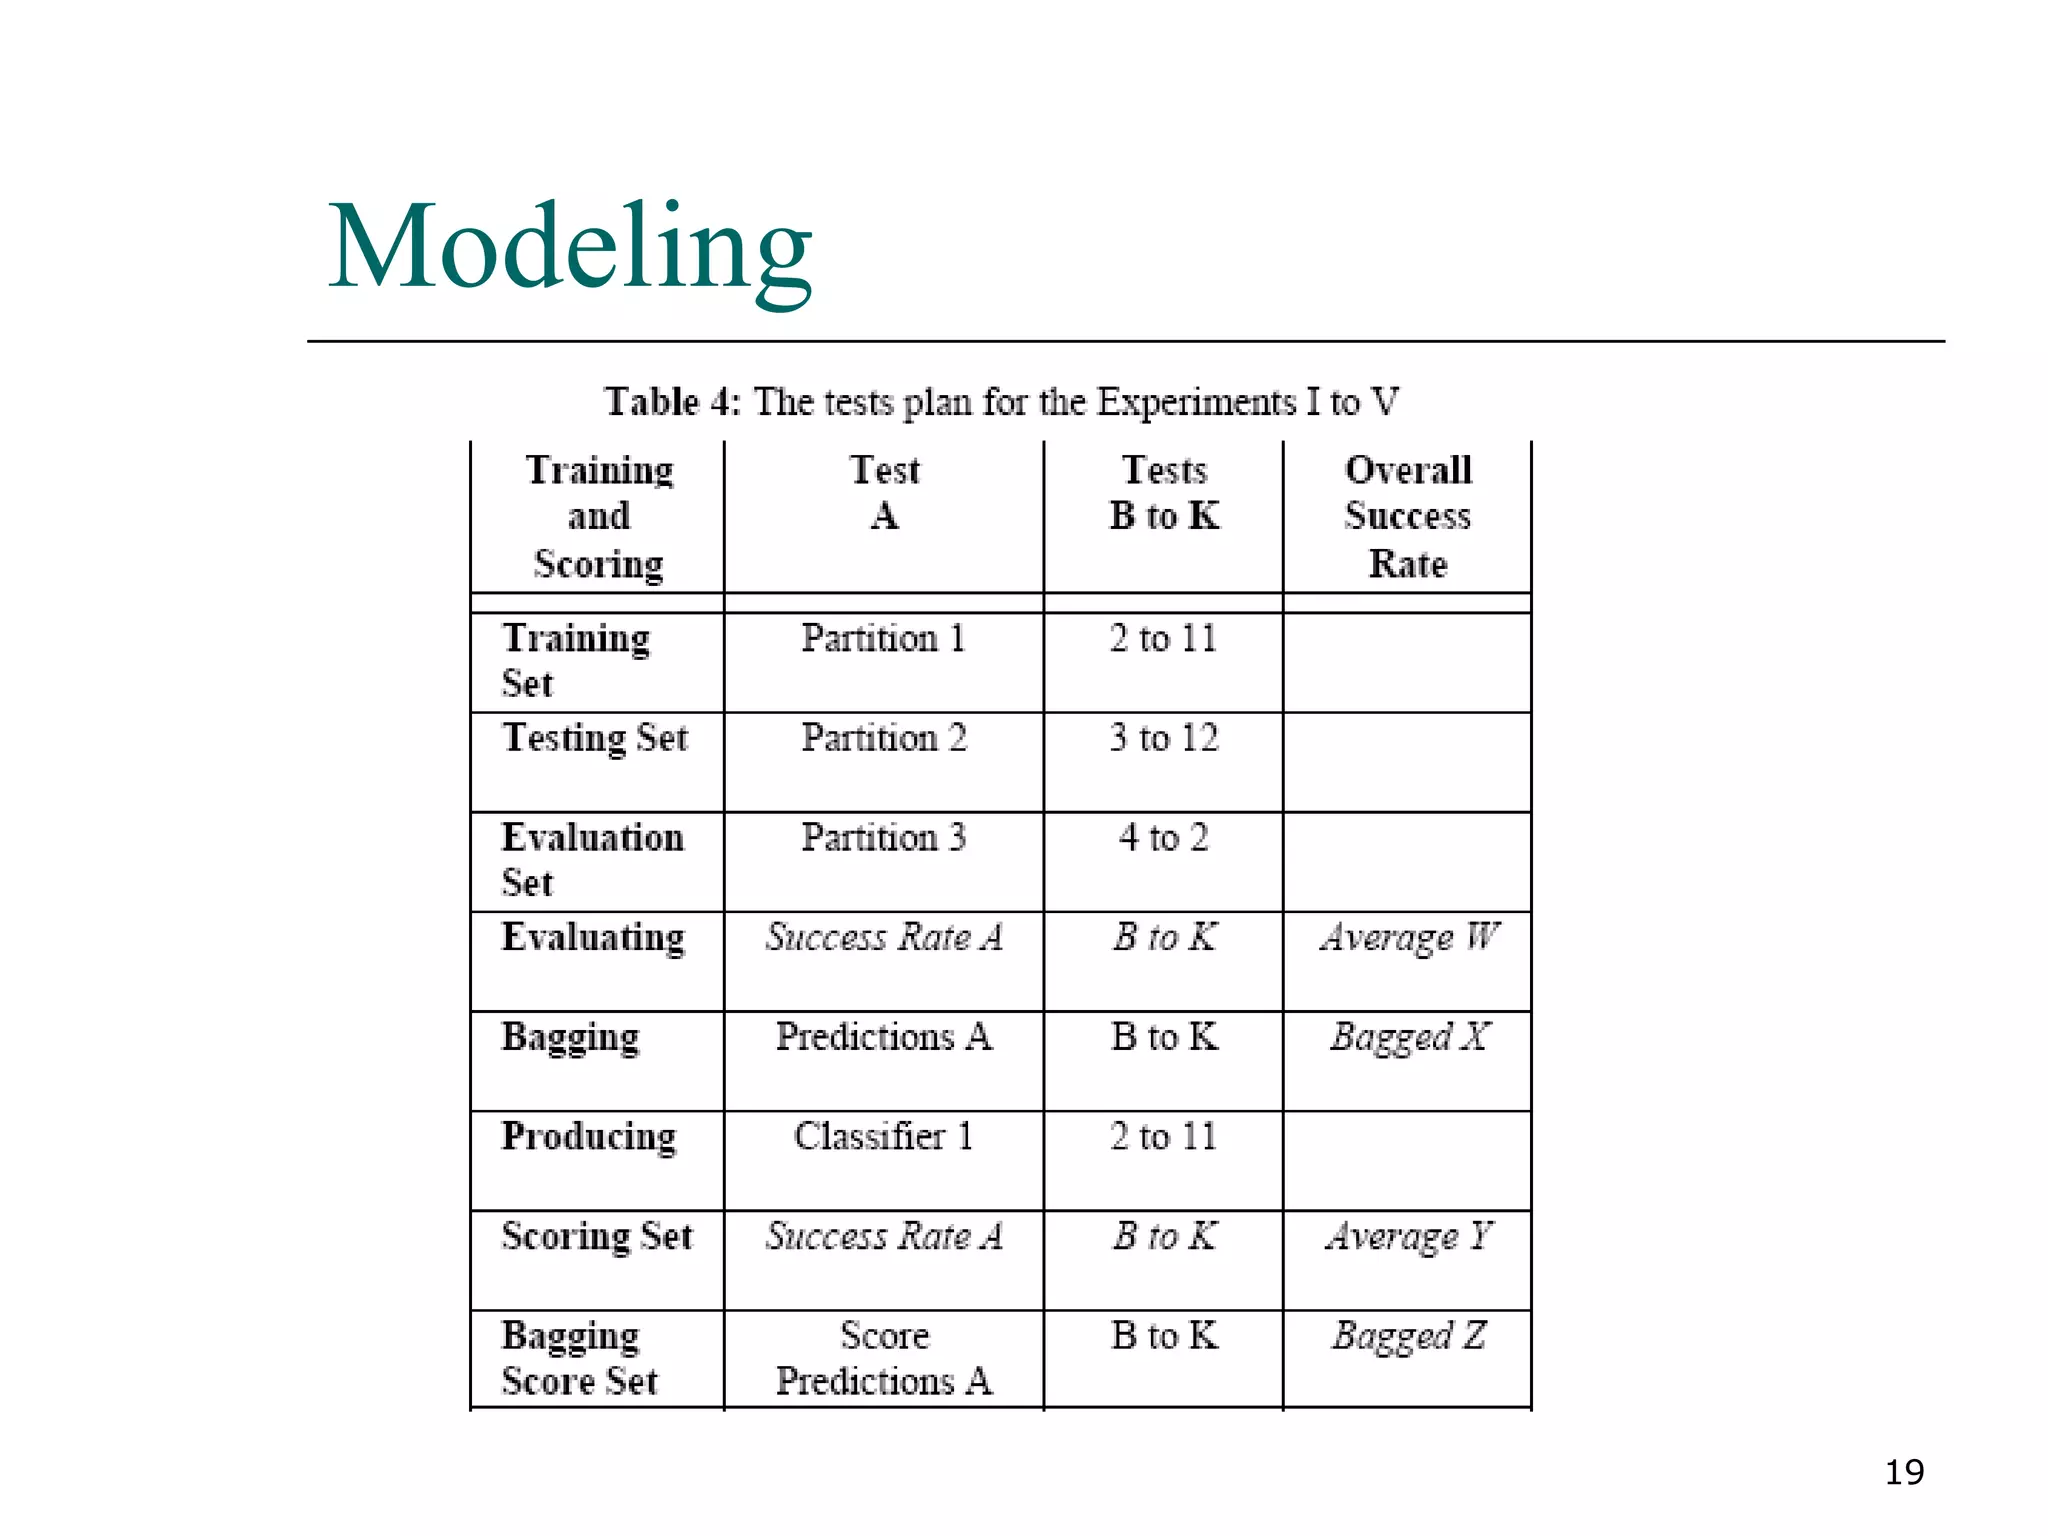

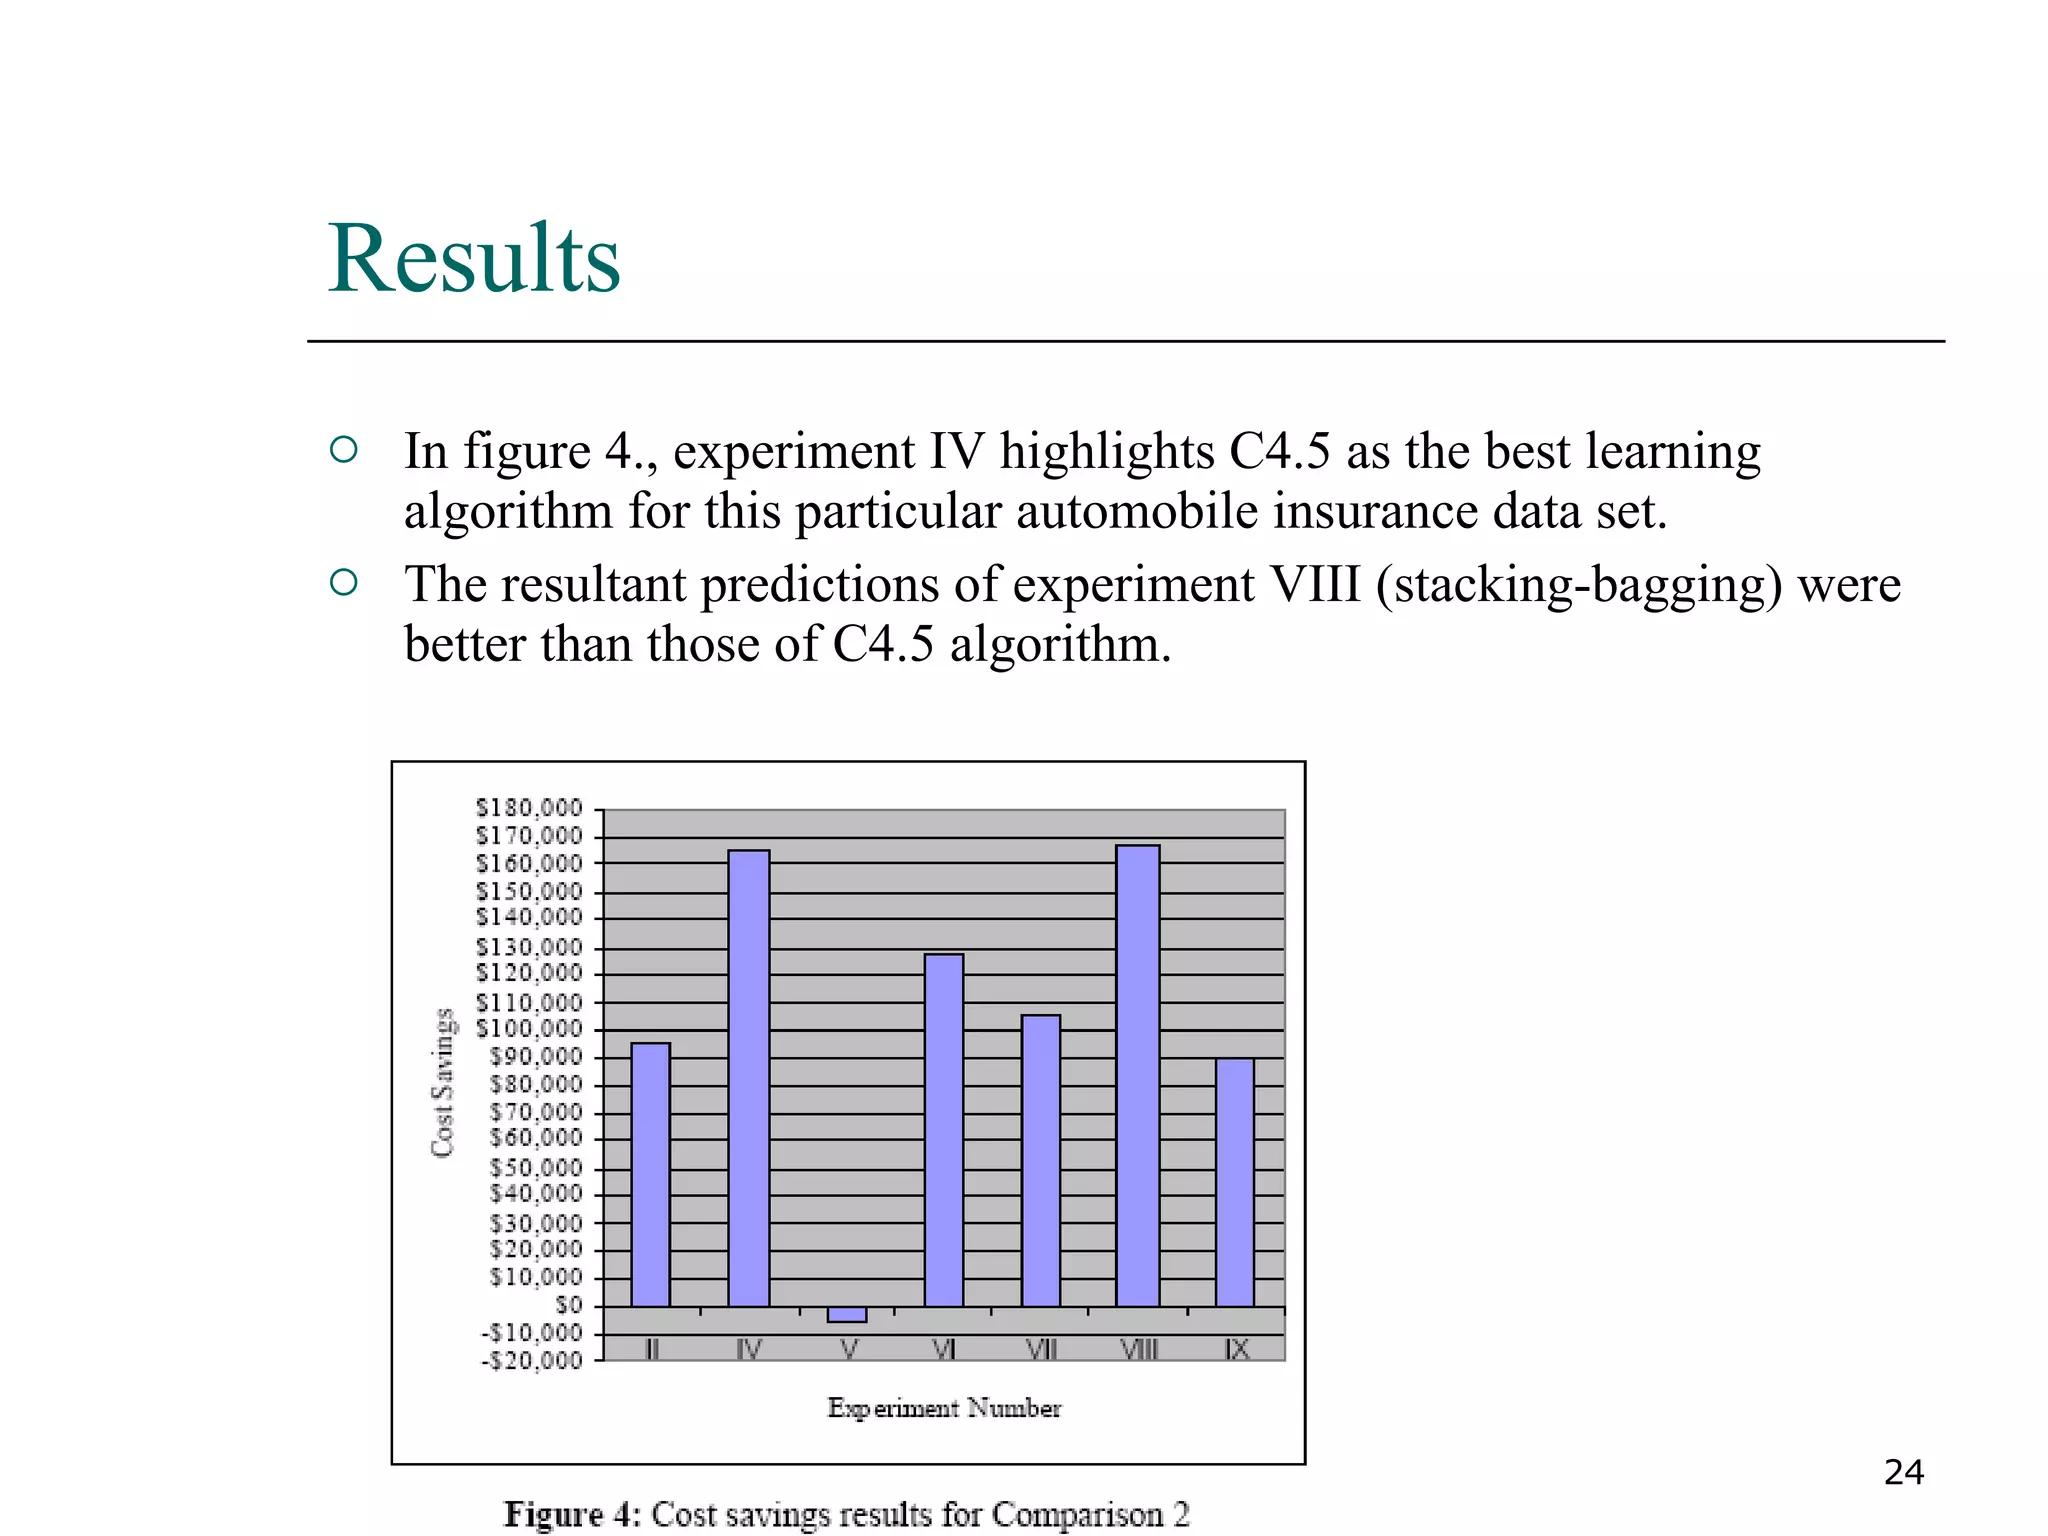
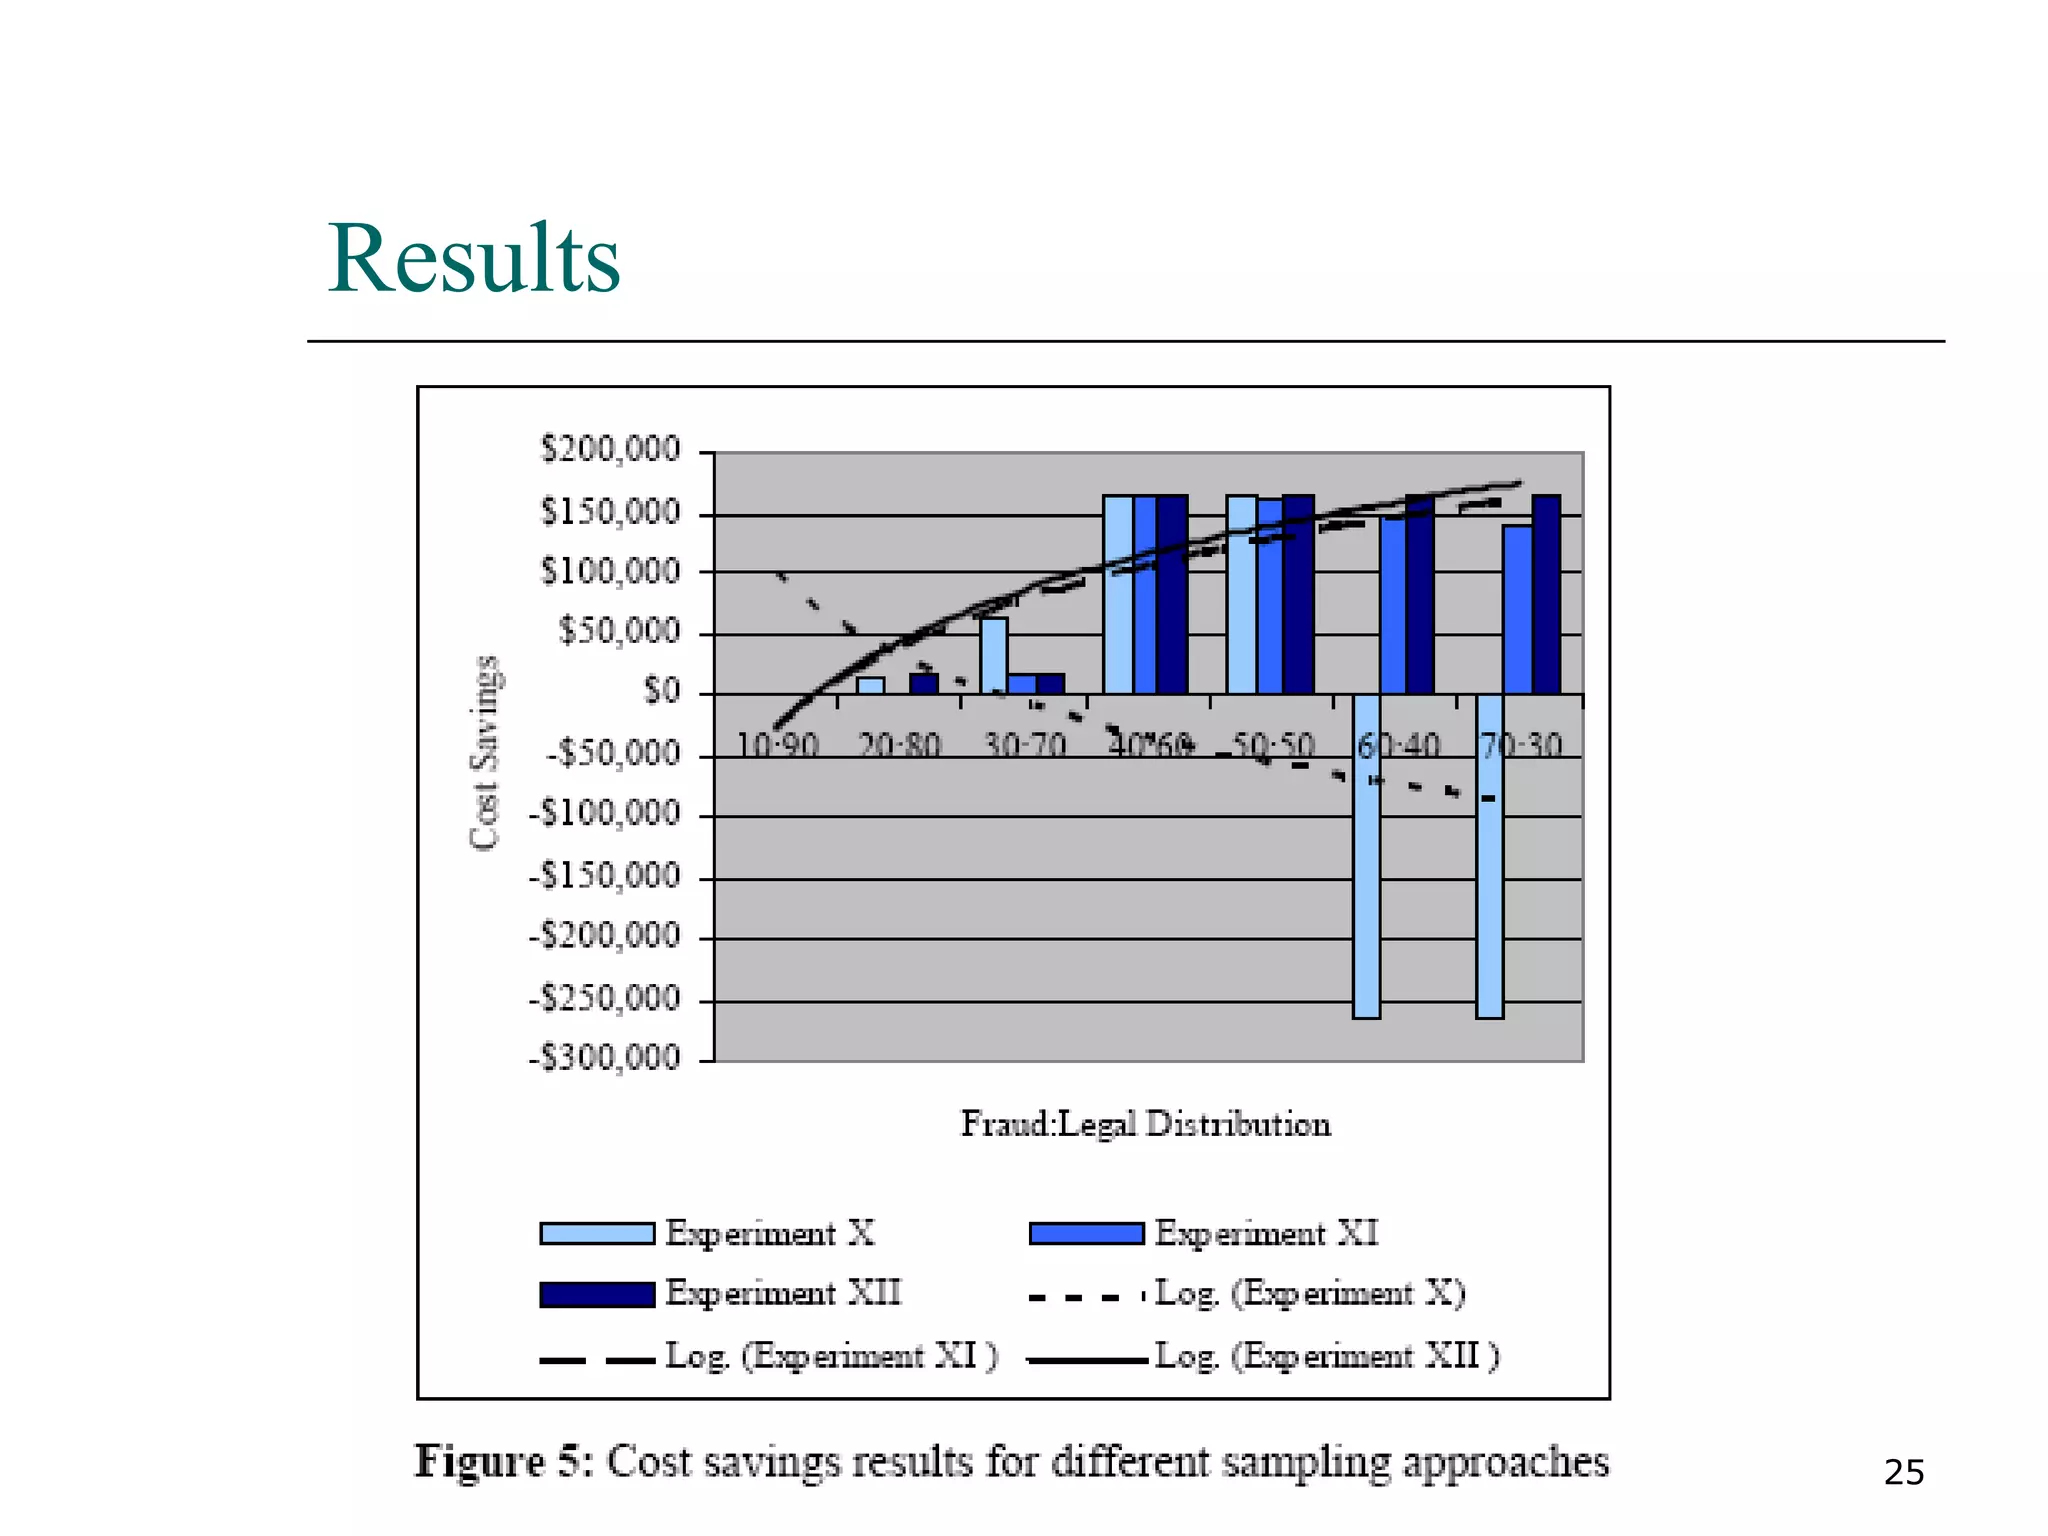
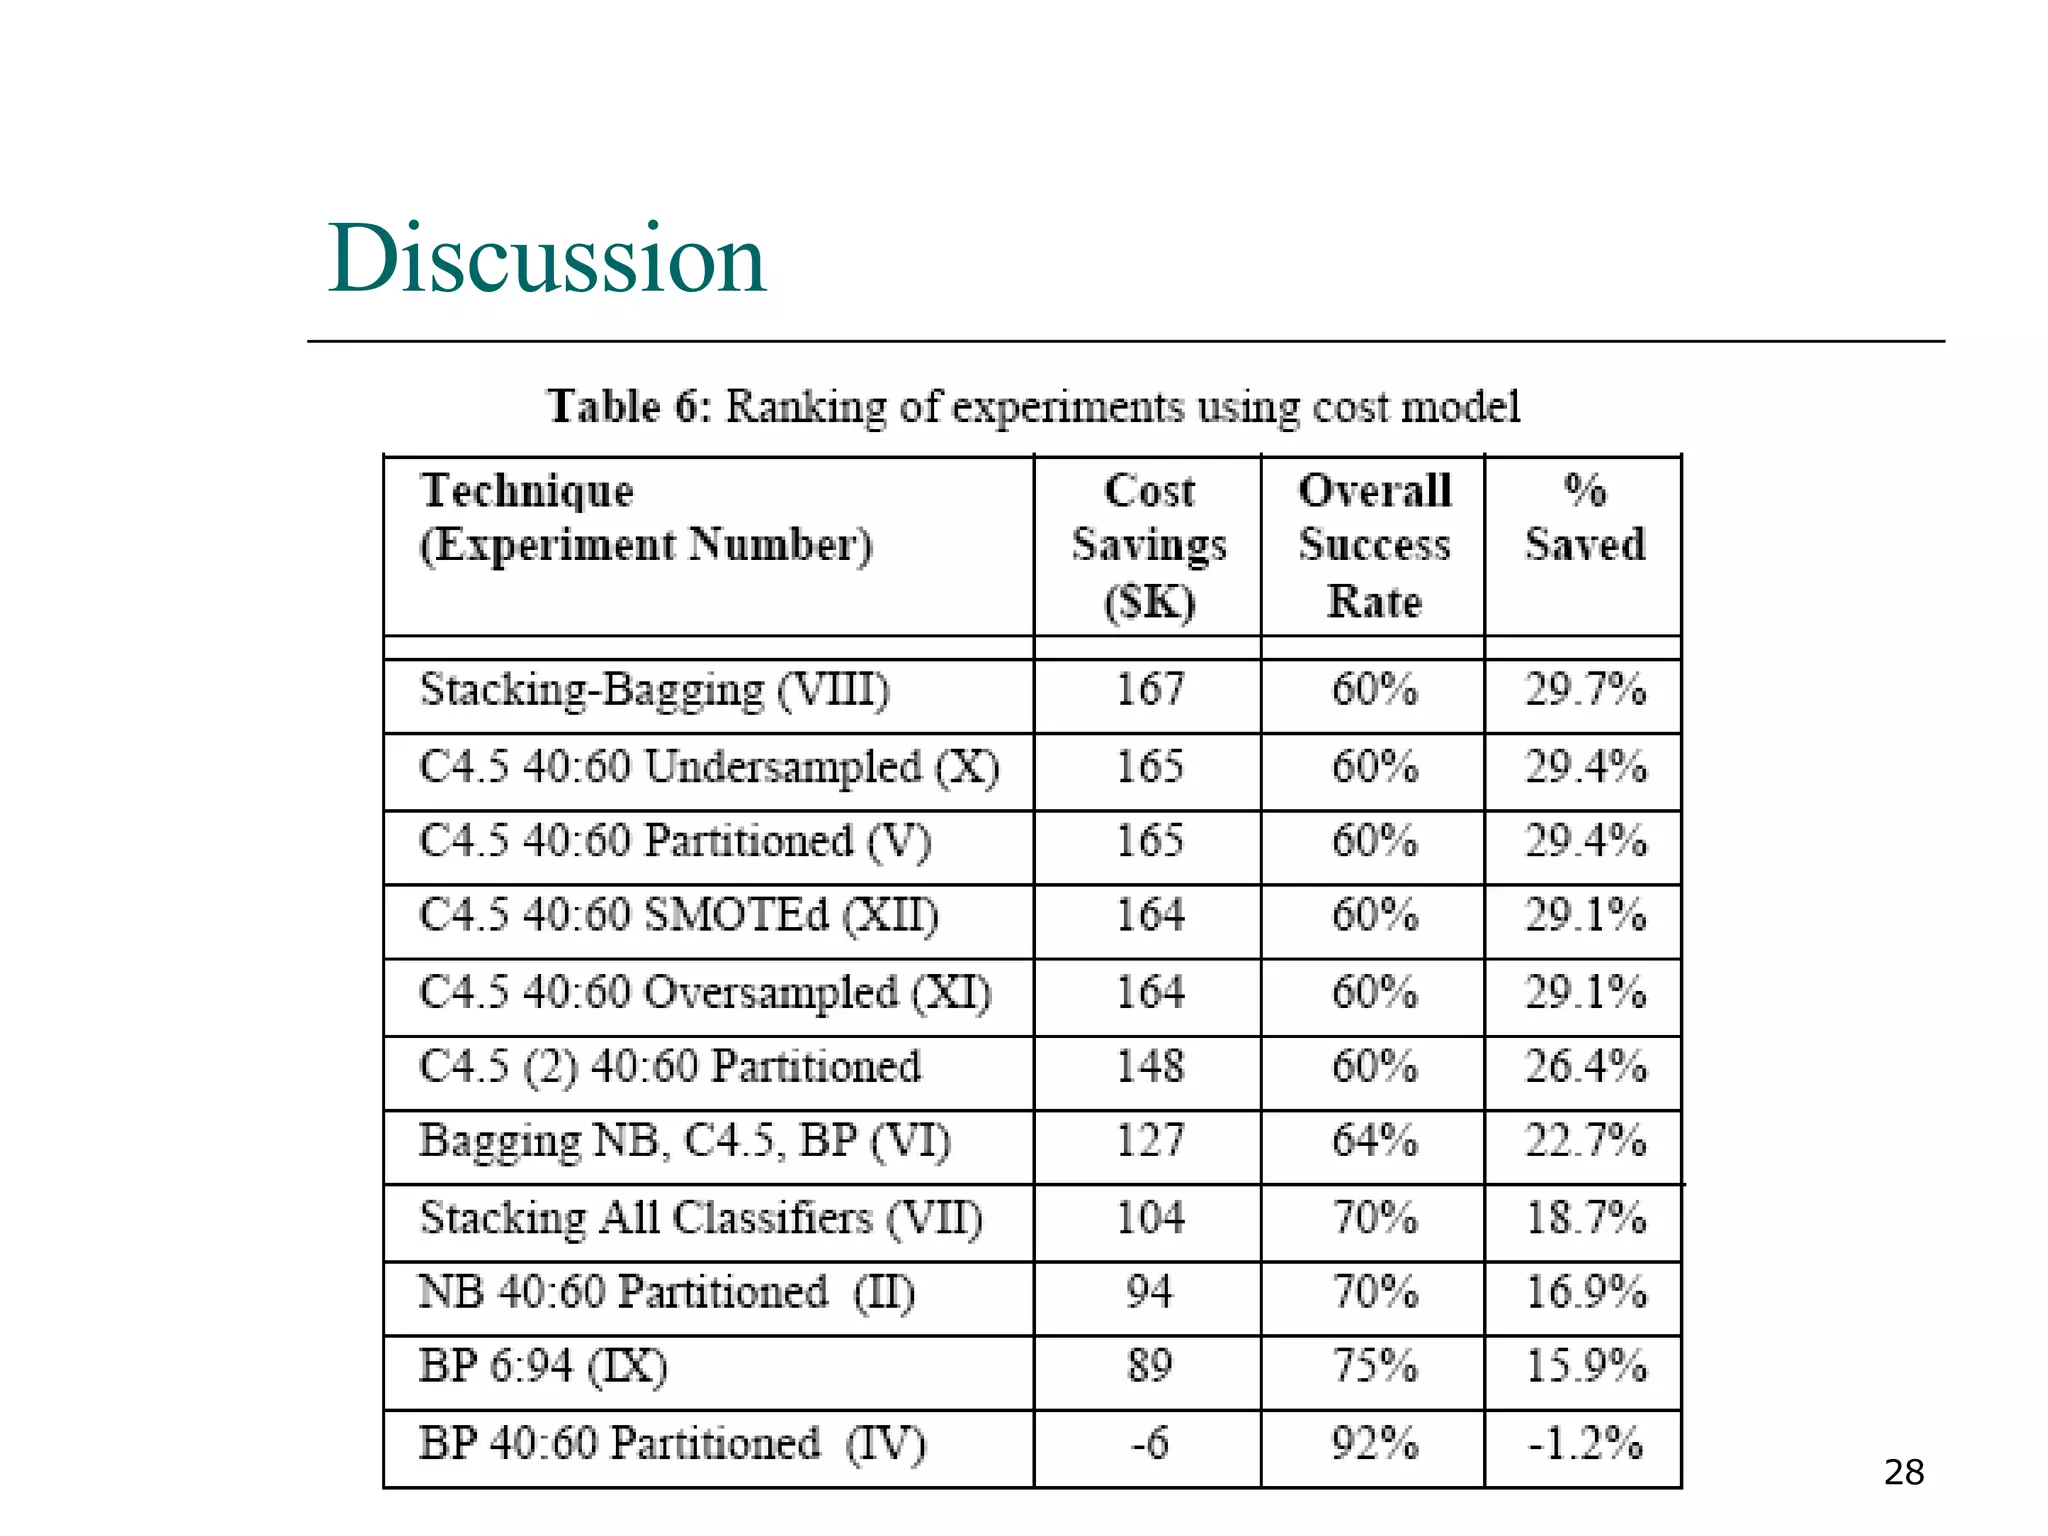
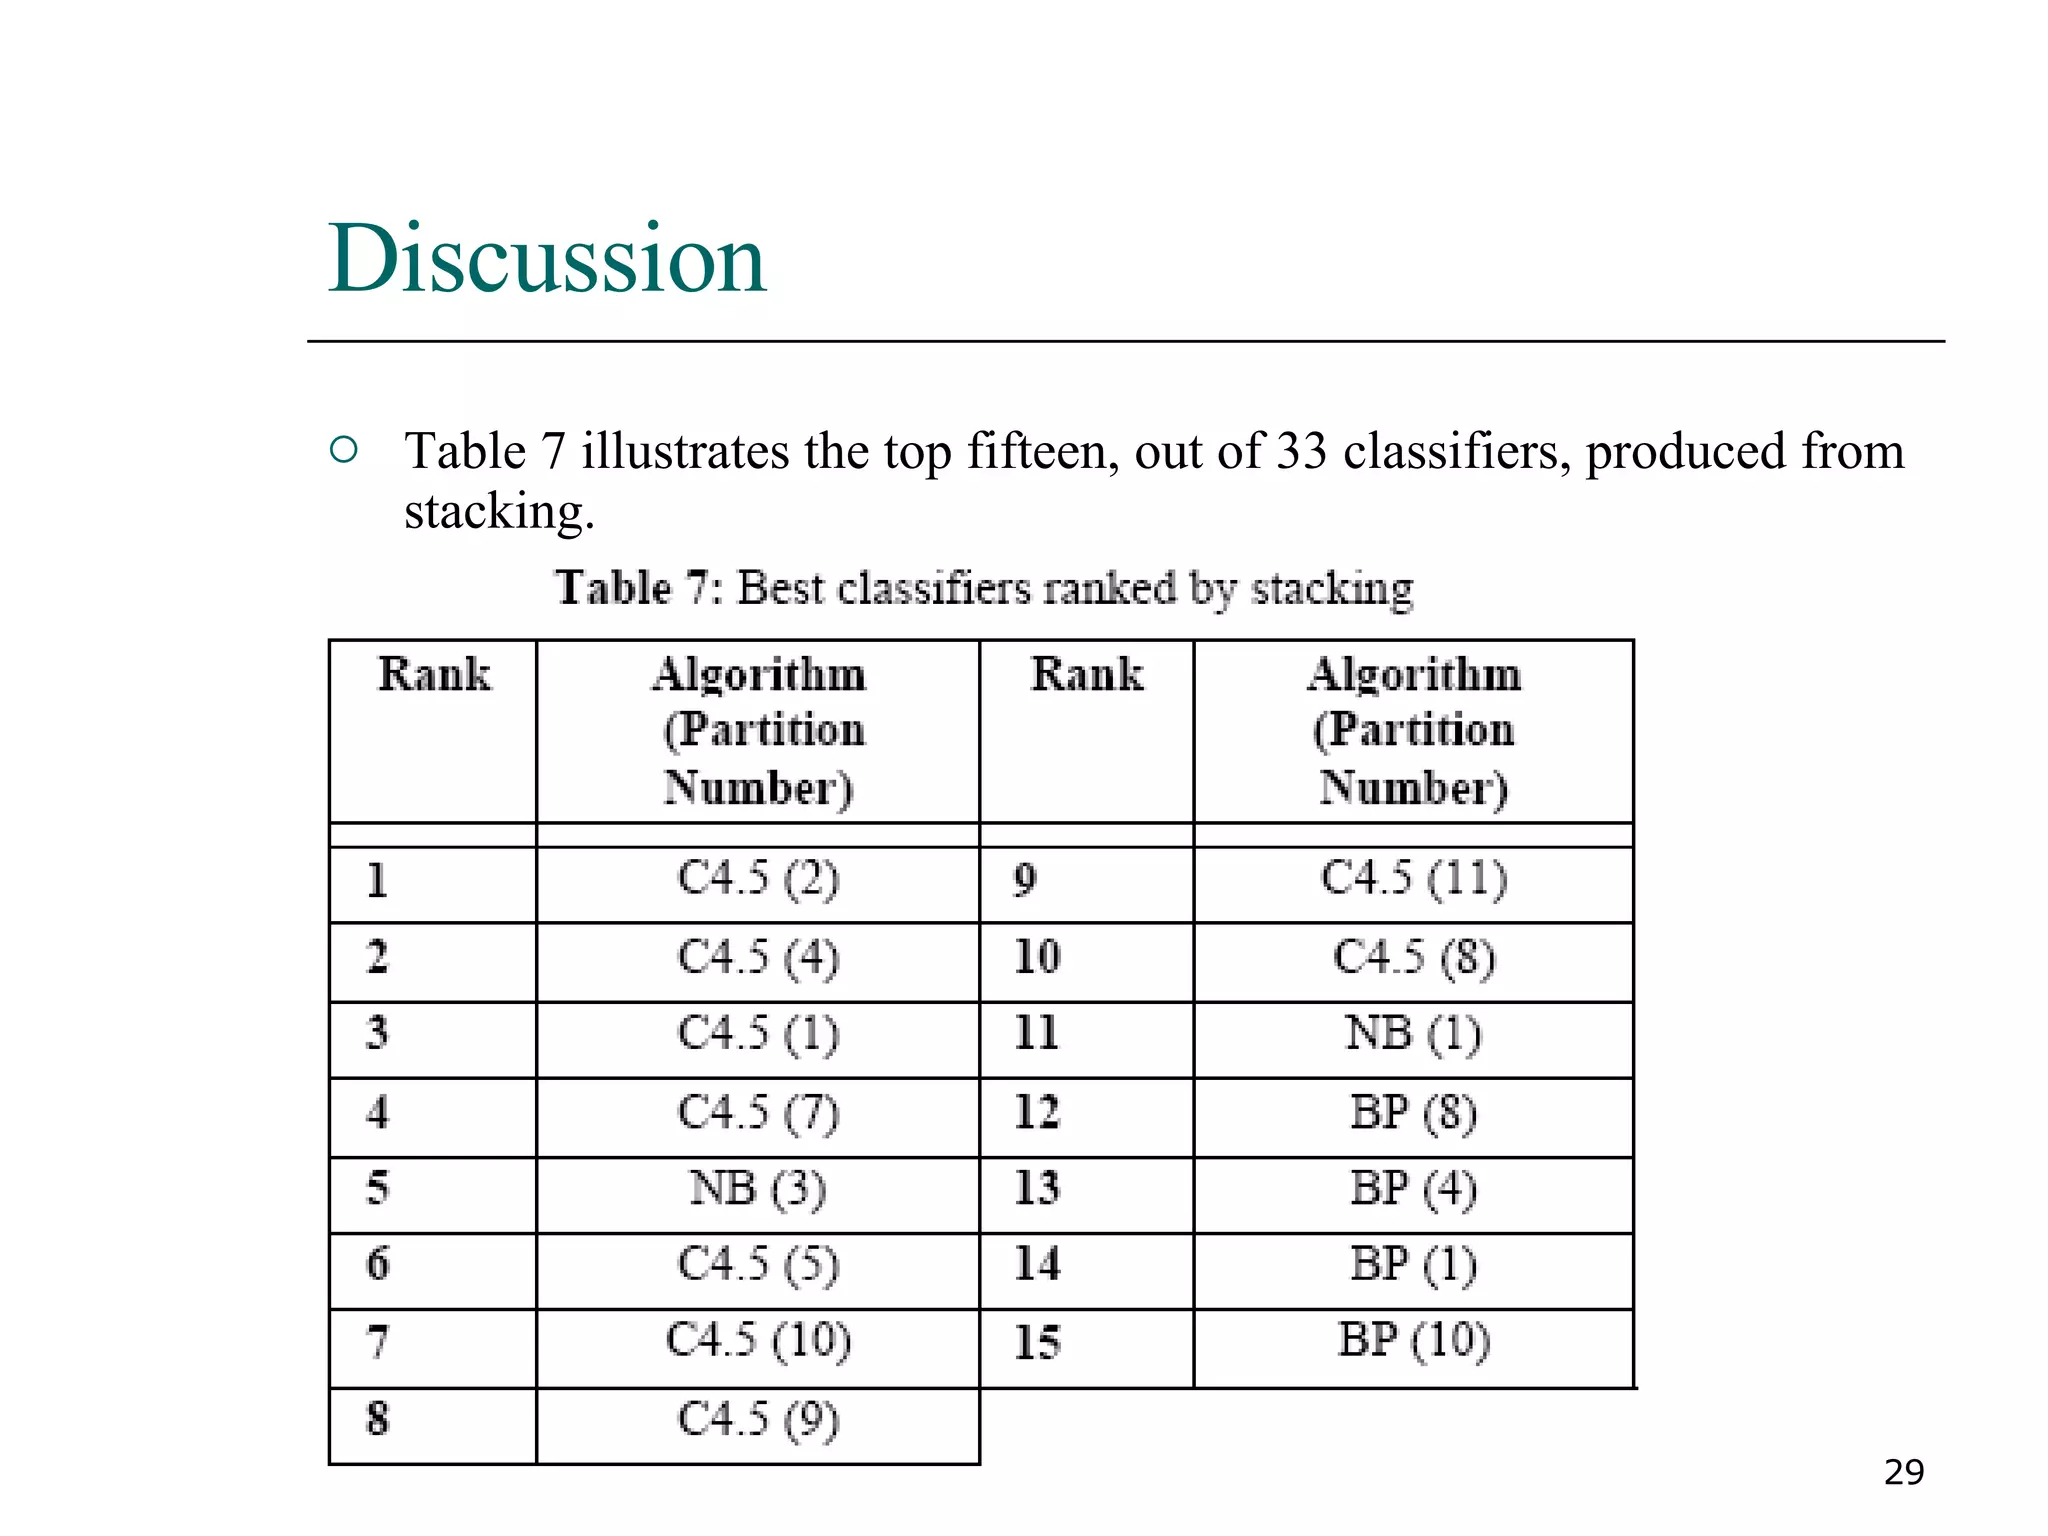

This paper proposes a new method for fraud detection in skewed data that uses multiple classifiers on data partitions. It compares this new method against other sampling and classification techniques on an automobile insurance fraud detection data set. The results show that the new method, which uses stacking and bagging of Naive Bayes, C4.5, and backpropagation classifiers on minority-oversampled partitions, achieves the highest cost savings compared to other sampling and single classifier approaches.


