Grateful 7 speech thanking everyone that has helped.pdf
Ba group3
1. SUPERVISED LEARNING: CLASSIFY SUBSCRIPTION FRAUD
The problem: Bad Idea Company knew that eventually someone will work on an Analytics
project on their rate plans. So they designed a weird rate plan called Praxis Plan where you
are allowed to make only one call in the Morning (9AM-Noon), Afternoon (Noon-4PM),
Evening(4PM-9PM) and Night (9PM-Midnight). i.e. 4 calls per day. This was a very popular
plan and lot of people opted for the plan.
However, Bad Idea was a target of Subscription Fraud by a gang of fraudsters consisting
of 3 people: Sally, Vince and Virginia. They finally terminated their services. Bad Idea has
their call logs spanning over one and half months.
After every 5 days they undertake an audit to see whether these Fraudsters have joined
their network. They review the list of subscribers who have made calls to the same people
as these three fraudsters and in the same time frame.
The approach: This problem may be classified as an example of Supervised Learning
Techniques in Machine Learning. Unlike unsupervised learning, where the idea is to find
patterns in unlabeled data, supervised learning is the task of inferring a function from
labeled training data. To be able to find a suitable classifier to provide a solution to the
problem, we take a look at our data.
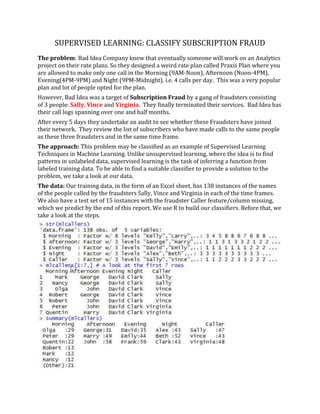
The data: Our training data, in the form of an Excel sheet, has 138 instances of the names
of the people called by the fraudsters Sally, Vince and Virginia in each of the time frames.
We also have a test set of 15 instances with the fraudster Caller feature/column missing,
which we predict by the end of this report. We use R to build our classifiers. Before that, we
take a look at the steps.
2. Methods: Since we deal with categorical or non-metric data, we have used Naïve Bayes
classification technique using both the “caret” and “klaR” packages in R. A Naïve Bayes
classifier is a simple probabilistic classifier based on applying Bayes’ theorem with strong
independence assumptions. In simple terms, a Naïve Bayes classifier assumes that the
presence or absence of a particular feature is unrelated (independent) to the presence or
absence of any other feature, given the class variable. So in this case, given each caller, each
of the time frames or features is independent of each other.
An advantage of using Naïve Bayes classifier is that it only requires a small amount of
training data to estimate the parameters necessary for classification.
Since this problem follows Bayes theorem (in a way), we can compute each of the steps required
manually. Let us find the prior probabilities of each caller.
P(Sally) = 47/138 = 0.340579710144928
P(Vince) = 43/138 = 0.311594202898551
P(Virginia) = 48/138 = 0.347826086956522
This we compute from our training data (mlcallers), our given labeled BlackListedSubscriberCall
dataset. Now suppose we need to find out who the likely caller would be, if in the Morning, a
call was made to Robert, in the Afternoon to John, in the Evening to David and at night to Alex.
P(Morning = Robert| Caller=Sally) = 0 :According to Laplace, we assume non zero probabilities
P(Afternoon = John| Caller = Sally) = 19/47
P(Evening = David| Caller = Sally) = 23/47
P(Night = Alex| Caller = Sally) = 28/47
Thus, P(Caller = Sally| Morning = R, Afternoon = J, Evening = D, Night = Alex)
= 0*(19/47)*(23/47)*(28/47)*(47/138)
which should be zero, but if we assign a threshold probability to events which are very less
likely, we end up with a final conditional probability. Now, computing the same process for both
Vince and Virginia, and then comparing the 3 conditional probabilities, we find that the caller
being Sally has the highest probability, and we choose this maximum.
Cross Validation: In order to implement the Naïve Bayes classifier, we also make use of a 10fold cross validation method. In this method, the algorithm divides the training set randomly into
10 parts, uses 9 parts to train the algorithm and test it on the remaining part. In this case it uses
124 instances randomly to build the classifier, tests it on the remaining 14 instances (rows). For
the next set it might choose another random 125 instances to train and 13 to test on and repeats
this process 10 times. The best algorithm is selected, tweaked if necessary by manipulating a few
parameters, checked for the accuracy and then predicted on the remaining part of the dataset.
The Process: Making use of the “caret” and “klaR” packages in R, we do the following:
Load the libraries
Train our model using 10-fold cross validation
Check for Accuracy and Kappa values
Tweak parameters of the classifier model
3.
Run on test to predict
Now that we have our model in place, we randomly shuffle 15 instances out of our training set (say
about 10%) and test the prediction abilities of our classifier on it.
4. Upon analyzing the confusion matrix, we find that :
The accuracy of our model is (4+3+4)/15 = 73.3%
Precision of predicting Sally = 4/5 = 80%
Precision of predicting Vince = 3/5 = 60%
Precision of predicting Virginia = 4/5 = 80%
Tweaking parameters: A Digression – Upon tweaking a few controls while building the classifier, we
found out that the confusion matrix given by our initial model remained unchanged. In this case, we
have used “usekernel = TRUE” and “factor Laplace smoothing (fL) = 2). Kernel Density Estimation
is a non-parametric way to estimate the probability density function of a random variable, mostly a
data smoothing technique. Laplace or Additive smoothing is a technique used to smooth categorical
data. Additive smoothing allows the assignment of non-zero probabilities to events which do not
occur in a sample.
Also checking for the posterior probabilities, we find that the predictions on the random (single)
part of our training set, populates strong conditional probabilities in most cases.
5. The unseen test data: All of these activities till now is done precisely on the training set, albeit
splitting and randomly validating each part. Now we move on to an unlabeled test set, ie, one
without the Caller column, which we need to predict with the algorithm, trained earlier.
The new, unseen test set has only 15 observations but without the class label. We call it the
“testdata”.
6. Now trying to predict the Caller in terms of confidence or the conditional probability, we have:
The calling pattern can be predicted fairly, apart from those marked in red. For those instances, we
do not have strong probability evidence to make us feel certain that the callers might indeed be
fraudsters. We might want to flag those instances and set up a tagged priority for those cases. For
others, we might be quite sure of, probabilistically.
Using Decision Trees: Decision Tree Learning (or Classification Tree) uses decision tree as a
predictive model which maps observations about an item to conclusions about the item’s target
value. In these tree structures, leaves represent class labels and branches represent conjunctions of
features that lead to those class labels. The classification tree can be used as an input for decision
making.
Once again, we make use of cross validation techniques, to build the classifier. The code goes as:
7. Comparing the accuracy of the classifier with the results of the Naïve Bayes’, we find that the latter
still scores better. We then plot the tree as:
An error with this graph is Sally being printed all throughout the bottom of the plot. We consider it
to be the caller whose probability of occurrence is maximum. For example, in node 20 (second from
right), it should have been Virginia.
Reading the plot: In the evening, if the call lands to Frank and at night, to Clark, and in the morning
the call reaches either, Kelly, Larry or Robert, the probability of the caller fraudster being Vince is
close to 80%. The entire tree may be read similarly, taking into account all the branches and leaves.
Code Re-Run: Tweaking our decision tree algorithm a bit further, we came up with an accuracy
quite close to that predicted by the Naïve Bayes classifier.
8. Going by mini-criterion at 0.01, we arrive at an accuracy of 72.6%. Further, we try to implement a
Random Forest classifier on the given data.
9. Using Random Forests: Random Forests are an ensemble learning method for classification, that
operate by constructing a multitude of decision trees at training time and outputting the class that
is the mode of the classes output by individual trees.
Using R codes similarly, to train the classifier, we use:
Though we find that the model accuracy is higher than the Naïve Bayes at 84.8%, we still fail to use
this classifier as the confusion matrix on the train set (which should ideally give very optimistic
results) shows around 43% error rate.
Decisively and looking into all of these models, we come to the conclusion that Naïve Bayes may be
considered the best classifier in this case, maybe because the data is considerably small or it is
categorical and of course, provides us with the best results.