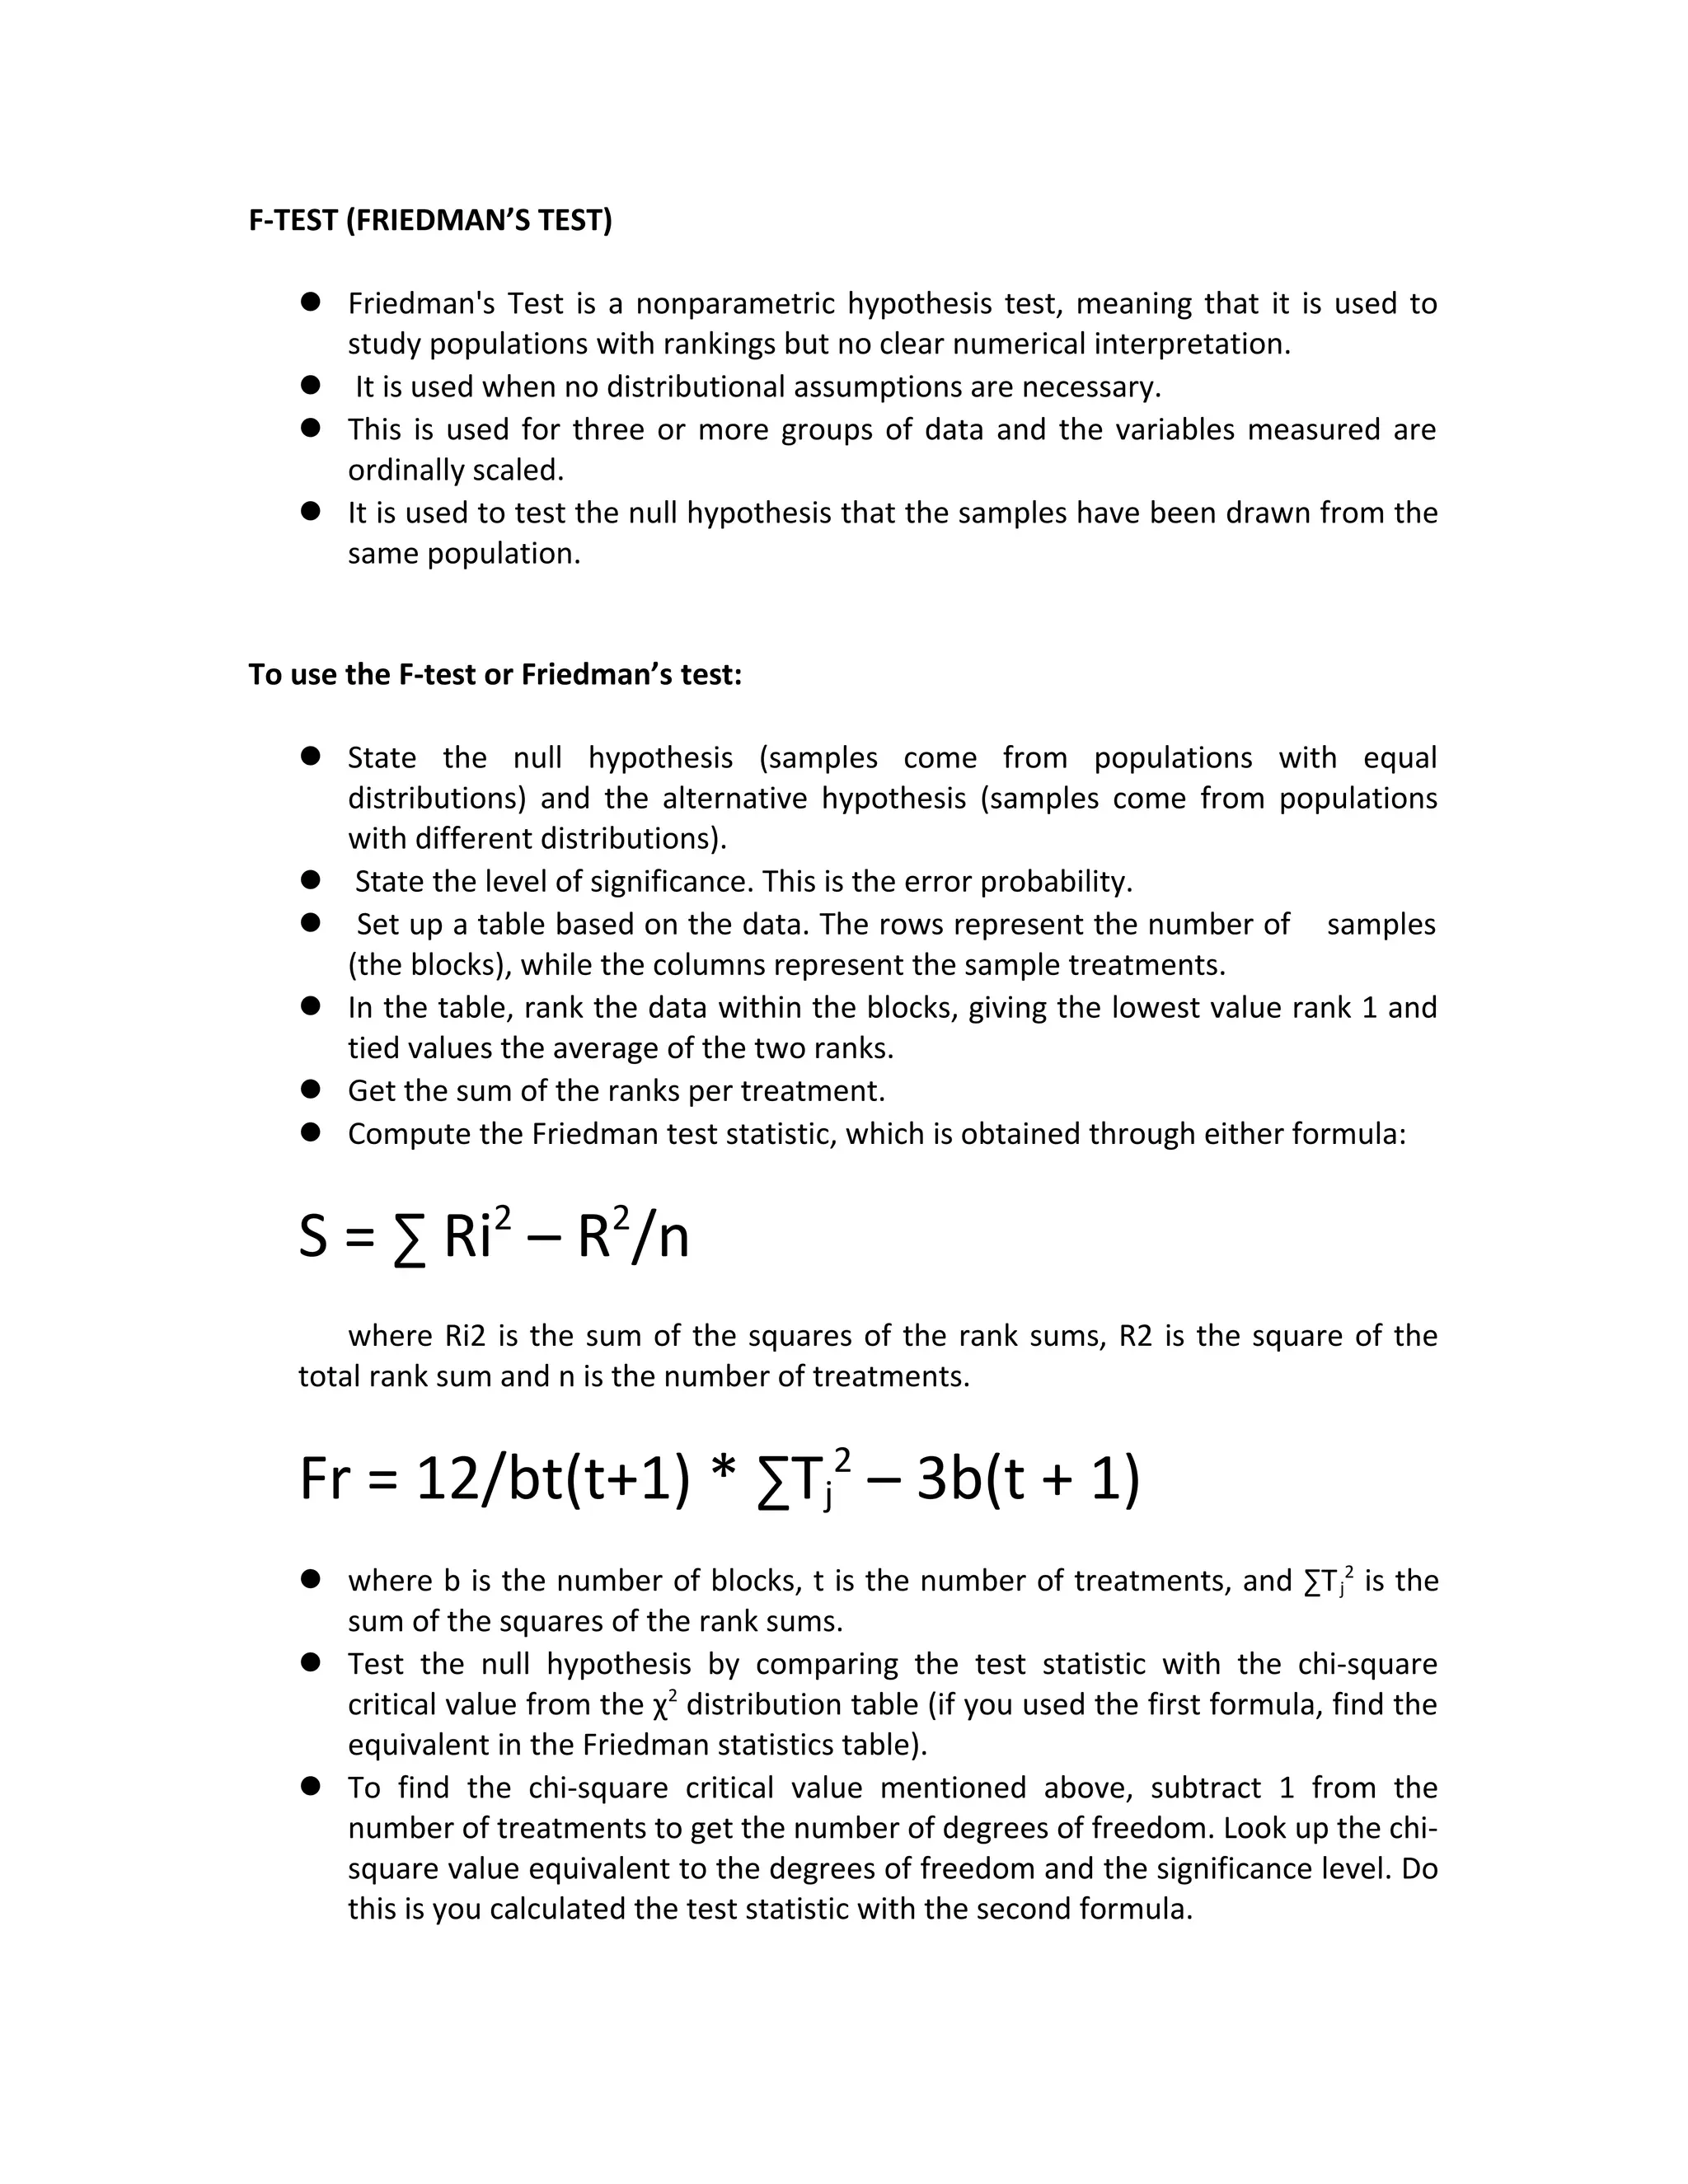
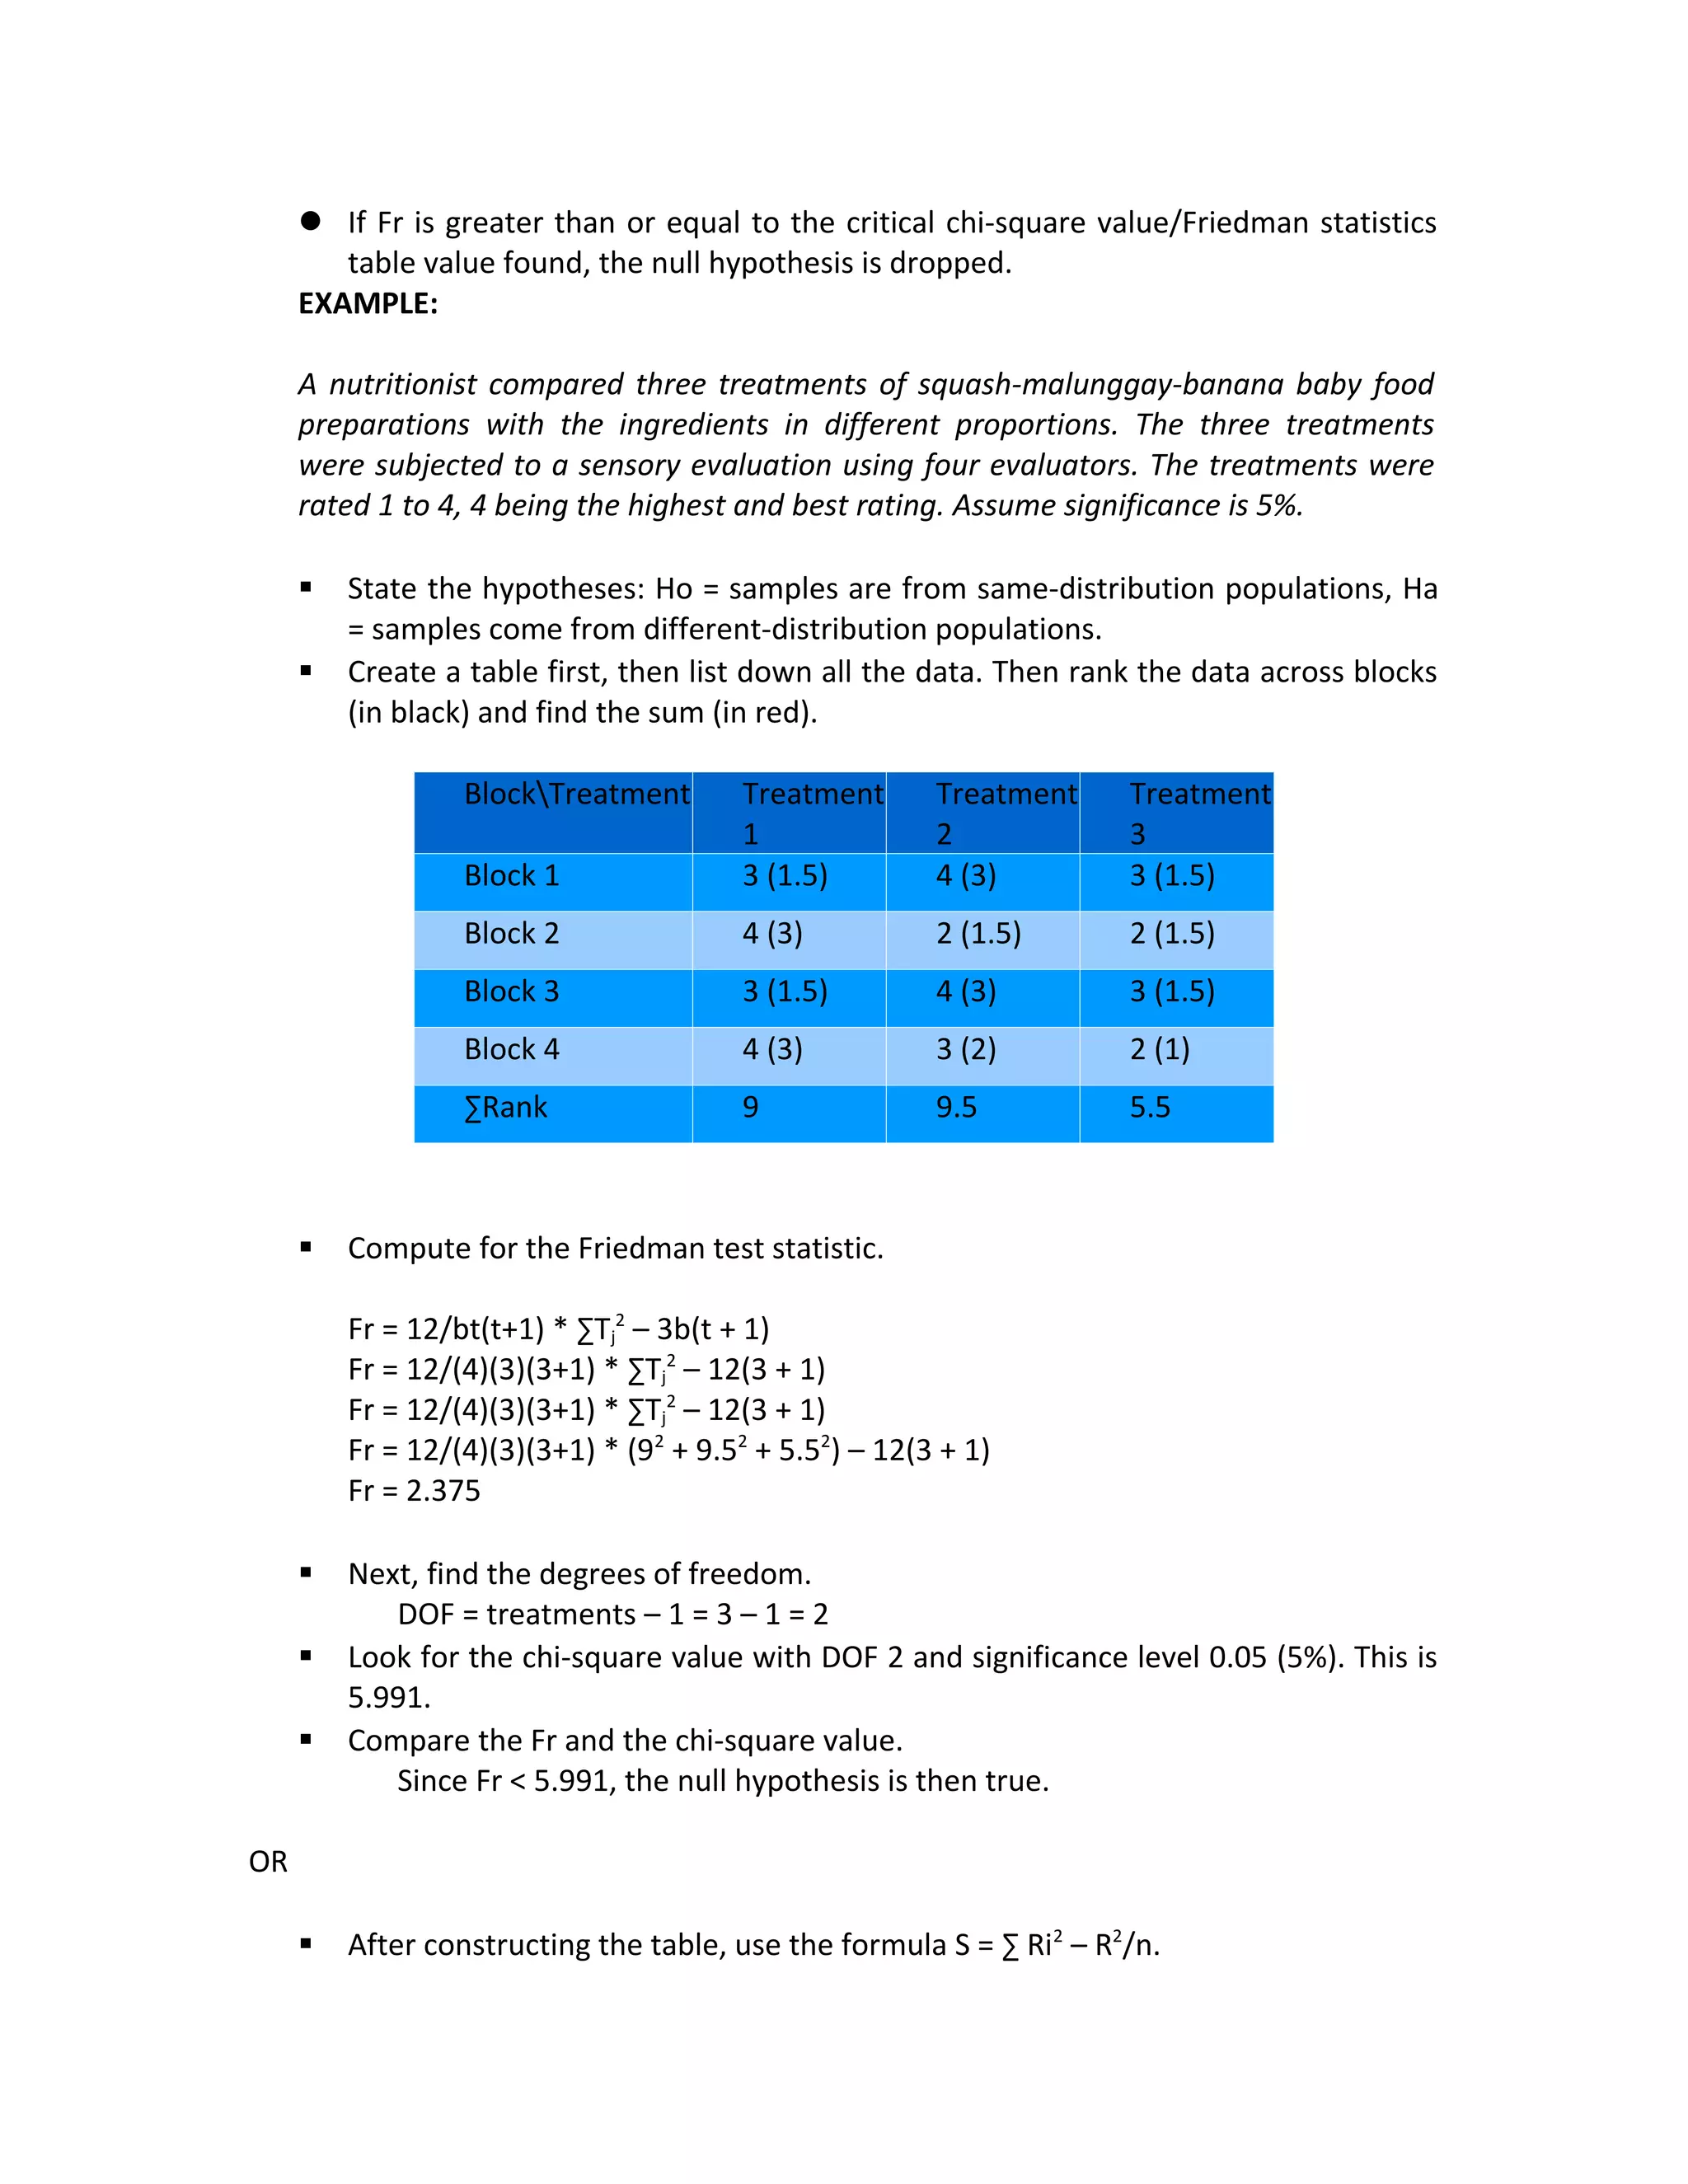
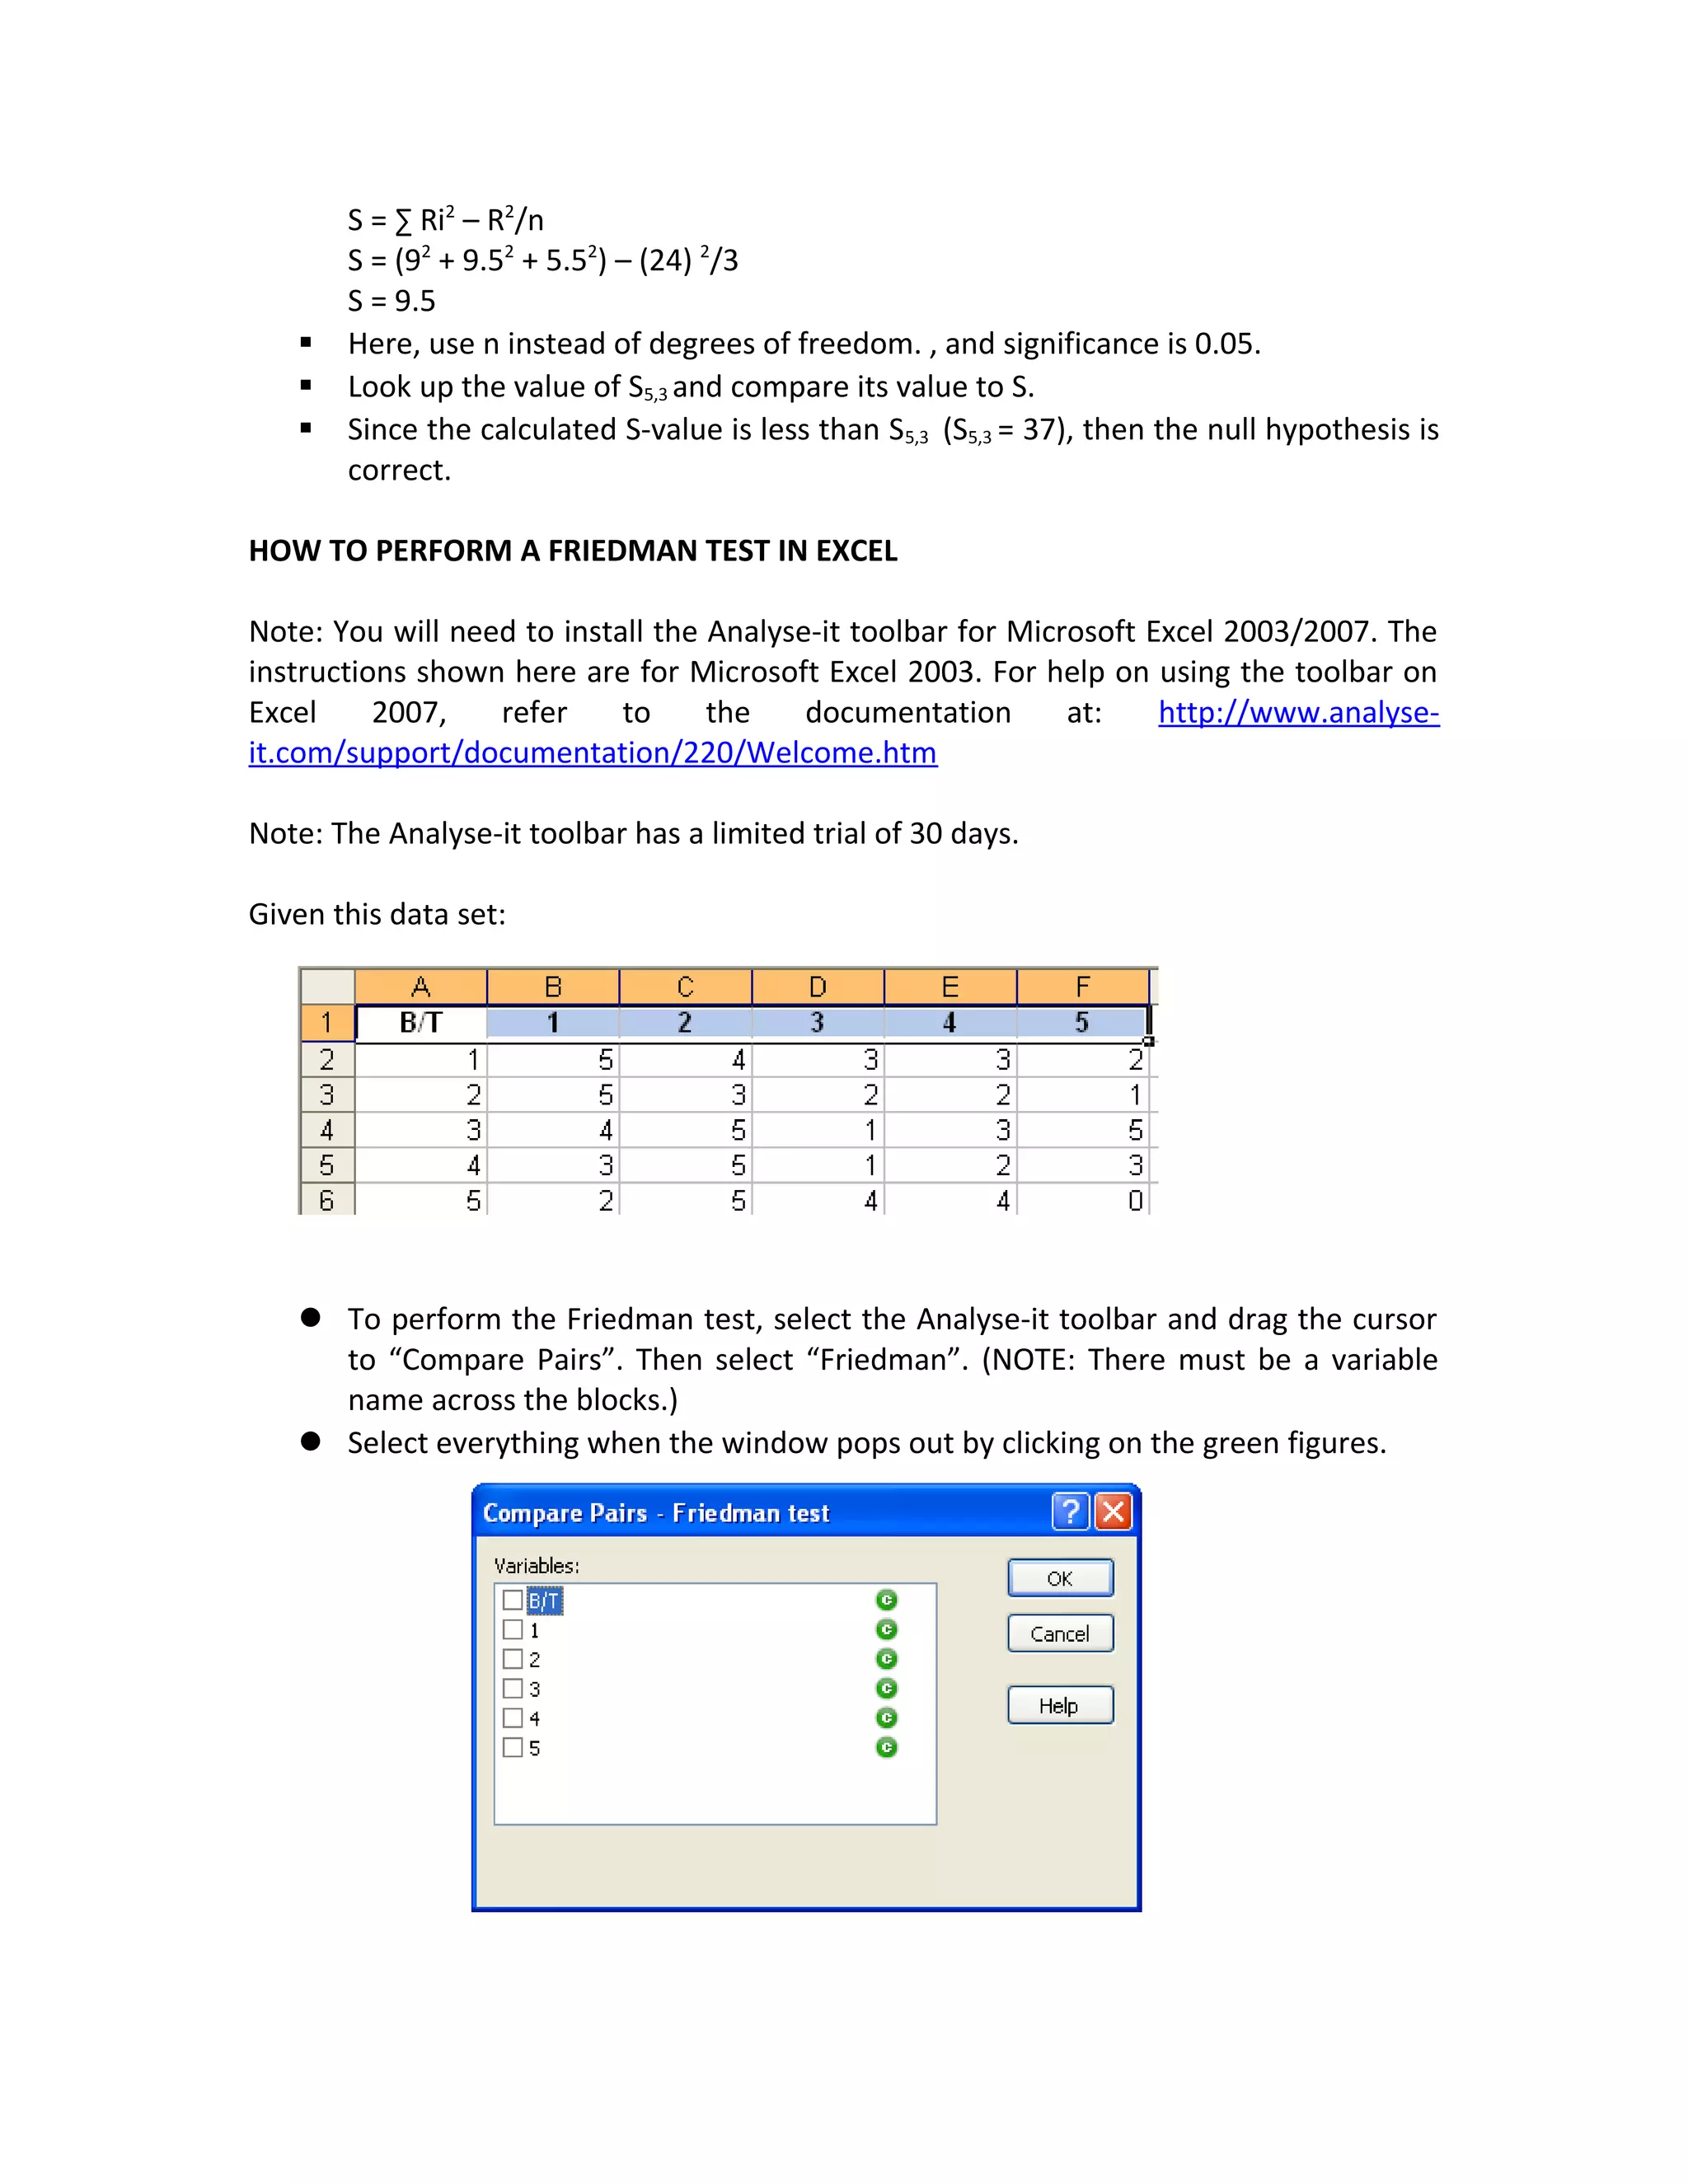
F-TEST (FRIEDMAN’S TEST)
 Friedman's Test is a nonparametric hypothesis test, meaning that it is used to
study populations with rankings but no clear numerical interpretation.
 It is used when no distributional assumptions are necessary.
 This is used for three or more groups of data and the variables measured are
ordinally scaled.
 It is used to test the null hypothesis that the samples have been drawn from the
same population.
To use the F-test or Friedman’s test:
 State the null hypothesis (samples come from populations with equal
distributions) and the alternative hypothesis (samples come from populations
with different distributions).
 State the level of significance. This is the error probability.
 Set up a table based on the data. The rows represent the number of samples
(the blocks), while the columns represent the sample treatments.
 In the table, rank the data within the blocks, giving the lowest value rank 1 and
tied values the average of the two ranks.
 Get the sum of the ranks per treatment.
 Compute the Friedman test statistic, which is obtained through either formula:
S = ∑ Ri2
– R2
/n
where Ri2 is the sum of the squares of the rank sums, R2 is the square of the
total rank sum and n is the number of treatments.
Fr = 12/bt(t+1) * ∑Tj
2
– 3b(t + 1)
 where b is the number of blocks, t is the number of treatments, and ∑Tj
2
is the
sum of the squares of the rank sums.
 Test the null hypothesis by comparing the test statistic with the chi-square
critical value from the χ2
distribution table (if you used the first formula, find the
equivalent in the Friedman statistics table).
 To find the chi-square critical value mentioned above, subtract 1 from the
number of treatments to get the number of degrees of freedom. Look up the chi-
square value equivalent to the degrees of freedom and the significance level. Do
this is you calculated the test statistic with the second formula.
 If Fr is greater than or equal to the critical chi-square value/Friedman statistics
table value found, the null hypothesis is dropped.
EXAMPLE:
A nutritionist compared three treatments of squash-malunggay-banana baby food
preparations with the ingredients in different proportions. The three treatments
were subjected to a sensory evaluation using four evaluators. The treatments were
rated 1 to 4, 4 being the highest and best rating. Assume significance is 5%.
 State the hypotheses: Ho = samples are from same-distribution populations, Ha
= samples come from different-distribution populations.
 Create a table first, then list down all the data. Then rank the data across blocks
(in black) and find the sum (in red).
BlockTreatment Treatment
1
Treatment
2
Treatment
3
Block 1 3 (1.5) 4 (3) 3 (1.5)
Block 2 4 (3) 2 (1.5) 2 (1.5)
Block 3 3 (1.5) 4 (3) 3 (1.5)
Block 4 4 (3) 3 (2) 2 (1)
∑Rank 9 9.5 5.5
 Compute for the Friedman test statistic.
Fr = 12/bt(t+1) * ∑Tj
2
– 3b(t + 1)
Fr = 12/(4)(3)(3+1) * ∑Tj
2
– 12(3 + 1)
Fr = 12/(4)(3)(3+1) * ∑Tj
2
– 12(3 + 1)
Fr = 12/(4)(3)(3+1) * (92
+ 9.52
+ 5.52
) – 12(3 + 1)
Fr = 2.375
 Next, find the degrees of freedom.
DOF = treatments – 1 = 3 – 1 = 2
 Look for the chi-square value with DOF 2 and significance level 0.05 (5%). This is
5.991.
 Compare the Fr and the chi-square value.
Since Fr < 5.991, the null hypothesis is then true.
OR
 After constructing the table, use the formula S = ∑ Ri2
– R2
/n.
S = ∑ Ri2
– R2
/n
S = (92
+ 9.52
+ 5.52
) – (24) 2
/3
S = 9.5
 Here, use n instead of degrees of freedom. , and significance is 0.05.
 Look up the value of S5,3 and compare its value to S.
 Since the calculated S-value is less than S5,3 (S5,3 = 37), then the null hypothesis is
correct.
HOW TO PERFORM A FRIEDMAN TEST IN EXCEL
Note: You will need to install the Analyse-it toolbar for Microsoft Excel 2003/2007. The
instructions shown here are for Microsoft Excel 2003. For help on using the toolbar on
Excel 2007, refer to the documentation at: http://www.analyse-
it.com/support/documentation/220/Welcome.htm
Note: The Analyse-it toolbar has a limited trial of 30 days.
Given this data set:
 To perform the Friedman test, select the Analyse-it toolbar and drag the cursor
to “Compare Pairs”. Then select “Friedman”. (NOTE: There must be a variable
name across the blocks.)
 Select everything when the window pops out by clicking on the green figures.
 It will display a set of results for Friedman test.

Str f-test

  • 1.
    F-TEST (FRIEDMAN’S TEST) Friedman's Test is a nonparametric hypothesis test, meaning that it is used to study populations with rankings but no clear numerical interpretation.  It is used when no distributional assumptions are necessary.  This is used for three or more groups of data and the variables measured are ordinally scaled.  It is used to test the null hypothesis that the samples have been drawn from the same population. To use the F-test or Friedman’s test:  State the null hypothesis (samples come from populations with equal distributions) and the alternative hypothesis (samples come from populations with different distributions).  State the level of significance. This is the error probability.  Set up a table based on the data. The rows represent the number of samples (the blocks), while the columns represent the sample treatments.  In the table, rank the data within the blocks, giving the lowest value rank 1 and tied values the average of the two ranks.  Get the sum of the ranks per treatment.  Compute the Friedman test statistic, which is obtained through either formula: S = ∑ Ri2 – R2 /n where Ri2 is the sum of the squares of the rank sums, R2 is the square of the total rank sum and n is the number of treatments. Fr = 12/bt(t+1) * ∑Tj 2 – 3b(t + 1)  where b is the number of blocks, t is the number of treatments, and ∑Tj 2 is the sum of the squares of the rank sums.  Test the null hypothesis by comparing the test statistic with the chi-square critical value from the χ2 distribution table (if you used the first formula, find the equivalent in the Friedman statistics table).  To find the chi-square critical value mentioned above, subtract 1 from the number of treatments to get the number of degrees of freedom. Look up the chi- square value equivalent to the degrees of freedom and the significance level. Do this is you calculated the test statistic with the second formula.
  • 2.
     If Fris greater than or equal to the critical chi-square value/Friedman statistics table value found, the null hypothesis is dropped. EXAMPLE: A nutritionist compared three treatments of squash-malunggay-banana baby food preparations with the ingredients in different proportions. The three treatments were subjected to a sensory evaluation using four evaluators. The treatments were rated 1 to 4, 4 being the highest and best rating. Assume significance is 5%.  State the hypotheses: Ho = samples are from same-distribution populations, Ha = samples come from different-distribution populations.  Create a table first, then list down all the data. Then rank the data across blocks (in black) and find the sum (in red). BlockTreatment Treatment 1 Treatment 2 Treatment 3 Block 1 3 (1.5) 4 (3) 3 (1.5) Block 2 4 (3) 2 (1.5) 2 (1.5) Block 3 3 (1.5) 4 (3) 3 (1.5) Block 4 4 (3) 3 (2) 2 (1) ∑Rank 9 9.5 5.5  Compute for the Friedman test statistic. Fr = 12/bt(t+1) * ∑Tj 2 – 3b(t + 1) Fr = 12/(4)(3)(3+1) * ∑Tj 2 – 12(3 + 1) Fr = 12/(4)(3)(3+1) * ∑Tj 2 – 12(3 + 1) Fr = 12/(4)(3)(3+1) * (92 + 9.52 + 5.52 ) – 12(3 + 1) Fr = 2.375  Next, find the degrees of freedom. DOF = treatments – 1 = 3 – 1 = 2  Look for the chi-square value with DOF 2 and significance level 0.05 (5%). This is 5.991.  Compare the Fr and the chi-square value. Since Fr < 5.991, the null hypothesis is then true. OR  After constructing the table, use the formula S = ∑ Ri2 – R2 /n.
  • 3.
    S = ∑Ri2 – R2 /n S = (92 + 9.52 + 5.52 ) – (24) 2 /3 S = 9.5  Here, use n instead of degrees of freedom. , and significance is 0.05.  Look up the value of S5,3 and compare its value to S.  Since the calculated S-value is less than S5,3 (S5,3 = 37), then the null hypothesis is correct. HOW TO PERFORM A FRIEDMAN TEST IN EXCEL Note: You will need to install the Analyse-it toolbar for Microsoft Excel 2003/2007. The instructions shown here are for Microsoft Excel 2003. For help on using the toolbar on Excel 2007, refer to the documentation at: http://www.analyse- it.com/support/documentation/220/Welcome.htm Note: The Analyse-it toolbar has a limited trial of 30 days. Given this data set:  To perform the Friedman test, select the Analyse-it toolbar and drag the cursor to “Compare Pairs”. Then select “Friedman”. (NOTE: There must be a variable name across the blocks.)  Select everything when the window pops out by clicking on the green figures.
  • 4.
     It willdisplay a set of results for Friedman test.