Hypothesis testing
•Download as DOCX, PDF•
1 like•425 views

Basic Statistics Guidance by Professor Ireneo Ignacio

Recommended
More Related Content
What's hot
What's hot (20)
Viewers also liked
Viewers also liked (20)
Similar to Hypothesis testing
Similar to Hypothesis testing (20)
More from Denni Domingo
More from Denni Domingo (20)
Recently uploaded
Recently uploaded (20)
Hypothesis testing
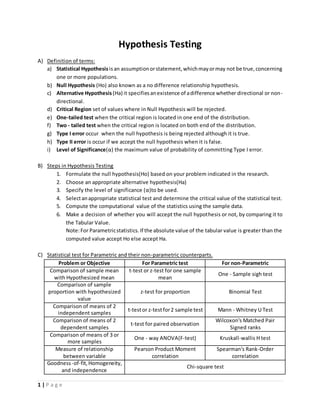
- 1. 1 | P a g e Hypothesis Testing A) Definition of terms: a) Statistical Hypothesis is an assumption or statement, which may or may not be true, concerning one or more populations. b) Null Hypothesis (Ho) also known as a no difference relationship hypothesis. c) Alternative Hypothesis (Ha) it specifies an existence of a difference whether directional or non-directional. d) Critical Region set of values where in Null Hypothesis will be rejected. e) One-tailed test when the critical region is located in one end of the distribution. f) Two - tailed test when the critical region is located on both end of the distribution. g) Type I error occur when the null hypothesis is being rejected although it is true. h) Type II error is occur if we accept the null hypothesis when it is false. i) Level of Significance(α) the maximum value of probability of committing Type I error. B) Steps in Hypothesis Testing 1. Formulate the null hypothesis(Ho) based on your problem indicated in the research. 2. Choose an appropriate alternative hypothesis(Ha) 3. Specify the level of significance (α)to be used. 4. Select an appropriate statistical test and determine the critical value of the statistical test. 5. Compute the computational value of the statistics using the sample data. 6. Make a decision of whether you will accept the null hypothesis or not, by comparing it to the Tabular Value. Note: For Parametric statistics. If the absolute value of the tabular value is greater than the computed value accept Ho else accept Ha. C) Statistical test for Parametric and their non-parametric counterparts. Problem or Objective For Parametric test For non-Parametric Comparison of sample mean with Hypothesized mean t-test or z-test for one sample mean One - Sample sigh test Comparison of sample proportion with hypothesized value z-test for proportion Binomial Test Comparison of means of 2 independent samples t-test or z-test for 2 sample test Mann - Whitney U Test Comparison of means of 2 dependent samples t-test for paired observation Wilcoxon's Matched Pair Signed ranks Comparison of means of 3 or more samples One - way ANOVA(F-test) Kruskall-wallis H test Measure of relationship between variable Pearson Product Moment correlation Spearman's Rank-Order correlation Goodness -of-fit, Homogeneity, and independence Chi-square test
- 2. D) Condition and assumption on using Parametric and Non - Parametric test. 2 | P a g e PARAMETRIC TEST NON-PARAMETRIC TEST For Small or Large sample size For small sample size For quantitative data (interval and ratio scale) For qualitative and quantitative data Must satisfy the normality of distribution May or may not satisfy the normality of distribution E) EXAMPLE AND SAMPLE PROBLEM: a) PROBLEM 1: To compare sample mean to the Hypothesized mean The researcher want to determine if there is a significant different in the cost of IPhone in SM Manila and in the suggested price of the IPhone which is P12,000. The following are the cost of an IPhone in 18 store in SM Manila. 9 12 18 14 12 14 12 10 16 11 9 11 13 11 13 15 13 14 Using One sample T-test T-Test 푡푐 = 푥̅− 휇 훿 √푛 − 1 푑푓 = 푛 − 1 ́ Z-test 푧푐 = 푥̅− 휇 휎 √푛 − 1 Since less than 30 we will used t-test 푡푐 = ̅1̅2̅̅.̅6̅1̅− 12 2.35 √18 − 1 = 1.07 Compare it with the tabular value 푡푡 = 2.11 using for a two-tailed test at 0.05 level of significance. Conclusion: the sample and hypothesized means are not significantly different, Accept 퐻표.
- 3. b) PROBLEM 2: Comparison of sample proportion with hypothesized value Two days after the Typhoon Yolanda, the Meralco says that 70% of all homes being served by their company is now enjoying electricity. To verify this claim, you randomly text 15 of your friends and you found out that only 8 of them already have electricity. Verify the claim of Meralco using 5% level of significance. Using z-test for sample proportion 3 | P a g e 푧푐 = 푝 − 푝표 √푝표푞표/푁 Where: 푝 = 푟푎푡푖표 표푓 푡ℎ푒 푠푎푚푝푙푒 푝표 = 푅푎푡푖표 표푓 푡ℎ푒 푝표푝푢푙푎푡푖표푛 푞표 = 1 − 푝표 Computiation: 푧푐 = 0.53 − 0.70 √(0.70)(.30)/15 = | − 1.44| c) PROBLEM 3: Comparison of means of 2 independent sample Determine if there is a significant difference between the score of student in College algebra Between engineering and non-engineering student. Consider the following score using 5% level of significance. Engineering Non-engineering 14 18 12 16 13 15 10 14 7 19 6 7 4 8 6 3 푛1 = 7 푛2 = 9 Using T-test for 2 independent sample t-test 푡푐 = ̅푥̅̅̅1−̅푥̅̅̅2 √푠1 2 푛1 + 푠2 2 푛2 푑푓 = 푛1 + 푛2 − 2 z-test 푧푐 = ̅푥̅̅1− ̅푥̅̅2 푠2 1 푛1 √ + 푠2 2 푛2 Since the sample is less than 30 we will use t-test
- 4. 4 | P a g e 푡푐 = 9.4 − 11.8 √14.6 7 + 33.9 9 =/−0.932/ Compare is wit the tabular value(2.624) using t table for a one tailed test at 0.01 level of significance. Conclusion: Two sample are not significant between the mean of eat group. d) PROBLEM 4: Comparison of means of 2 dependent samples To eliminate/lessen the human error on the production of a certain product, the company resented a new system. In order to determine the effectiveness of the new method over the other , the company conducted a study based on the number of defective product a certain brand before using the old strategy and 2 months after doing the new marketing strategy. Determine the effectiveness of the new marketing using 0.05 level of significance. before After 2 months Difference (d) 16 4 12 12 18 -6 22 10 12 16 14 2 14 12 2 10 14 -4 20 10 10 18 12 6 10 4 6 22 12 10 total 50 Using T-test for paired obsevations 푡푐 = Σ 푑 √푛 Σ 푑 2 − (Σ 푑)2 푛 − 1 푑푓 = 푛 − 1 푡푐 = 50 √10(620) − (50)2 10 − 1 = 2.47 Compare this with the tabular value (1.833) using the t-distribution table for one tailed test at 0.05 level of significance. Conclusion: The second method is significantly lesser compare to the previous method. e) PROBLEM 5: Comparison of means of 3 or more samples f) PROBLEM 6: Measure of relationship between variable g) PROBLEM 7: Goodness -of-fit, Homogeneity, and independence