Q1 2015 Austin Industrial Market Report

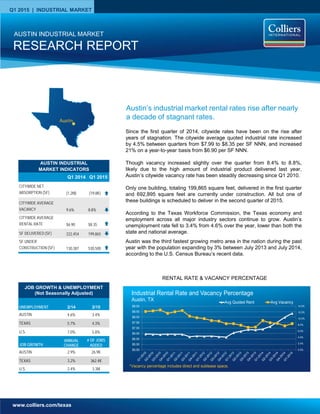
Austin’s industrial market rental rates rise after nearly a decade of stagnant rates. Since the first quarter of 2014, citywide rates have been on the rise after years of stagnation. The citywide average quoted industrial rate increased by 4.5% between quarters from $7.99 to $8.35 per SF NNN, and increased 21% on a year-to-year basis from $6.90 per SF NNN. Though vacancy increased slightly over the quarter from 8.4% to 8.8%, likely due to the high amount of industrial product delivered last year, Austin’s citywide vacancy rate has been steadily decreasing since Q1 2010. Only one building, totaling 199,865 square feet, delivered in the first quarter and 692,895 square feet are currently under construction. All but one of these buildings is scheduled to deliver in the second quarter of 2015. According to the Texas Workforce Commission, the Texas economy and employment across all major industry sectors continue to grow. Austin’s unemployment rate fell to 3.4% from 4.6% over the year, lower than both the state and national average. Austin was the third fastest growing metro area in the nation during the past year with the population expanding by 3% between July 2013 and July 2014, according to the U.S. Census Bureau’s recent data.

Recommended
Recommended
More Related Content
What's hot
What's hot (20)
Viewers also liked
Viewers also liked (18)
Similar to Q1 2015 Austin Industrial Market Report
Similar to Q1 2015 Austin Industrial Market Report (20)
More from Colliers International | Houston
More from Colliers International | Houston (20)
Recently uploaded
Recently uploaded (20)
Q1 2015 Austin Industrial Market Report
- 1. www.colliers.com/texas Q1 2015 | INDUSTRIAL MARKET Since the first quarter of 2014, citywide rates have been on the rise after years of stagnation. The citywide average quoted industrial rate increased by 4.5% between quarters from $7.99 to $8.35 per SF NNN, and increased 21% on a year-to-year basis from $6.90 per SF NNN. Though vacancy increased slightly over the quarter from 8.4% to 8.8%, likely due to the high amount of industrial product delivered last year, Austin’s citywide vacancy rate has been steadily decreasing since Q1 2010. Only one building, totaling 199,865 square feet, delivered in the first quarter and 692,895 square feet are currently under construction. All but one of these buildings is scheduled to deliver in the second quarter of 2015. According to the Texas Workforce Commission, the Texas economy and employment across all major industry sectors continue to grow. Austin’s unemployment rate fell to 3.4% from 4.6% over the year, lower than both the state and national average. Austin was the third fastest growing metro area in the nation during the past year with the population expanding by 3% between July 2013 and July 2014, according to the U.S. Census Bureau’s recent data. RESEARCH REPORT AUSTIN INDUSTRIAL MARKET RENTAL RATE & VACANCY PERCENTAGE Austin’s industrial market rental rates rise after nearly a decade of stagnant rates. AUSTIN INDUSTRIAL MARKET INDICATORS Q1 2014 Q1 2015 CITYWIDE NET ABSORPTION (SF) (1.2M) (19.8K) CITYWIDE AVERAGE VACANCY 9.6% 8.8% CITYWIDE AVERAGE RENTAL RATE $6.90 $8.35 SF DELIVERED (SF) 222,454 199,865 SF UNDER CONSTRUCTION (SF) 130,387 530,500 UNEMPLOYMENT 2/14 2/15 AUSTIN 4.6% 3.4% TEXAS 5.7% 4.3% U.S. 7.0% 5.8% JOB GROWTH ANNUAL CHANGE # OF JOBS ADDED AUSTIN 2.9% 26.9K TEXAS 3.2% 362.4K U.S. 2.4% 3.3M JOB GROWTH & UNEMPLOYMENT (Not Seasonally Adjusted) 0.0% 2.0% 4.0% 6.0% 8.0% 10.0% 12.0% 14.0% $5.00 $5.50 $6.00 $6.50 $7.00 $7.50 $8.00 $8.50 $9.00 Industrial Rental Rate and Vacancy Percentage Austin, TX Avg Quoted Rent Avg Vacancy *Vacancy percentage includes direct and sublease space.
- 2. RESEARCH REPORT | Q1 2015 | AUSTIN INDUSTRIAL MARKET COLLIERS INTERNATIONAL | P.2 Vacancy & Availability Austin’s average industrial vacancy rate rose by 40 basis points over the quarter from 8.4% to 8.8%. However, since the first quarter of 2014, vacancy has decreased from 9.6%. At the end of the first quarter, Austin had 5.9M SF of vacant industrial space. Among the major industrial submarkets, the Southwest submarket has the lowest vacancy rate at 1.7%, followed by the South submarket at 2.7% and then the East submarket at 4.2% vacancy. The largest concentration of vacancy was located in the Round Rock submarket, with a 17.6% vacancy rate. Austin’s industrial construction pipeline had 692,895 SF of projects underway at the end of the first quarter, the majority of them being spec development. The Southeast submarket saw the largest volume of buildings under construction with 399,205 SF underway at Met Center Building 3 and Expo Park buildings 10 and 11. A list of buildings currently under construction can be found on page 3 of this report. Rental Rates According to CoStar, our data service provider, the citywide average quoted industrial rental rate increased by 4.5% between quarters from $7.99 to $8.35 per SF NNN, and increased 21% on a year-to-year basis from $6.90 per SF NNN. Average rental rates in the Southwest submarket were quoted at $14.13 per SF NNN at the end of the first quarter and have increased by 1.7% since Q4, and by 6.9% from $13.21 per SF NNN since the first quarter of last year. After the Southwest submarket, the highest rental rates at the end of the first quarter were in the East submarket at $13.39 per SF NNN. Rental rates in the East submarket have increased by 30% quarter-over- quarter and 145% over the year from $5.46. Vacancy rates in the East submarket were at 4.1% at the end of the first quarter and have been steadily decreasing since 2011. The submarket with the lowest rental rates was Hays County who quoted an average rate of $5.69 per SF NNN at the end of the first quarter. This was most likely due to the high volume of available sublet space. Absorption & Demand Austin’s industrial market posted 19,898 SF of negative net absorption in the first quarter. The Southeast submarket contributed the largest amount with 387,327 SF of negative net absorption. The Far Northeast submarket saw the highest level of positive net absorption, contributing 327,702 SF. Leasing Austin’s industrial leasing activity, which includes renewals, reached 228K SF in the first quarter. The largest lease occurred in the Northwest submarket where Marquee Event Group signed a lease for 101,190 SF of warehouse space at Northtech Business Center 4. A list of select first quarter industrial lease transactions are included in the table below. Q1 2015 Top Industrial Leases Building Name/Address Submarket SF Tenant Lease Date NorthTech Business Center 4 Northwest 101,190 Marquee Event Group Jan-15 SouthTech 3 - 2101 E. St. Elmo Road Southeast 42,504 U.S. General Services Administration / Internal Revenue Service1 Feb-15 3206 Industrial Drive North 27,830 Greg Smith Equipment Sales Inc.1 Feb-15 2300 Grand Avenue Parkway North 22,100 United Auto Parts1 Feb-15 2251 Picadilly Drive Far Northeast 20,132 Mach 1 Global Services Inc. Jan-15 3500 Wadley Place North 14,738 Drilling Info Inc. Feb-15
- 3. RESEARCH REPORT | Q1 2015 | AUSTIN INDUSTRIAL MARKET COLLIERS INTERNATIONAL | P.3 Austin Industrial Market Summary Sales Activity Q1 2015 No. of Properties: 32 Total SF: 2.8M Average $/SF: $58 Average Cap Rate: Unknown IndCor Properties sold 117M SF and $8.1 billion worth of industrial space across the U.S. to Global Logistics Properties, Singapore’s sovereign- wealth fund. Twenty-eight of these industrial properties are in the Austin market totaling 2.4M SF and $145M. Sources: Real Capital Analytics; CoStar Comps IndCor Properties Portfolio Zydeco Development sold Austin Data Center III to CyrusOne, LLC. The 172,800 SF data center was sold for an undisclosed amount on February 19. Met Center - Austin Data Center III Market # Bldgs Rentable Area Direct Vacant SF Direct Vacancy Rate Sublet Vacant SF Sublet Vacancy Rate Total Vacant SF Total Vacancy Rate 1Q15 Net Absorption 4Q14 Net Absorption 1Q15 Completions 4Q14 Completions SF Under Construction Austin Total 952 67,272,810 5,469,967 8.1% 440,153 0.7% 5,910,120 8.8% (19,898) 598,933 199,865 154,887 692,895 Central 38 1,350,797 84,281 6.2% 7,374 0.5% 91,655 6.8% (934) 18,175 - - East 90 4,788,283 195,917 4.1% 5,000 0.1% 200,917 4.2% (20,458) 25,193 Far Northeast 46 2,835,764 464,776 16.4% - 0.0% 464,776 16.4% 327,702 (24,374) 199,865 - Far Northwest 20 931,495 79,154 8.5% - 0.0% 79,154 8.5% 3,775 3,200 - - - Hays County 48 3,434,953 130,828 3.8% 219,574 6.4% 350,402 10.2% 5,000 84,800 - 45,000 162,470 North 239 15,242,940 1,161,536 7.6% 83,285 0.5% 1,244,821 8.2% 39,268 228,652 - 109,887 - Northeast 133 12,603,385 1,336,076 10.6% 28,500 0.2% 1,364,576 10.8% 38,253 248,520 - - 110,100 Northwest 38 4,750,169 205,117 4.3% 11,084 0.2% 216,201 4.6% (23,978) (13,453) - - - Round Rock 53 2,967,958 522,106 17.6% - 0.0% 522,106 17.6% 13,946 3,004 - - - South 52 2,558,326 58,311 2.3% 11,437 0.4% 69,748 2.7% (2,835) 18,198 - - - Southeast 183 12,801,662 1,189,321 9.3% 66,399 0.5% 1,255,720 9.8% (387,327) (29,678) - - 420,325 Southwest 12 3,007,078 42,544 1.4% 7,500 0.2% 50,044 1.7% (12,310) 36,696 - - AUSTIN INDUSTRIAL MARKET STATISTICAL SUMMARY Q1 2015 Building Address Submarket Name RBA % Leased Developer Estimated Delivery Date Building Description 7000 Metropolis Dr. Southeast Ind 160,000 0.0% Zydeco Development Oct-15 Flex 6301 E Stassney Ln - Expo 11 Southeast Ind 130,002 0.0% Unknown Jun-15 Industrial Warehouse 6301 E Stassney Ln - Expo 10 Southeast Ind 109,203 0.0% Unknown Jun-15 Industrial Warehouse 1600 Clovis Barker Rd - Bldg 4 Hays County Ind 94,800 0.0% Bearden Investments May-15 Industrial Warehouse 8024 Exchange Dr Northeast Ind 89,600 0.0% McShane Devlopment Co. May-15 Distribution 1600 Clovis Barker Rd - Bldg 3 Hays County Ind 67,670 0.0% Bearden Investments May-15 Industrial Warehouse 4200 Burch Dr - Bldg A Southeast Ind 21,120 1.5% Sterling Howry May-15 Industrial Warehouse 9503 Brown Ln - Bldg 4 Northeast Ind 20,500 100.0% Dalton Apr-15 BTS Q1 2015 Industrial Under Construction – 20,000 SF or greater
- 4. RESEARCH REPORT | Q1 2015 | AUSTIN INDUSTRIAL MARKET Accelerating success. COLLIERS INTERNATIONAL 1233 W. Loop South Suite 900 Houston, Texas 77027 Main +1 713 222 2111 HANNAH TYSOR Marketing & Research Coordinator | Houston Direct +1 713 830 2192 hannah.tysor@colliers.com The Colliers Advantage Enterprising Culture Colliers International is a leader in global real estate services, defined by our spirit of enterprise. Through a culture of service excellence and a shared sense of initiative, we integrate the resources of real estate specialists worldwide to accelerate the success of our partners. When you choose to work with Colliers, you choose to work with the best. In addition to being highly skilled experts in their field, our people are passionate about what they do. And they know we are invested in their success just as much as we are in our clients’ success. This is evident throughout our platform—from Colliers University, our proprietary education and professional development platform, to our client engagement strategy that encourages cross-functional service integration, to our culture of caring. We connect through a shared set of values that shape a collaborative environment throughout our organization that is unsurpassed in the industry. That’s why we attract top recruits and have one of the highest retention rates in the industry. Colliers International has also been recognized as one of the “best places to work” by top business organizations in many of our markets across the globe. Colliers International offers a comprehensive portfolio of real estate services to occupiers, owners and investors on a local, regional, national and international basis. *Information herein has been obtained from sources deemed reliable, however its accuracy cannot be guaranteed. COLLIERS INTERNATIONAL | P. 4