FNB May Building Statistics (Jul 2019)
•
0 likes•29 views

FNB May Building Statistics (Jul 2019)

Recommended
Recommended
More Related Content
What's hot
What's hot (15)
Similar to FNB May Building Statistics (Jul 2019)
Similar to FNB May Building Statistics (Jul 2019) (20)
More from Berty Van Staaden
More from Berty Van Staaden (20)
Recently uploaded
Recently uploaded (20)
FNB May Building Statistics (Jul 2019)
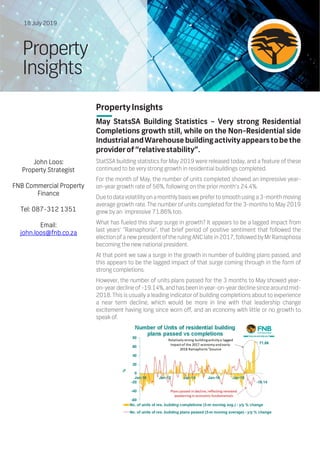
- 1. PropertyInsights May StatsSA Building Statistics – Very strong Residential Completions growth still, while on the Non-Residential side IndustrialandWarehouse buildingactivityappearstobethe providerof“relativestability”. StatSSA building statistics for May 2019 were released today, and a feature of these continued to be very strong growth in residential buildings completed. For the month of May, the number of units completed showed an impressive year- on-year growth rate of 56%, following on the prior month’s 24.4%. Due to data volatility on amonthly basis we prefer to smooth using a 3-month moving average growth rate. The number of units completed for the 3-months to May 2019 grew by an impressive 71.86% too. What has fueled this sharp surge in growth? It appears to be a lagged impact from last years’ ‘‘Ramaphoria’’, that brief period of positive sentiment that followed the election of a new presidentof the ruling ANC late in 2017, followed by Mr Ramaphosa becoming the new national president. At that point we saw a surge in the growth in number of building plans passed, and this appears to be the lagged impact of that surge coming through in the form of strong completions. However, the number of units plans passed for the 3 months to May showed year- on-year decline of -19.14%, and has been in year-on-year decline since around mid- 2018. This is usually a leading indicator of building completions about to experience a near term decline, which would be more in line with that leadership change excitement having long since worn off, and an economy with little or no growth to speak of. 18 July 2019 Property Insights John Loos: Property Strategist FNB Commercial Property Finance Tel: 087-312 1351 Email: john.loos@fnb.co.za
- 2. 2 Non-ResidentialBuildingActivity On the non-residential side, we have seen surprisingly strong completions growth in the area of Office Space, despite very significant increase in recent years in this category’s national vacancy rate. On a monthly basis for May, square metres of office space completed recorded very strong year-on-year growth of 207.7%, industrial and warehouse space an also strong 133.2%, while Retail recorded a slight decline of -1.4%. However, due to the highly volatile nature of commercial building completions, with one major project able to influence monthly stats hugely, we prefer to use a 12-month moving average year-on- year growth rate to smooth the data and make better sense of it. OfficeSpacecompletionssetforslowdown For the 12 months to May 2019, the year-on-year growth was +20.23%% for Office Space square metres completed. This still seems surprisingly strong given that the national office vacancy rate has risen considerably in recent years according to MSCI data. But Office Space completions look set for near term slowdown, with the square meterage of plans passed for this category over the past 12 months less than half the level around 2014, and the 12 months to May’s plans passed showing year-on-year decline of -18.94% Retail Space square meterage completed declined sharply by -43.29% year-on-year for the 12-months to May, which was to be expected given the pressures that have been mounting on retail over recent years, in the form of online shopping and more significantly a financially strained consumer. And square meterage of Retail Space plans passed shows more weakness to come, with the 12 month average showing year-on-year decline of --44.92% Finally, the seemingly best of the sectors, Industrial and Warehouse Space completed grew slightly positively by +0.94% using the 12 months average to May. And its plans passed number suggests some semblance of near term stability, also growing slightly positively to the tune of +2.64% Conclusion The Industrial and Warehouse Property Market, while also pressured by a weak economy, has been the best performing major property sector in recent times, and its new building activity looks set to remain reasonably stable, judging by plans passed. However, for the rest, the Office Market has seen rising vacancies for some time, according to MSCI data, while Retail too has been under pressure due to an increasingly constrained consumer. These 2 non-residential sectors, along with residential where plans passed are also in decline, look set to see building completion levels decline in the near term Disclaimer AdivisionofFirstRandBankLimited. An Authorised Financial Services and Credit Provider (NCRCP20). Disclaimer: The information in this publication is derived from sources which are regarded as accurate and reliable, is of a general nature only, does not constitute advice and may not be applicable to all circumstances. Detailed advice should be obtained in individual cases. No responsibility for any error, omission or loss sustained by any person acting or refraining from acting as a result of this publication isaccepted by FirstRand GroupLimitedand/ orthe authors of the material. 669 568 1 006 886 494 003 0 300000 600000 900000 1200000 1500000 Jan-00 Jan-03 Jan-06 Jan-09 Jan-12 Jan-15 Jan-18 squaremetres Office Space Completed vs Passed Square metres of office space completed - 12-m moving total Square metres of office space passed - 12-m moving total 980 517 510 983 1 647 124 498 014 0 500000 1000000 1500000 2000000 Jan-00 Jan-03 Jan-06 Jan-09 Jan-12 Jan-15 Jan-18 squaremetres Retail Space Completed vs Passed Square metres of Retail space completed - 12-m moving total Square metres of Retail space passed - 12-m moving total 1 181 488 1 919 667 0 500000 1000000 1500000 2000000 2500000 Jan-00 Jan-03 Jan-06 Jan-09 Jan-12 Jan-15 Jan-18 squaremetres Industrial and warehouse Space Completed vs Passed Square metres of industrial and warehouse space completed - 12-m moving total Square metres of industrial and warehouse space passed - 12-m moving total
- 3. Residential Buildings 2016 2017 2018 Q3-2018 Q4-2018 Q1-2019 Mar-19 Apr-19 May-19 Dwelling houses less than 80 m.sq (Number) 17 318 20 286 16 673 4 263 2 570 2 202 935 917 1 105 Y/Y % change -24.0 17.1 -17.8 3.9 -58.2 -58.7 -50.7 -30.4 -49.9 Dwelling houses less than 80 m.sq (m2 ) 837 353 985 380 803 258 210 393 132 572 112 854 45 977 46 043 53 007 Y/Y % change -23.1 17.7 -18.5 4.8 -57.2 -53.4 -45.2 -30.2 -46.7 Dwelling houses less than 80 m.sq (R'000) 4 014 458 4 807 073 4 443 401 1 197 791 779 552 647 308 261 616 257 883 300 705 Y/Y % change 1.7 19.7 -7.6 17.4 -47.5 -46.3 -38.2 -34.5 -44.5 Dwelling houses larger than 80 m.sq (Number) 15 899 15 312 15 049 3 976 3 818 2 915 998 1 131 1 157 Y/Y % change -6.4 -3.7 -1.7 -6.8 1.1 -15.8 -22.8 -2.1 -10.6 Dwelling houses larger than 80 m.sq (m2 ) 4 344 535 4 112 272 3 987 119 1 107 777 985 345 786 976 273 464 313 220 323 956 Y/Y % change -6.0 -5.3 -3.0 -3.5 -1.2 -13.8 -16.0 4.7 -5.8 Dwelling houses larger than 80 m.sq (R'000) 29 339 581 28 837 971 28 684 790 8 046 647 7 084 823 5 762 948 1 977 957 2 303 010 2 346 813 Y/Y % change -2.0 -1.7 -0.5 -1.4 -1.1 -12.4 -16.8 6.7 -2.4 Flats and Townhouses (Number) 23 021 22 753 26 369 7 205 6 022 7 263 1 862 2 236 1 818 Y/Y % change 13.9 -1.2 15.9 22.0 -4.4 10.9 37.3 -3.5 -17.6 Flats and Townhouses (m2 ) 2 379 301 2 665 208 2 767 756 773 596 648 633 779 390 166 509 192 080 202 660 Y/Y % change 16.2 12.0 3.8 6.3 6.3 31.8 -0.9 -38.1 -31.4 Flats and Townhouses (R'000) 19 274 352 21 234 962 22 757 332 6 881 367 5 463 611 6 703 185 1 468 206 1 503 838 1 726 870 Y/Y % change 26.1 10.2 7.2 15.0 7.2 53.4 4.5 -39.3 -27.0 Total units plans passed (Number) 56 238 58 351 58 091 15 444 12 410 12 380 3 795 4 284 4 080 Y/Y % change -6.2 3.8 -0.4 8.2 -23.5 -19.3 -16.5 -10.6 -28.5 Total building plans passed (m2 ) 7 561 189 7 762 860 7 558 133 2 091 766 1 766 550 1 679 220 485 950 551 343 579 623 Y/Y % change -2.5 2.7 -2.6 0.7 -7.8 -3.8 -15.8 -18.3 -21.6 Other Residential Buildings (m2 ) 247 825 105 208 163 811 19 829 13 137 23 665 1 785 28 382 5 854 Y/Y % change 45.4 -57.5 55.7 12.9 -73.4 -36.7 -93.8 -42.4 -83.3 Other Residential Buildings (R 000) 2 232 511 869 947 1 599 498 172 692 81 404 184 225 13 816 211 667 30 705 Y/Y % change 66.9 -61.0 83.9 40.3 -82.7 -42.5 -94.9 -64.9 -91.2 Total Residential Buildings (R 000) 54 860 902 55 749 953 57 485 021 16 298 497 13 409 390 13 297 666 3 721 595 4 276 398 4 405 093 Y/Y % change 8.6 1.6 3.1 6.6 -5.7 6.6 -16.8 -24.1 -22.2 Additions and Alterations Dwelling houses (m2 ) 3 031 820 2 984 582 2 861 570 739 452 719 702 621 949 215 489 226 731 263 847 Y/Y % change -3.3 -1.6 -4.1 -9.4 -4.5 -4.4 -11.6 3.5 8.1 Dwelling houses (R'000) 20 092 691 21 172 380 20 895 192 5 497 985 5 298 042 4 731 749 1 638 526 1 688 150 1 938 576 Y/Y % change 4.9 5.4 -1.3 -7.3 -3.5 1.2 -7.9 6.7 9.2 Building Plans Passed
- 4. 2016 2017 2018 Q3-2018 Q4-2018 Q1-2019 Mar-19 Apr-19 May-19 Non-Residential Buildings Office space (m2 ) 686 258 623 308 538 000 79 223 165 542 140 474 68 929 39 862 26 775 Y/Y % change -4.0 -9.2 -13.7 9.0 50.2 -19.1 410.4 -20.4 -27.2 Office space (R 000) 6120 152 5854 945 5106 821 684 749 1678 728 1236 067 601 214 391 435 223 423 Y/Y % change 5.7 -4.3 -12.8 -4.6 53.3 -28.0 510.3 -13.9 -33.4 Shopping space (m2 ) 1149 822 868 633 537 829 153 816 80 015 156 289 28 845 17 317 52 685 Y/Y % change 0.7 -24.5 -38.1 -8.6 -80.4 -2.8 -35.6 -67.8 16.0 Shopping space (R 000) 9196 687 7581 554 4413 154 1339 214 691 459 1177 988 219 401 128 828 343 868 Y/Y % change 9.4 -17.6 -41.8 -5.9 -81.7 -2.7 -37.7 -72.2 -8.6 Industrial and warehouse space (m2 ) 1880 399 1858 621 1922 845 565 860 465 327 368 042 131 960 151 174 141 786 Y/Y % change 30.4 -1.2 3.5 -12.4 5.4 -8.8 -17.5 53.9 -16.5 Industrial and warehouse space (R 000) 10426 469 11240 075 11705 990 3549 382 2818 354 2274 384 829 758 925 423 928 390 Y/Y % change 38.0 7.8 4.1 -8.7 -1.8 -7.8 -14.9 61.3 -8.4 Other non-residential space (m2 ) 597 149 491 897 512 349 193 401 93 315 168 774 88 607 92 371 21 498 Y/Y % change 20.7 -17.6 4.2 6.9 5.1 38.9 141.8 127.5 -18.4 Other Non-Residential Space (R 000) 3988 671 3473 729 3589 933 1293 364 648 997 1245 129 669 885 645 730 158 126 Y/Y % change 37.4 -12.9 3.3 -1.7 4.1 34.2 153.8 132.2 -13.0 Total Non-Residential Buildings (R 000) 29731 979 28150 303 24815 898 6866 709 5837 538 5933 568 2320 258 2091 416 1653 807 Y/Y % change 20.6 -5.3 -11.8 -6.5 -30.2 -6.2 37.3 18.2 -13.3 Additions and Alterations Other Buildings (m2 ) 777 655 812 021 908 064 200 555 237 505 163 453 69 179 59 568 63 039 Y/Y % change -15.2 4.4 11.8 -9.2 3.5 -33.8 -20.2 -2.4 -29.9 Other Buildings (R'000) 7247 135 8091 152 8709 561 2172 889 2336 002 1814 039 670 816 785 635 702 689 Y/Y % change -0.6 11.6 7.6 -8.0 2.8 -20.6 -13.0 35.3 0.1 All Construction Types (R'000) 27339 826 29263 532 29604 753 7670 874 7634 044 6545 788 2309 342 2473 785 2641 265 Y/Y % change 3.4 7.0 1.2 -7.5 -1.6 -5.9 -9.4 14.4 6.7 Total Building Plans Passed All construction types (R 000) 111932 707 113163 788 111905 672 30836 080 26880 972 25777 022 8351 195 8841 599 8700 165 Y/Y % change 10.2 1.1 -1.1 -0.3 -11.4 0.1 -4.1 -7.6 -13.4 Building Plans Passed
- 5. Residential Buildings 2016 2017 2018 Q3-2018 Q4-2018 Q1-2019 Mar-19 Apr-19 May-19 Dwelling houses less than 80 m.sq (Number) 15 562 14 164 11 662 3 293 3 617 2 247 1 050 962 608 Y/Y % change -2.8 -9.0 -17.7 8.1 21.2 4.9 37.8 16.3 -24.6 Dwelling houses less than 80 m.sq (m2 ) 754 023 693 713 591 930 167 706 185 128 111 715 50 230 47 026 32 946 Y/Y % change -4.7 -8.0 -14.7 9.1 20.9 7.8 31.2 13.5 -24.0 Dwelling houses less than 80 m.sq (R'000) 3 344 829 3 359 677 3 427 017 1 023 237 1 045 346 635 877 276 018 250 732 191 961 Y/Y % change 9.3 0.4 2.0 32.3 28.5 11.9 30.1 9.1 -26.5 Dwelling houses larger than 80 m.sq (Number) 12 234 10 802 10 715 2 776 3 229 2 604 993 781 879 Y/Y % change 0.6 -11.7 -0.8 7.3 -4.8 18.4 34.7 3.9 -4.4 Dwelling houses larger than 80 m.sq (m2 ) 3 066 515 2 871 035 2 693 756 688 278 783 302 630 957 242 696 231 387 242 265 Y/Y % change -2.9 -6.4 -6.2 3.2 -11.2 11.0 31.7 21.3 2.4 Dwelling houses larger than 80 m.sq (R'000) 20 495 247 20 595 050 19 828 485 5 161 781 5 777 084 4 792 475 1 832 853 1 726 504 1 781 943 Y/Y % change 1.7 0.5 -3.7 6.5 -9.2 14.8 35.4 21.0 7.2 Flats and Townhouses (Number) 13 731 14 048 17 825 4 990 5 701 7 064 3 747 1 961 2 766 Y/Y % change 19.5 2.3 26.9 61.6 53.8 91.2 371.3 40.2 176.0 Flats and Townhouses (m2 ) 1 374 532 1 539 872 2 562 728 758 420 787 414 819 917 400 372 251 310 390 542 Y/Y % change 16.9 12.0 66.4 106.4 68.0 80.5 185.4 20.9 137.5 Flats and Townhouses (R'000) 10 533 470 12 573 629 20 534 729 6 226 963 6 364 875 6 777 636 3 337 921 2 136 545 3 270 006 Y/Y % change 24.2 19.4 63.3 106.1 62.4 90.8 207.7 27.7 157.9 Total units completed (Number) 41 527 39 014 40 202 11 059 12 547 11 915 5 790 3 704 4 253 Y/Y % change 4.7 -6.1 3.0 26.8 24.4 48.3 152.4 24.4 56.0 Total building space completed (m2 ) 5 195 070 5 104 620 5 848 414 1 614 404 1 755 844 1 562 589 693 298 529 723 665 753 Y/Y % change 1.4 -1.7 14.6 35.9 16.7 38.8 91.1 20.4 49.8 Other Residential Buildings (m2 ) 70 248 241 568 91 649 16 494 38 238 16 719 2 012 25 179 - Y/Y % change -4.0 243.9 -62.1 -27.2 686.8 -40.4 -91.1 206.6 #N/A Other Residential Buildings (R 000) 605 536 2 300 250 674 838 159 693 253 183 131 173 12 480 214 277 - Y/Y % change 22.9 279.9 -70.7 -14.5 344.7 -38.3 -92.8 377.6 #N/A Total Residential Buildings (R 000) 34 979 082 38 828 606 44 465 069 12 571 674 13 440 488 12 337 161 5 459 272 4 328 058 5 243 910 Y/Y % change 8.7 11.0 14.5 42.4 20.5 45.0 93.3 28.3 64.3 Additions and Alterations Dwelling houses (m2 ) 1 225 317 1 173 145 1 102 698 301 618 260 962 238 143 82 055 79 877 92 865 Y/Y % change 5.6 -4.3 -6.0 -11.9 0.3 -15.5 -5.7 -0.3 9.0 Dwelling houses (R'000) 7 252 702 7 700 616 7 994 921 2 228 507 1 895 727 1 802 850 628 852 587 182 673 950 Y/Y % change 12.4 6.2 3.8 -4.6 4.2 -9.0 0.1 -4.8 12.0 Buildings Completed
- 6. 2016 2017 2018 Q3-2018 Q4-2018 Q1-2019 Mar-19 Apr-19 May-19 Non-Residential Buildings Office space (m2 ) 504 926 626 059 616 052 202 787 110 330 96 770 8 087 28 740 136 521 Y/Y % change -16.5 24.0 -1.6 266.0 -54.4 -28.7 -77.6 1.2 207.7 Office space (R 000) 4143 021 5800 292 5762 733 1956 833 997 597 979 610 64 883 208 233 1419 148 Y/Y % change -11.8 40.0 -0.6 300.6 -56.9 -22.0 -78.3 -5.7 213.9 Shopping space (m2 ) 516 164 967 611 334 340 79 645 99 654 200 663 60 977 53 116 73 492 Y/Y % change -5.4 87.5 -65.4 -74.7 -58.0 280.2 103.1 127.7 -1.4 Shopping space (R 000) 4045 022 8307 719 2728 510 655 465 770 218 1895 846 577 132 503 912 697 226 Y/Y % change 9.0 105.4 -67.2 -79.3 -58.7 353.7 146.1 163.6 6.5 Industrial and warehouse space (m2 ) 1077 824 1151 206 1111 757 386 176 239 550 272 114 88 831 84 350 116 982 Y/Y % change 8.4 6.8 -3.4 2.5 -16.5 10.5 27.4 -21.5 133.2 Industrial and warehouse space (R 000) 5859 837 6678 914 6574 273 2291 443 1455 676 1682 586 571 885 536 584 765 322 Y/Y % change 14.3 14.0 -1.6 -1.2 -11.0 20.5 34.2 -18.6 161.3 Other non-residential space (m2 ) 307 146 271 584 219 933 50 475 88 155 165 554 24 861 55 040 27 709 Y/Y % change 67.3 -11.6 -19.0 -24.9 -22.0 314.7 134.3 177.8 135.9 Other Non-Residential Space (R 000) 1907 427 2150 878 1568 558 353 369 622 605 1149 380 206 563 374 965 241 696 Y/Y % change 63.4 12.8 -27.1 -27.6 -36.2 277.8 143.5 178.7 227.3 Total Non-Residential Buildings (R 000) 15955 307 22937 803 16634 074 5257 110 3846 096 5707 422 1420 463 1623 694 3123 392 Y/Y % change 8.6 43.8 -27.5 -18.6 -43.3 69.2 36.0 34.6 112.0 Additions and Alterations Other Buildings (m2 ) 376 880 397 407 454 099 133 176 118 227 127 712 75 617 44 743 38 346 Y/Y % change -12.6 5.4 14.3 35.9 4.8 27.5 62.0 44.7 24.2 Other Buildings (R'000) 3230 146 3903 358 4322 238 1271 151 1192 930 1383 598 861 344 439 626 364 494 Y/Y % change -3.5 20.8 10.7 41.5 7.3 48.1 95.7 60.6 20.8 All Construction Types (R'000) 10482 848 11603 974 12317 159 3499 658 3088 657 3186 448 1490 196 1026 808 1038 444 Y/Y % change 7.0 10.7 6.1 8.2 5.4 9.3 39.5 15.3 14.9 Total Buildings Completed All construction types (R 000) 61417 237 73370 383 73416 302 21328 442 20375 241 21231 031 8369 931 6978 560 9405 746 Y/Y % change 8.3 19.5 0.1 15.1 -2.4 43.5 69.5 27.6 68.9 Buildings Completed