SlideShare a Scribd company logo
1 of 4
Download to read offline
Austin’s industrial rates reach new heights
Research &
Forecast Report
AUSTIN | INDUSTRIAL
Q2 2016
Kaitlin Holm Research and Marketing Coordinator | Austin
Austin’s industrial market construction slipped a little, but the asking
rates aren’t falling. The vacancy rate saw a slight drop and the net
absorption saw a large positive increase over the quarter. Citywide
average vacancy fell to 7.1% over the quarter and positive net
absorption reached 141,773 square feet, and industrial space under
construction decreased only by 9,500 square feet in the second
quarter. Some of the asking rates for the Austin market are at an all
time high.
Austin’s citywide average rental rates increased over the quarter from
$9.56 per SF NNN to $9.81 per SF NNN, the highest it has ever been.
Citywide Flex/R&D rental rates slightly decreased to $11.30 per SF
NNN, while this quarter’s Warehouse/Distribution rental rates are also
the highest they have ever been, at $7.63 per SF NNN.
The only major building that delivered in Q2 2016 was Met Center
12, a 72,000 square foot building in the Southeast submarket. In Q2,
1,787,440 square feet of industrial supply was under construction,
including two new projects totaling 110,715 square feet. One of the
projects is a 62,500 square foot building at 7307 Burleson in the
Southeast submarket.
As the population continues to increase, Austin’s unemployment rate
has dropped from 3.5% to 2.9% over the past year, and also added
3.7K jobs out of the 169.4K jobs created within Texas. Over the last
quarter, Austin’s unemployment rate has decreased from 3.3% to
2.9% over the last quarter.
Summary Statistics
Austin Industrial Market Q2 2015 Q1 2016 Q2 2016
Vacancy Rate 8.3% 7.3% 7.1%
Net Absorption (SF) 983,141 -42,578 141,773
New Construction (SF) 207,008 173,500 72,000
Under Construction (SF) 645,000 1,796,940 1,644,600
Asking Rents
Per Square Foot Per Year
Average $8.98 $9.56 $9.81
Warehouse/Distribution $6.50 $7.41 $7.63
Flex/R&D $11.52 $11.32 $11.30
Market Indicators
Relative to prior period
Annual
Change
Quarterly
Change
Quarterly
Forecast*
VACANCY
NET ABSORPTION
NEW CONSTRUCTION
UNDER CONSTRUCTION
*Projected
Mothers Milk Bank of Austin, Inc. purchased
the 30,000 SF industrial warehouse from
Reid Buildings of Austin, Inc. in May for an
undisclosed price. The asking price on the
property was $3.9M. The property was
100% occupied at the time of sale.
5925 Dillard Circle
Job Growth & Unemployment
(not seasonally adjusted)
UNEMPLOYMENT 5/15 5/16
AUSTIN 3.3% 2.9%
TEXAS 4.3% 4.2%
U.S. 5.3% 4.5%
JOB GROWTH
Annual
Change
# of Jobs
Added
AUSTIN 3.9% 37.3K
TEXAS 1.4% 169.4K
U.S. 1.7% 2.4M
The 90,000 SF warehouse was purchased
in April of this year by East Group
Properties, Inc. for an undisclosed amount.
The property was 100% leased at the time
of sale.
2 Austin Research & Forecast Report | Q2 2016 | Industrial | Colliers International
Sales Activity
Sources: Real Capital Analytics
Q2 2016
No. of Properties: 4
Total SF: 467,198 SF
Average $/SF: $87/SF
Average Cap Rate: 6.8%
8301 Springdale Road
Vacancy & Availability
Austin’s citywide average vacancy rate dropped slightly from 7.3% to 7.1% over the
quarter from 7.4% to 7.7%. The largest spike in vacancy over the quarter occurred in the
Southwest submarket, where it increased from 3.6% in Q1 to 8.3% in Q2 due to 10,000
sqaure feet of sublease space becoming available at Oak Hill 1.
The largest decreases in vacancy over the quarter occurred in the Far Northwest
submarket where vacancy fell from 7.9% to 0.8%, and in the Northeast submarket
where vacancy dropped from 6.2% to 4.9%.
Despite a decline in new construction, rising rental rates and a slight decrease in the
vacancy rate prove that Austin’s industrial market continues to grow.
Absorption & Demand
Even after delivering only one building that was just 33% pre-leased, the absorption
for the Austin industrial market still jumped significantly in the second quarter.
Austin’s industrial market posted 141,773 sqaure feet of positive net absorption in the
second quarter, up from 42,578 square feet of negative net absorption in Q1. The
Round Rock submarket posted the largest amount of negative absorption, 83,269
square feet.
The Northeast submarket posted the largest positive net absorption of 100,530
square feet due in part to a tenant moving into 25,125 square feet at 9101 Wall
Street. The Hays County submarket posted the second highest positive net
absorption of 75,263 sqaure feet as Heaven Hill Distilleries moved into their space at
5 Brent Boulevard in June 2016.
Rental Rates
According to CoStar, our data service provider, the citywide average rental rate
increased over the quarter to an average rate of $9.81 per SF NNN from $9.56 per
SF NNN in Q1. In one year, citywide average rental rates have risen by 9.24%.
The highest average rental rate at the end of Q2 was in the Northwest submarket at
$15.90 per SF NNN. The Northwest submarket also had the largest increase in rental
rates over the quarter with rates rising from $9.38 per SF NNN to $15.90 per SF
NNN.
3 Austin Research & Forecast Report | Q2 2016 | Industrial | Colliers International33
Q2 2016 Top Industrial Lease Transactions
BUILDING NAME/ADDRESS SUBMARKET SF TENANT LEASE DATE
116 E Old Settlers Blvd Round Rock Ind 122,012 UPS3
Apr-16
2214 Braker Ln North Ind 80,000 Global Resale Apr-16
6800 Burleson Rd Southeast Ind 78,294 AMC3
Jun-16
12112 Boardwalk Dr Far Northwest Ind 48,037 Logistics Company1
Jun-16
8606 Wall St Northeast Ind 43,200 Living Direct3
Jun-16
4401 Freidrich Ln Southeast Ind 32,317 Wonderwall Studios LLC May-16
8701 Wall St Northeast Ind 32,000 Mattress Firm1
Apr-16
6301 E Stassney Ln Southeast Ind 32,000 Ketra Apr-16
6406 Burleson Rd Southeast Ind 30,600 Getagadget1
May-16
6800 Burleson Rd Southeast Ind 30,000 Genesis Today3
Jun-16
Leasing Activity
Austin’s industrial leasing activity reached 902,447 square feet in Q2 2016. The bulk of the major leases signed in the second quarter were
in the Southeast submarket, totaling 294,172 square feet. The largest lease signed was a 122,012 square foot sublease signed by UPS.
Global Resale, who will occupy 80,000 square feet at 2214 Braker Lane in the North submarket, also signed this quarter.
1
Renewal
2
Expansion
3
Sublease
AUSTIN INDUSTRIAL MARKET STATISTICAL SUMMARY
Q2 2016
Market
#
Bldgs
Rentable
Area
Direct
Vacant
SF
Direct
Vacancy
Rate
Sublet
Vacant
SF
Sublet
Vacancy
Rate
Total Va-
cant SF
Total
Vacancy
Rate
2Q16 Net
Absorption
1Q16 Net
Absorp-
tion
2Q16
Comple-
tions
1Q16
Comple-
tions
SF Under
Construc-
tion
Austin Total 806 50,431,190 2,949,364 5.8% 332,595 0.7% 3,281,959 6.5% 141,773 (42,578) 72,000 334,870 1,787,440
Central 32 1,155,810 68,064 5.9% 3,925 0.3% 71,989 6.2% (6,651) 4,421 - - -
East 66 3,932,774 481,010 12.2% 43,280 1.1% 524,290 13.3% 20,000 (149,009) - - 500,000
Far
Northeast
35 2,512,744 371,683 14.8% 30,000 1.2% 401,683 16.0% (42,638) (126,075) - 154,370 96,000
Far
Northwest
18 797,361 6,300 0.8% - 0.0% 6,300 0.8% 56,663 9,036 - - -
Hays
County
39 2,322,975 113,162 4.9% 127,682 5.5% 240,844 10.4% 75,263 (165,737) - - 855,000
North 217 13,739,422 634,351 4.6% 24,535 0.2% 658,886 4.8% 42,195 93,573 - - 80,340
Northeast 114 7,786,610 365,382 4.7% 19,352 0.2% 384,734 4.9% 100,530 77,794 - 20,500 -
Northwest 29 2,611,605 238,944 9.1% 11,084 0.4% 250,028 9.6% 1,353 (179,340) - - -
Round Rock 49 2,656,709 248,420 9.4% 17,600 0.7% 266,020 10.0% (83,269) 200,411 - - -
South 41 1,668,816 74,952 4.5% 11,437 0.7% 86,389 5.2% 18,266 (39,769) - - -
Southeast 161 11,036,333 347,096 3.1% 26,200 0.2% 373,296 3.4% (29,939) 210,997 72,000 160,000 256,100
Southwest 5 210,031 - 0.0% 17,500 8.3% 17,500 8.3% (10,000) 21,120 - - -
Austin Industrial Market Summary
4 Austin Research & Forecast Report | Q2 2015 | Office | Colliers International4 North American Research & Forecast Report | Q4 2014 | Office Market Outlook | Colliers International
Copyright © 2015 Colliers International.
The information contained herein has been obtained from sources deemed reliable. While
every reasonable effort has been made to ensure its accuracy, we cannot guarantee it. No
responsibility is assumed for any inaccuracies. Readers are encouraged to consult their
professional advisors prior to acting on any of the material contained in this report.
Colliers International | Market
000 Address, Suite #
+1 000 000 0000
colliers.com/<<market>>
4 North American Research & Forecast Report | Q4 2014 | Office Market Outlook | Colliers International
Copyright © 2015 Colliers International.
The information contained herein has been obtained from sources deemed reliable. While
every reasonable effort has been made to ensure its accuracy, we cannot guarantee it. No
responsibility is assumed for any inaccuracies. Readers are encouraged to consult their
professional advisors prior to acting on any of the material contained in this report.
Colliers International | Austin
111 Congress Avenue, Suite 750
Austin, Texas 78701
+1 512 539 3000
colliers.com/texas/austin
FOR MORE INFORMATION
			Broker Contacts:
Travis Hicks
Vice President | Austin
+1 512 539 3005
travis.hicks@colliers.com		
	
Bentley Smith
Senior Associate | Austin
+1 512 539 3007
bentley.smith@colliers.com	
		
Research Contact:
Kaitlin Holm
Research and Marketing Coordinator | Austin
+1 512 565 3021
kaitlin.holm@colliers.com
AS OF APRIL 1st, WE HAVE MOVED
Our new address is:
BUILDING ADDRESS SUBMARKET RBA
%
LEASED
DEVELOPER
ESTIMATED
DELIVERY DATE
BUILDING DESCRIPTION
Amazon - 1401 E. McCarty Ln Hays County 855,000 100.0% Seefried Properties, Inc. Jul-16 Industrial Distribution
6301 E Stassney Ln - Expo 12 Southeast 57,600 55.6% Trammel Crow Jul-16 Industrial Warehouse
955 County Road 118 Georgetown 48,215 0.0% Unknown Jul-16 Industrial Warehouse
"Harris Ridge Business Center- Bldg 2
1100 E Howard Ln"
Far Northeast 44,800 0.0% HPI Real Estate Aug-16 Industrial Warehouse
6301 E Stassney Ln - Expo 13 Southeast 136,000 41.2% Trammel Crow Sep-16 Industrial Warehouse
2121 Scarbrough Dr - Bldg 4 North 80,340 63.2% Clarion Sep-16 Industrial Warehouse
7307 Burleson Rd Southeast 62,500 0.0%
Industrial Group
Southwest, LLC
Dec-16 Industrial Building
Capitol Wright Distribution Center
Highway 290 East
East 500,000 100.0% Capitol Wright Distributing Dec-16 Industrial Distribution
Harris Ridge Business Center- Bldg 1
1100 E Howard Ln
Far Northeast 51,200 0.0% HPI Real Estate Jan-17 Industrial Warehouse
Q2 2016 Industrial Under Construction - 20,000 SF or greater
XM SF
Q2 2016 Highlights
-39.6%
ANNUALLY
14.3%
QUARTERLY
TOTAL INDUSTRIAL
INVENTORY
50.1M SF
LEASING
ACTIVITY
Q2 2015
1.7M SFQ3 2015
1.7M SFQ4 2015
1.8M SFQ1 2016 892K SF
2.6%
QUARTERLY
9.2%
ANNUALLY
7.2% 142K SF
VACANCY NET ABSORPTION
CURRENT
$9.81/SF
AVERAGE
RENTAL RATE
UNDER
CONSTRUCTION
1,787,440 SF
DOWN FROM 1,796,940 SF
IN Q1 2016
Q2 2016 1.02M SF
1.86M SF
1.67M SF
1.69M SF

More Related Content

What's hot

Q1 2014 Houston Industrial Market Research & Forecast Report
Q1 2014 Houston Industrial Market Research & Forecast ReportQ1 2014 Houston Industrial Market Research & Forecast Report
Q1 2014 Houston Industrial Market Research & Forecast ReportColliers International | Houston
 
Q1 2013 Houston Industrial Market Report
Q1 2013 Houston Industrial Market ReportQ1 2013 Houston Industrial Market Report
Q1 2013 Houston Industrial Market ReportCoy Davidson
 
Q1 2013 houston_industrial_market_report
Q1 2013 houston_industrial_market_reportQ1 2013 houston_industrial_market_report
Q1 2013 houston_industrial_market_reportLisa Bridges
 
NATIONAL WAGE EQUALIZATION AND REGIONAL MISALLOCATION: EVIDENCE FROM ITALIAN ...
NATIONAL WAGE EQUALIZATION AND REGIONAL MISALLOCATION: EVIDENCE FROM ITALIAN ...NATIONAL WAGE EQUALIZATION AND REGIONAL MISALLOCATION: EVIDENCE FROM ITALIAN ...
NATIONAL WAGE EQUALIZATION AND REGIONAL MISALLOCATION: EVIDENCE FROM ITALIAN ...Structuralpolicyanalysis
 
FNB May Building Statistics (Jul 2019)
FNB May Building Statistics (Jul 2019)FNB May Building Statistics (Jul 2019)
FNB May Building Statistics (Jul 2019)Berty Van Staaden
 
JLL West Michigan Industrial Insight & Statistics - Q4 2019
JLL West Michigan Industrial Insight & Statistics - Q4 2019JLL West Michigan Industrial Insight & Statistics - Q4 2019
JLL West Michigan Industrial Insight & Statistics - Q4 2019Harrison West
 
Telling macro stories about productivity from micro data
Telling macro stories about productivity from micro dataTelling macro stories about productivity from micro data
Telling macro stories about productivity from micro dataStructuralpolicyanalysis
 
Stats SA mining production preliminary report
Stats SA mining production preliminary reportStats SA mining production preliminary report
Stats SA mining production preliminary reportSABC News
 
Early January 2017 Monthly Economic Indicators and Industry Trends
Early January 2017 Monthly Economic Indicators and Industry TrendsEarly January 2017 Monthly Economic Indicators and Industry Trends
Early January 2017 Monthly Economic Indicators and Industry TrendsPaul Sedor
 
St louis Industrial Employment Update
St  louis Industrial Employment UpdateSt  louis Industrial Employment Update
St louis Industrial Employment UpdateBlaise Tomazic
 
Q4 2014 Houston Industrial Market Research & Forecast Report
Q4 2014 Houston Industrial Market Research & Forecast ReportQ4 2014 Houston Industrial Market Research & Forecast Report
Q4 2014 Houston Industrial Market Research & Forecast ReportColliers International | Houston
 

What's hot (20)

Q3 2020 | Austin Industrial | Research & Forecast Report
Q3 2020 | Austin Industrial | Research & Forecast ReportQ3 2020 | Austin Industrial | Research & Forecast Report
Q3 2020 | Austin Industrial | Research & Forecast Report
 
Q1 2018 austin_industrial_market_research_report
Q1 2018 austin_industrial_market_research_reportQ1 2018 austin_industrial_market_research_report
Q1 2018 austin_industrial_market_research_report
 
Q2 2017 Austin Industrial Research & Forecast Report
Q2 2017 Austin Industrial Research & Forecast Report Q2 2017 Austin Industrial Research & Forecast Report
Q2 2017 Austin Industrial Research & Forecast Report
 
Q1 2014 Houston Industrial Market Research & Forecast Report
Q1 2014 Houston Industrial Market Research & Forecast ReportQ1 2014 Houston Industrial Market Research & Forecast Report
Q1 2014 Houston Industrial Market Research & Forecast Report
 
Q1 2013 Houston Industrial Market Research Report
Q1 2013 Houston Industrial Market Research ReportQ1 2013 Houston Industrial Market Research Report
Q1 2013 Houston Industrial Market Research Report
 
Q1 2013 Houston Industrial Market Report
Q1 2013 Houston Industrial Market ReportQ1 2013 Houston Industrial Market Report
Q1 2013 Houston Industrial Market Report
 
Q1 2013 houston_industrial_market_report
Q1 2013 houston_industrial_market_reportQ1 2013 houston_industrial_market_report
Q1 2013 houston_industrial_market_report
 
Q4 2013 Houston Industrial Market Research Report
Q4 2013 Houston Industrial Market Research ReportQ4 2013 Houston Industrial Market Research Report
Q4 2013 Houston Industrial Market Research Report
 
Q2 2013 Houston Industrial Market Research Report
Q2 2013 Houston Industrial Market Research ReportQ2 2013 Houston Industrial Market Research Report
Q2 2013 Houston Industrial Market Research Report
 
NATIONAL WAGE EQUALIZATION AND REGIONAL MISALLOCATION: EVIDENCE FROM ITALIAN ...
NATIONAL WAGE EQUALIZATION AND REGIONAL MISALLOCATION: EVIDENCE FROM ITALIAN ...NATIONAL WAGE EQUALIZATION AND REGIONAL MISALLOCATION: EVIDENCE FROM ITALIAN ...
NATIONAL WAGE EQUALIZATION AND REGIONAL MISALLOCATION: EVIDENCE FROM ITALIAN ...
 
FNB May Building Statistics (Jul 2019)
FNB May Building Statistics (Jul 2019)FNB May Building Statistics (Jul 2019)
FNB May Building Statistics (Jul 2019)
 
Q3 2013 Houston Industrial Market Research Report
Q3 2013 Houston Industrial Market Research ReportQ3 2013 Houston Industrial Market Research Report
Q3 2013 Houston Industrial Market Research Report
 
Q2 2021 Austin Industrial Report
Q2 2021 Austin Industrial ReportQ2 2021 Austin Industrial Report
Q2 2021 Austin Industrial Report
 
JLL West Michigan Industrial Insight & Statistics - Q4 2019
JLL West Michigan Industrial Insight & Statistics - Q4 2019JLL West Michigan Industrial Insight & Statistics - Q4 2019
JLL West Michigan Industrial Insight & Statistics - Q4 2019
 
Telling macro stories about productivity from micro data
Telling macro stories about productivity from micro dataTelling macro stories about productivity from micro data
Telling macro stories about productivity from micro data
 
Stats SA mining production preliminary report
Stats SA mining production preliminary reportStats SA mining production preliminary report
Stats SA mining production preliminary report
 
Q4 2017 | Houston Office | Research & Forecast Report
Q4 2017 | Houston Office | Research & Forecast ReportQ4 2017 | Houston Office | Research & Forecast Report
Q4 2017 | Houston Office | Research & Forecast Report
 
Early January 2017 Monthly Economic Indicators and Industry Trends
Early January 2017 Monthly Economic Indicators and Industry TrendsEarly January 2017 Monthly Economic Indicators and Industry Trends
Early January 2017 Monthly Economic Indicators and Industry Trends
 
St louis Industrial Employment Update
St  louis Industrial Employment UpdateSt  louis Industrial Employment Update
St louis Industrial Employment Update
 
Q4 2014 Houston Industrial Market Research & Forecast Report
Q4 2014 Houston Industrial Market Research & Forecast ReportQ4 2014 Houston Industrial Market Research & Forecast Report
Q4 2014 Houston Industrial Market Research & Forecast Report
 

Similar to Austin industrial rates reach new highs as vacancy drops

Austin’s industrial market closes 2018 with new buildings and high absorption
Austin’s industrial market closes 2018 with new buildings and high absorptionAustin’s industrial market closes 2018 with new buildings and high absorption
Austin’s industrial market closes 2018 with new buildings and high absorptionColliers International | Houston
 
Q3 2015 Houston Industrial Market Research & Forecast Report
Q3 2015 Houston Industrial Market Research & Forecast ReportQ3 2015 Houston Industrial Market Research & Forecast Report
Q3 2015 Houston Industrial Market Research & Forecast ReportColliers International | Houston
 
Q4 2015 Austin Office Market Research & Forecast Report
Q4 2015 Austin Office Market Research & Forecast ReportQ4 2015 Austin Office Market Research & Forecast Report
Q4 2015 Austin Office Market Research & Forecast ReportLisa Bridges
 
Q4 2012 Cincinnati Market Trends Industrial
Q4 2012 Cincinnati Market Trends IndustrialQ4 2012 Cincinnati Market Trends Industrial
Q4 2012 Cincinnati Market Trends Industrialcolliersohio
 
St. Louis Industrial Outlook Q3 2016
St. Louis Industrial Outlook Q3 2016St. Louis Industrial Outlook Q3 2016
St. Louis Industrial Outlook Q3 2016Blaise Tomazic
 

Similar to Austin industrial rates reach new highs as vacancy drops (20)

Q1 2015 Austin Industrial Market Report
Q1 2015 Austin Industrial Market ReportQ1 2015 Austin Industrial Market Report
Q1 2015 Austin Industrial Market Report
 
Q3 2015 Austin Industrial Market Research Report
Q3 2015 Austin Industrial Market Research ReportQ3 2015 Austin Industrial Market Research Report
Q3 2015 Austin Industrial Market Research Report
 
Q1 2020 | Austin Industrial | Research & Forecast Report
Q1 2020 | Austin Industrial | Research & Forecast ReportQ1 2020 | Austin Industrial | Research & Forecast Report
Q1 2020 | Austin Industrial | Research & Forecast Report
 
Austin’s industrial market closes 2018 with new buildings and high absorption
Austin’s industrial market closes 2018 with new buildings and high absorptionAustin’s industrial market closes 2018 with new buildings and high absorption
Austin’s industrial market closes 2018 with new buildings and high absorption
 
Q3 2017 | Austin Industrial | Research & Forecast Report
Q3 2017 | Austin Industrial | Research & Forecast ReportQ3 2017 | Austin Industrial | Research & Forecast Report
Q3 2017 | Austin Industrial | Research & Forecast Report
 
Q2 2019 | Austin Industrial | Research & Forecast Report
Q2 2019 | Austin Industrial | Research & Forecast ReportQ2 2019 | Austin Industrial | Research & Forecast Report
Q2 2019 | Austin Industrial | Research & Forecast Report
 
Q3 2014 Austin Office Market Research & Forecast Report
Q3 2014 Austin Office Market Research & Forecast ReportQ3 2014 Austin Office Market Research & Forecast Report
Q3 2014 Austin Office Market Research & Forecast Report
 
Q2 2016 Office Market Report | Austin
Q2 2016 Office Market Report | Austin Q2 2016 Office Market Report | Austin
Q2 2016 Office Market Report | Austin
 
Q3 2015 Houston Industrial Market Research & Forecast Report
Q3 2015 Houston Industrial Market Research & Forecast ReportQ3 2015 Houston Industrial Market Research & Forecast Report
Q3 2015 Houston Industrial Market Research & Forecast Report
 
Q1 2018 | Houston Industrial | Research & Forecast Report
Q1 2018 | Houston Industrial | Research & Forecast ReportQ1 2018 | Houston Industrial | Research & Forecast Report
Q1 2018 | Houston Industrial | Research & Forecast Report
 
Q4 2015 Austin Office Market Research & Forecast Report
Q4 2015 Austin Office Market Research & Forecast ReportQ4 2015 Austin Office Market Research & Forecast Report
Q4 2015 Austin Office Market Research & Forecast Report
 
Q4 2015 Austin Office Market Research & Forecast Report
Q4 2015 Austin Office Market Research & Forecast ReportQ4 2015 Austin Office Market Research & Forecast Report
Q4 2015 Austin Office Market Research & Forecast Report
 
Q1 2022 Austin Industrial Report
Q1 2022 Austin Industrial ReportQ1 2022 Austin Industrial Report
Q1 2022 Austin Industrial Report
 
Q4 2016 Houston Industrial Research & Forecast Report
Q4 2016 Houston Industrial Research & Forecast Report Q4 2016 Houston Industrial Research & Forecast Report
Q4 2016 Houston Industrial Research & Forecast Report
 
Q3 2017 | Houston Industrial | Research & Forecast Report
Q3 2017 | Houston Industrial | Research & Forecast ReportQ3 2017 | Houston Industrial | Research & Forecast Report
Q3 2017 | Houston Industrial | Research & Forecast Report
 
Q2 2018 | Houston Industrial | Research & Forecast Report
Q2 2018 | Houston Industrial | Research & Forecast ReportQ2 2018 | Houston Industrial | Research & Forecast Report
Q2 2018 | Houston Industrial | Research & Forecast Report
 
Q3 2015 Austin Office Market Research & Forecast Report
Q3 2015 Austin Office Market Research & Forecast ReportQ3 2015 Austin Office Market Research & Forecast Report
Q3 2015 Austin Office Market Research & Forecast Report
 
Q1 2019 | Houston Industrial | Research & Forecast Report
Q1 2019 | Houston Industrial | Research & Forecast ReportQ1 2019 | Houston Industrial | Research & Forecast Report
Q1 2019 | Houston Industrial | Research & Forecast Report
 
Q4 2012 Cincinnati Market Trends Industrial
Q4 2012 Cincinnati Market Trends IndustrialQ4 2012 Cincinnati Market Trends Industrial
Q4 2012 Cincinnati Market Trends Industrial
 
St. Louis Industrial Outlook Q3 2016
St. Louis Industrial Outlook Q3 2016St. Louis Industrial Outlook Q3 2016
St. Louis Industrial Outlook Q3 2016
 

More from Colliers International | Houston

More from Colliers International | Houston (20)

Q1 2022 Austin Office Market Report
Q1 2022 Austin Office Market ReportQ1 2022 Austin Office Market Report
Q1 2022 Austin Office Market Report
 
2021 Q3 Office Austin Report
2021 Q3 Office Austin Report2021 Q3 Office Austin Report
2021 Q3 Office Austin Report
 
Q2 2021 Austin Office Report
Q2 2021 Austin Office ReportQ2 2021 Austin Office Report
Q2 2021 Austin Office Report
 
Q1 2021 Austin Office Report
Q1 2021 Austin Office ReportQ1 2021 Austin Office Report
Q1 2021 Austin Office Report
 
Colliers Q4 2020 Austin Industrial Report
Colliers Q4 2020 Austin Industrial ReportColliers Q4 2020 Austin Industrial Report
Colliers Q4 2020 Austin Industrial Report
 
Q4 2020 Austin Office Report
Q4 2020 Austin Office ReportQ4 2020 Austin Office Report
Q4 2020 Austin Office Report
 
Q4 2020 | Houston Office | Research & Forecast Report
Q4 2020 | Houston Office | Research & Forecast ReportQ4 2020 | Houston Office | Research & Forecast Report
Q4 2020 | Houston Office | Research & Forecast Report
 
Q3 2020 | The Woodlands Office | Research Snapshot
Q3 2020 | The Woodlands Office | Research SnapshotQ3 2020 | The Woodlands Office | Research Snapshot
Q3 2020 | The Woodlands Office | Research Snapshot
 
Q3 2020 | Fort Bend | Submarket Snapshot
Q3 2020 | Fort Bend | Submarket SnapshotQ3 2020 | Fort Bend | Submarket Snapshot
Q3 2020 | Fort Bend | Submarket Snapshot
 
Q3 2020 | Austin Office | Research & Forecast Report
Q3 2020 | Austin Office | Research & Forecast ReportQ3 2020 | Austin Office | Research & Forecast Report
Q3 2020 | Austin Office | Research & Forecast Report
 
Q3 2020 | Houston Office | Research & Forecast Report
Q3 2020 | Houston Office | Research & Forecast ReportQ3 2020 | Houston Office | Research & Forecast Report
Q3 2020 | Houston Office | Research & Forecast Report
 
Q2 2020 | The Woodlands Office | Research Snapshot
Q2 2020 | The Woodlands Office | Research SnapshotQ2 2020 | The Woodlands Office | Research Snapshot
Q2 2020 | The Woodlands Office | Research Snapshot
 
Q2 2020 | E Fort Bend Commercial Real Estate Trends
Q2 2020 | E Fort Bend Commercial Real Estate TrendsQ2 2020 | E Fort Bend Commercial Real Estate Trends
Q2 2020 | E Fort Bend Commercial Real Estate Trends
 
Mid-Year 2020 | Houston Healthcare | Market Report
Mid-Year 2020 | Houston Healthcare | Market ReportMid-Year 2020 | Houston Healthcare | Market Report
Mid-Year 2020 | Houston Healthcare | Market Report
 
Q2 2020 | Austin Office | Research & Forecast Report
Q2 2020 | Austin Office | Research & Forecast ReportQ2 2020 | Austin Office | Research & Forecast Report
Q2 2020 | Austin Office | Research & Forecast Report
 
Q1 2020 | The Woodlands Office | Research Snapshot
Q1 2020 | The Woodlands Office | Research SnapshotQ1 2020 | The Woodlands Office | Research Snapshot
Q1 2020 | The Woodlands Office | Research Snapshot
 
Q1 2020 | Fort Bend Submarket Snapshot
Q1 2020 | Fort Bend Submarket SnapshotQ1 2020 | Fort Bend Submarket Snapshot
Q1 2020 | Fort Bend Submarket Snapshot
 
Q1 2020 | Houston Retail | Research & Forecast Report
Q1 2020 | Houston Retail | Research & Forecast ReportQ1 2020 | Houston Retail | Research & Forecast Report
Q1 2020 | Houston Retail | Research & Forecast Report
 
Q1 2020 | Austin Office | Research & Forecast Report
Q1 2020 | Austin Office | Research & Forecast ReportQ1 2020 | Austin Office | Research & Forecast Report
Q1 2020 | Austin Office | Research & Forecast Report
 
Q1 2020 | Houston Industrial Market Report
Q1 2020 | Houston Industrial Market ReportQ1 2020 | Houston Industrial Market Report
Q1 2020 | Houston Industrial Market Report
 

Recently uploaded

9990771857 Call Girls in Noida Sector 11 Noida (Call Girls) Delhi
9990771857 Call Girls in Noida Sector 11 Noida (Call Girls) Delhi9990771857 Call Girls in Noida Sector 11 Noida (Call Girls) Delhi
9990771857 Call Girls in Noida Sector 11 Noida (Call Girls) Delhidelhimodel235
 
Model Call Girl in Shastri Nagar Delhi reach out to us at 🔝8264348440🔝
Model Call Girl in Shastri Nagar Delhi reach out to us at 🔝8264348440🔝Model Call Girl in Shastri Nagar Delhi reach out to us at 🔝8264348440🔝
Model Call Girl in Shastri Nagar Delhi reach out to us at 🔝8264348440🔝soniya singh
 
Call Girls in laxmi Nagar Delhi 💯Call Us 🔝 9582086666🔝 South Delhi Escorts Se...
Call Girls in laxmi Nagar Delhi 💯Call Us 🔝 9582086666🔝 South Delhi Escorts Se...Call Girls in laxmi Nagar Delhi 💯Call Us 🔝 9582086666🔝 South Delhi Escorts Se...
Call Girls in laxmi Nagar Delhi 💯Call Us 🔝 9582086666🔝 South Delhi Escorts Se...delhimodel235
 
Call Girls in Noida Sector 12 Noida 💯Call Us 🔝 9582086666 🔝 South Delhi Escor...
Call Girls in Noida Sector 12 Noida 💯Call Us 🔝 9582086666 🔝 South Delhi Escor...Call Girls in Noida Sector 12 Noida 💯Call Us 🔝 9582086666 🔝 South Delhi Escor...
Call Girls in Noida Sector 12 Noida 💯Call Us 🔝 9582086666 🔝 South Delhi Escor...delhimodel235
 
9990771857 Call Girls in Noida Sector 34 Noida (Call Girls) Delhi
9990771857 Call Girls in Noida Sector 34 Noida (Call Girls) Delhi9990771857 Call Girls in Noida Sector 34 Noida (Call Girls) Delhi
9990771857 Call Girls in Noida Sector 34 Noida (Call Girls) Delhidelhimodel235
 
9990771857 Call Girls in Noida Sector 10 Noida (Call Girls) Delhi
9990771857 Call Girls in Noida Sector 10 Noida (Call Girls) Delhi9990771857 Call Girls in Noida Sector 10 Noida (Call Girls) Delhi
9990771857 Call Girls in Noida Sector 10 Noida (Call Girls) Delhidelhimodel235
 
call girls in Shahdara (DELHI) 🔝 >༒9953330565🔝 genuine Escort Service 🔝✔️✔️
call girls in Shahdara (DELHI) 🔝 >༒9953330565🔝 genuine Escort Service 🔝✔️✔️call girls in Shahdara (DELHI) 🔝 >༒9953330565🔝 genuine Escort Service 🔝✔️✔️
call girls in Shahdara (DELHI) 🔝 >༒9953330565🔝 genuine Escort Service 🔝✔️✔️9953056974 Low Rate Call Girls In Saket, Delhi NCR
 
Purva Palm Hills Devanahalli, Bangalore E- Brochure.pdf
Purva Palm Hills Devanahalli, Bangalore E- Brochure.pdfPurva Palm Hills Devanahalli, Bangalore E- Brochure.pdf
Purva Palm Hills Devanahalli, Bangalore E- Brochure.pdffaheemali990101
 
Call Girls in Pitampura Delhi 💯Call Us 🔝8264348440🔝
Call Girls in Pitampura Delhi 💯Call Us 🔝8264348440🔝Call Girls in Pitampura Delhi 💯Call Us 🔝8264348440🔝
Call Girls in Pitampura Delhi 💯Call Us 🔝8264348440🔝soniya singh
 
Call Girls in shastri nagar Delhi 8264348440 ✅ call girls ❤️
Call Girls in shastri nagar Delhi 8264348440 ✅ call girls ❤️Call Girls in shastri nagar Delhi 8264348440 ✅ call girls ❤️
Call Girls in shastri nagar Delhi 8264348440 ✅ call girls ❤️soniya singh
 
Call Girls in Janakpuri ↫8447779280↫Short 1500 Night 6000-Escorts Service In ...
Call Girls in Janakpuri ↫8447779280↫Short 1500 Night 6000-Escorts Service In ...Call Girls in Janakpuri ↫8447779280↫Short 1500 Night 6000-Escorts Service In ...
Call Girls in Janakpuri ↫8447779280↫Short 1500 Night 6000-Escorts Service In ...asmaqueen5
 
call girls in ganesh nagar Delhi 8264348440 ✅ call girls ❤️
call girls in ganesh nagar Delhi 8264348440 ✅ call girls ❤️call girls in ganesh nagar Delhi 8264348440 ✅ call girls ❤️
call girls in ganesh nagar Delhi 8264348440 ✅ call girls ❤️soniya singh
 
Low Rate Call Girls in Triveni Complex Delhi Call 9990771857
Low Rate Call Girls in Triveni Complex Delhi Call 9990771857Low Rate Call Girls in Triveni Complex Delhi Call 9990771857
Low Rate Call Girls in Triveni Complex Delhi Call 9990771857delhimodel235
 
How to Build Multifamily and Laneway Suites in Toronto!! (feat. Expert Archi...
How to Build Multifamily and Laneway Suites  in Toronto!! (feat. Expert Archi...How to Build Multifamily and Laneway Suites  in Toronto!! (feat. Expert Archi...
How to Build Multifamily and Laneway Suites in Toronto!! (feat. Expert Archi...Volition Properties
 
Aparna Greenscapes Kompally Hyderabad E - Brochure.pdf
Aparna Greenscapes Kompally Hyderabad E - Brochure.pdfAparna Greenscapes Kompally Hyderabad E - Brochure.pdf
Aparna Greenscapes Kompally Hyderabad E - Brochure.pdffaheemali990101
 
Eco-Efficient Living: Redefining Sustainability through Leech's Green Design ...
Eco-Efficient Living: Redefining Sustainability through Leech's Green Design ...Eco-Efficient Living: Redefining Sustainability through Leech's Green Design ...
Eco-Efficient Living: Redefining Sustainability through Leech's Green Design ...Newman George Leech
 
Call Girls in Kashmiri Gate Delhi 💯Call Us 🔝8264348440🔝
Call Girls in Kashmiri Gate Delhi 💯Call Us 🔝8264348440🔝Call Girls in Kashmiri Gate Delhi 💯Call Us 🔝8264348440🔝
Call Girls in Kashmiri Gate Delhi 💯Call Us 🔝8264348440🔝soniya singh
 
Shapoorji Pallonji Parkwest Sequoia Tower Bangalore.pdf
Shapoorji Pallonji Parkwest Sequoia Tower Bangalore.pdfShapoorji Pallonji Parkwest Sequoia Tower Bangalore.pdf
Shapoorji Pallonji Parkwest Sequoia Tower Bangalore.pdfashiyadav24
 
Call Girls in Sarai Kale Khan Delhi 💯Call Us 🔝8264348440🔝
Call Girls in Sarai Kale Khan Delhi 💯Call Us 🔝8264348440🔝Call Girls in Sarai Kale Khan Delhi 💯Call Us 🔝8264348440🔝
Call Girls in Sarai Kale Khan Delhi 💯Call Us 🔝8264348440🔝soniya singh
 
Call Girls in Noida Sector 77 Noida 💯Call Us 🔝 9582086666 🔝 South Delhi Escor...
Call Girls in Noida Sector 77 Noida 💯Call Us 🔝 9582086666 🔝 South Delhi Escor...Call Girls in Noida Sector 77 Noida 💯Call Us 🔝 9582086666 🔝 South Delhi Escor...
Call Girls in Noida Sector 77 Noida 💯Call Us 🔝 9582086666 🔝 South Delhi Escor...delhimodel235
 

Recently uploaded (20)

9990771857 Call Girls in Noida Sector 11 Noida (Call Girls) Delhi
9990771857 Call Girls in Noida Sector 11 Noida (Call Girls) Delhi9990771857 Call Girls in Noida Sector 11 Noida (Call Girls) Delhi
9990771857 Call Girls in Noida Sector 11 Noida (Call Girls) Delhi
 
Model Call Girl in Shastri Nagar Delhi reach out to us at 🔝8264348440🔝
Model Call Girl in Shastri Nagar Delhi reach out to us at 🔝8264348440🔝Model Call Girl in Shastri Nagar Delhi reach out to us at 🔝8264348440🔝
Model Call Girl in Shastri Nagar Delhi reach out to us at 🔝8264348440🔝
 
Call Girls in laxmi Nagar Delhi 💯Call Us 🔝 9582086666🔝 South Delhi Escorts Se...
Call Girls in laxmi Nagar Delhi 💯Call Us 🔝 9582086666🔝 South Delhi Escorts Se...Call Girls in laxmi Nagar Delhi 💯Call Us 🔝 9582086666🔝 South Delhi Escorts Se...
Call Girls in laxmi Nagar Delhi 💯Call Us 🔝 9582086666🔝 South Delhi Escorts Se...
 
Call Girls in Noida Sector 12 Noida 💯Call Us 🔝 9582086666 🔝 South Delhi Escor...
Call Girls in Noida Sector 12 Noida 💯Call Us 🔝 9582086666 🔝 South Delhi Escor...Call Girls in Noida Sector 12 Noida 💯Call Us 🔝 9582086666 🔝 South Delhi Escor...
Call Girls in Noida Sector 12 Noida 💯Call Us 🔝 9582086666 🔝 South Delhi Escor...
 
9990771857 Call Girls in Noida Sector 34 Noida (Call Girls) Delhi
9990771857 Call Girls in Noida Sector 34 Noida (Call Girls) Delhi9990771857 Call Girls in Noida Sector 34 Noida (Call Girls) Delhi
9990771857 Call Girls in Noida Sector 34 Noida (Call Girls) Delhi
 
9990771857 Call Girls in Noida Sector 10 Noida (Call Girls) Delhi
9990771857 Call Girls in Noida Sector 10 Noida (Call Girls) Delhi9990771857 Call Girls in Noida Sector 10 Noida (Call Girls) Delhi
9990771857 Call Girls in Noida Sector 10 Noida (Call Girls) Delhi
 
call girls in Shahdara (DELHI) 🔝 >༒9953330565🔝 genuine Escort Service 🔝✔️✔️
call girls in Shahdara (DELHI) 🔝 >༒9953330565🔝 genuine Escort Service 🔝✔️✔️call girls in Shahdara (DELHI) 🔝 >༒9953330565🔝 genuine Escort Service 🔝✔️✔️
call girls in Shahdara (DELHI) 🔝 >༒9953330565🔝 genuine Escort Service 🔝✔️✔️
 
Purva Palm Hills Devanahalli, Bangalore E- Brochure.pdf
Purva Palm Hills Devanahalli, Bangalore E- Brochure.pdfPurva Palm Hills Devanahalli, Bangalore E- Brochure.pdf
Purva Palm Hills Devanahalli, Bangalore E- Brochure.pdf
 
Call Girls in Pitampura Delhi 💯Call Us 🔝8264348440🔝
Call Girls in Pitampura Delhi 💯Call Us 🔝8264348440🔝Call Girls in Pitampura Delhi 💯Call Us 🔝8264348440🔝
Call Girls in Pitampura Delhi 💯Call Us 🔝8264348440🔝
 
Call Girls in shastri nagar Delhi 8264348440 ✅ call girls ❤️
Call Girls in shastri nagar Delhi 8264348440 ✅ call girls ❤️Call Girls in shastri nagar Delhi 8264348440 ✅ call girls ❤️
Call Girls in shastri nagar Delhi 8264348440 ✅ call girls ❤️
 
Call Girls in Janakpuri ↫8447779280↫Short 1500 Night 6000-Escorts Service In ...
Call Girls in Janakpuri ↫8447779280↫Short 1500 Night 6000-Escorts Service In ...Call Girls in Janakpuri ↫8447779280↫Short 1500 Night 6000-Escorts Service In ...
Call Girls in Janakpuri ↫8447779280↫Short 1500 Night 6000-Escorts Service In ...
 
call girls in ganesh nagar Delhi 8264348440 ✅ call girls ❤️
call girls in ganesh nagar Delhi 8264348440 ✅ call girls ❤️call girls in ganesh nagar Delhi 8264348440 ✅ call girls ❤️
call girls in ganesh nagar Delhi 8264348440 ✅ call girls ❤️
 
Low Rate Call Girls in Triveni Complex Delhi Call 9990771857
Low Rate Call Girls in Triveni Complex Delhi Call 9990771857Low Rate Call Girls in Triveni Complex Delhi Call 9990771857
Low Rate Call Girls in Triveni Complex Delhi Call 9990771857
 
How to Build Multifamily and Laneway Suites in Toronto!! (feat. Expert Archi...
How to Build Multifamily and Laneway Suites  in Toronto!! (feat. Expert Archi...How to Build Multifamily and Laneway Suites  in Toronto!! (feat. Expert Archi...
How to Build Multifamily and Laneway Suites in Toronto!! (feat. Expert Archi...
 
Aparna Greenscapes Kompally Hyderabad E - Brochure.pdf
Aparna Greenscapes Kompally Hyderabad E - Brochure.pdfAparna Greenscapes Kompally Hyderabad E - Brochure.pdf
Aparna Greenscapes Kompally Hyderabad E - Brochure.pdf
 
Eco-Efficient Living: Redefining Sustainability through Leech's Green Design ...
Eco-Efficient Living: Redefining Sustainability through Leech's Green Design ...Eco-Efficient Living: Redefining Sustainability through Leech's Green Design ...
Eco-Efficient Living: Redefining Sustainability through Leech's Green Design ...
 
Call Girls in Kashmiri Gate Delhi 💯Call Us 🔝8264348440🔝
Call Girls in Kashmiri Gate Delhi 💯Call Us 🔝8264348440🔝Call Girls in Kashmiri Gate Delhi 💯Call Us 🔝8264348440🔝
Call Girls in Kashmiri Gate Delhi 💯Call Us 🔝8264348440🔝
 
Shapoorji Pallonji Parkwest Sequoia Tower Bangalore.pdf
Shapoorji Pallonji Parkwest Sequoia Tower Bangalore.pdfShapoorji Pallonji Parkwest Sequoia Tower Bangalore.pdf
Shapoorji Pallonji Parkwest Sequoia Tower Bangalore.pdf
 
Call Girls in Sarai Kale Khan Delhi 💯Call Us 🔝8264348440🔝
Call Girls in Sarai Kale Khan Delhi 💯Call Us 🔝8264348440🔝Call Girls in Sarai Kale Khan Delhi 💯Call Us 🔝8264348440🔝
Call Girls in Sarai Kale Khan Delhi 💯Call Us 🔝8264348440🔝
 
Call Girls in Noida Sector 77 Noida 💯Call Us 🔝 9582086666 🔝 South Delhi Escor...
Call Girls in Noida Sector 77 Noida 💯Call Us 🔝 9582086666 🔝 South Delhi Escor...Call Girls in Noida Sector 77 Noida 💯Call Us 🔝 9582086666 🔝 South Delhi Escor...
Call Girls in Noida Sector 77 Noida 💯Call Us 🔝 9582086666 🔝 South Delhi Escor...
 

Austin industrial rates reach new highs as vacancy drops

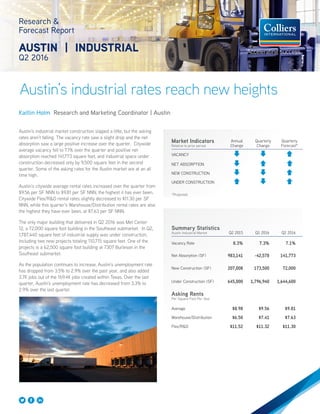
  • 1. Austin’s industrial rates reach new heights Research & Forecast Report AUSTIN | INDUSTRIAL Q2 2016 Kaitlin Holm Research and Marketing Coordinator | Austin Austin’s industrial market construction slipped a little, but the asking rates aren’t falling. The vacancy rate saw a slight drop and the net absorption saw a large positive increase over the quarter. Citywide average vacancy fell to 7.1% over the quarter and positive net absorption reached 141,773 square feet, and industrial space under construction decreased only by 9,500 square feet in the second quarter. Some of the asking rates for the Austin market are at an all time high. Austin’s citywide average rental rates increased over the quarter from $9.56 per SF NNN to $9.81 per SF NNN, the highest it has ever been. Citywide Flex/R&D rental rates slightly decreased to $11.30 per SF NNN, while this quarter’s Warehouse/Distribution rental rates are also the highest they have ever been, at $7.63 per SF NNN. The only major building that delivered in Q2 2016 was Met Center 12, a 72,000 square foot building in the Southeast submarket. In Q2, 1,787,440 square feet of industrial supply was under construction, including two new projects totaling 110,715 square feet. One of the projects is a 62,500 square foot building at 7307 Burleson in the Southeast submarket. As the population continues to increase, Austin’s unemployment rate has dropped from 3.5% to 2.9% over the past year, and also added 3.7K jobs out of the 169.4K jobs created within Texas. Over the last quarter, Austin’s unemployment rate has decreased from 3.3% to 2.9% over the last quarter. Summary Statistics Austin Industrial Market Q2 2015 Q1 2016 Q2 2016 Vacancy Rate 8.3% 7.3% 7.1% Net Absorption (SF) 983,141 -42,578 141,773 New Construction (SF) 207,008 173,500 72,000 Under Construction (SF) 645,000 1,796,940 1,644,600 Asking Rents Per Square Foot Per Year Average $8.98 $9.56 $9.81 Warehouse/Distribution $6.50 $7.41 $7.63 Flex/R&D $11.52 $11.32 $11.30 Market Indicators Relative to prior period Annual Change Quarterly Change Quarterly Forecast* VACANCY NET ABSORPTION NEW CONSTRUCTION UNDER CONSTRUCTION *Projected
  • 2. Mothers Milk Bank of Austin, Inc. purchased the 30,000 SF industrial warehouse from Reid Buildings of Austin, Inc. in May for an undisclosed price. The asking price on the property was $3.9M. The property was 100% occupied at the time of sale. 5925 Dillard Circle Job Growth & Unemployment (not seasonally adjusted) UNEMPLOYMENT 5/15 5/16 AUSTIN 3.3% 2.9% TEXAS 4.3% 4.2% U.S. 5.3% 4.5% JOB GROWTH Annual Change # of Jobs Added AUSTIN 3.9% 37.3K TEXAS 1.4% 169.4K U.S. 1.7% 2.4M The 90,000 SF warehouse was purchased in April of this year by East Group Properties, Inc. for an undisclosed amount. The property was 100% leased at the time of sale. 2 Austin Research & Forecast Report | Q2 2016 | Industrial | Colliers International Sales Activity Sources: Real Capital Analytics Q2 2016 No. of Properties: 4 Total SF: 467,198 SF Average $/SF: $87/SF Average Cap Rate: 6.8% 8301 Springdale Road Vacancy & Availability Austin’s citywide average vacancy rate dropped slightly from 7.3% to 7.1% over the quarter from 7.4% to 7.7%. The largest spike in vacancy over the quarter occurred in the Southwest submarket, where it increased from 3.6% in Q1 to 8.3% in Q2 due to 10,000 sqaure feet of sublease space becoming available at Oak Hill 1. The largest decreases in vacancy over the quarter occurred in the Far Northwest submarket where vacancy fell from 7.9% to 0.8%, and in the Northeast submarket where vacancy dropped from 6.2% to 4.9%. Despite a decline in new construction, rising rental rates and a slight decrease in the vacancy rate prove that Austin’s industrial market continues to grow. Absorption & Demand Even after delivering only one building that was just 33% pre-leased, the absorption for the Austin industrial market still jumped significantly in the second quarter. Austin’s industrial market posted 141,773 sqaure feet of positive net absorption in the second quarter, up from 42,578 square feet of negative net absorption in Q1. The Round Rock submarket posted the largest amount of negative absorption, 83,269 square feet. The Northeast submarket posted the largest positive net absorption of 100,530 square feet due in part to a tenant moving into 25,125 square feet at 9101 Wall Street. The Hays County submarket posted the second highest positive net absorption of 75,263 sqaure feet as Heaven Hill Distilleries moved into their space at 5 Brent Boulevard in June 2016. Rental Rates According to CoStar, our data service provider, the citywide average rental rate increased over the quarter to an average rate of $9.81 per SF NNN from $9.56 per SF NNN in Q1. In one year, citywide average rental rates have risen by 9.24%. The highest average rental rate at the end of Q2 was in the Northwest submarket at $15.90 per SF NNN. The Northwest submarket also had the largest increase in rental rates over the quarter with rates rising from $9.38 per SF NNN to $15.90 per SF NNN.
  • 3. 3 Austin Research & Forecast Report | Q2 2016 | Industrial | Colliers International33 Q2 2016 Top Industrial Lease Transactions BUILDING NAME/ADDRESS SUBMARKET SF TENANT LEASE DATE 116 E Old Settlers Blvd Round Rock Ind 122,012 UPS3 Apr-16 2214 Braker Ln North Ind 80,000 Global Resale Apr-16 6800 Burleson Rd Southeast Ind 78,294 AMC3 Jun-16 12112 Boardwalk Dr Far Northwest Ind 48,037 Logistics Company1 Jun-16 8606 Wall St Northeast Ind 43,200 Living Direct3 Jun-16 4401 Freidrich Ln Southeast Ind 32,317 Wonderwall Studios LLC May-16 8701 Wall St Northeast Ind 32,000 Mattress Firm1 Apr-16 6301 E Stassney Ln Southeast Ind 32,000 Ketra Apr-16 6406 Burleson Rd Southeast Ind 30,600 Getagadget1 May-16 6800 Burleson Rd Southeast Ind 30,000 Genesis Today3 Jun-16 Leasing Activity Austin’s industrial leasing activity reached 902,447 square feet in Q2 2016. The bulk of the major leases signed in the second quarter were in the Southeast submarket, totaling 294,172 square feet. The largest lease signed was a 122,012 square foot sublease signed by UPS. Global Resale, who will occupy 80,000 square feet at 2214 Braker Lane in the North submarket, also signed this quarter. 1 Renewal 2 Expansion 3 Sublease AUSTIN INDUSTRIAL MARKET STATISTICAL SUMMARY Q2 2016 Market # Bldgs Rentable Area Direct Vacant SF Direct Vacancy Rate Sublet Vacant SF Sublet Vacancy Rate Total Va- cant SF Total Vacancy Rate 2Q16 Net Absorption 1Q16 Net Absorp- tion 2Q16 Comple- tions 1Q16 Comple- tions SF Under Construc- tion Austin Total 806 50,431,190 2,949,364 5.8% 332,595 0.7% 3,281,959 6.5% 141,773 (42,578) 72,000 334,870 1,787,440 Central 32 1,155,810 68,064 5.9% 3,925 0.3% 71,989 6.2% (6,651) 4,421 - - - East 66 3,932,774 481,010 12.2% 43,280 1.1% 524,290 13.3% 20,000 (149,009) - - 500,000 Far Northeast 35 2,512,744 371,683 14.8% 30,000 1.2% 401,683 16.0% (42,638) (126,075) - 154,370 96,000 Far Northwest 18 797,361 6,300 0.8% - 0.0% 6,300 0.8% 56,663 9,036 - - - Hays County 39 2,322,975 113,162 4.9% 127,682 5.5% 240,844 10.4% 75,263 (165,737) - - 855,000 North 217 13,739,422 634,351 4.6% 24,535 0.2% 658,886 4.8% 42,195 93,573 - - 80,340 Northeast 114 7,786,610 365,382 4.7% 19,352 0.2% 384,734 4.9% 100,530 77,794 - 20,500 - Northwest 29 2,611,605 238,944 9.1% 11,084 0.4% 250,028 9.6% 1,353 (179,340) - - - Round Rock 49 2,656,709 248,420 9.4% 17,600 0.7% 266,020 10.0% (83,269) 200,411 - - - South 41 1,668,816 74,952 4.5% 11,437 0.7% 86,389 5.2% 18,266 (39,769) - - - Southeast 161 11,036,333 347,096 3.1% 26,200 0.2% 373,296 3.4% (29,939) 210,997 72,000 160,000 256,100 Southwest 5 210,031 - 0.0% 17,500 8.3% 17,500 8.3% (10,000) 21,120 - - - Austin Industrial Market Summary
  • 4. 4 Austin Research & Forecast Report | Q2 2015 | Office | Colliers International4 North American Research & Forecast Report | Q4 2014 | Office Market Outlook | Colliers International Copyright © 2015 Colliers International. The information contained herein has been obtained from sources deemed reliable. While every reasonable effort has been made to ensure its accuracy, we cannot guarantee it. No responsibility is assumed for any inaccuracies. Readers are encouraged to consult their professional advisors prior to acting on any of the material contained in this report. Colliers International | Market 000 Address, Suite # 000 Address, Suite # +1 000 000 0000 colliers.com/<<market>> 4 North American Research & Forecast Report | Q4 2014 | Office Market Outlook | Colliers International Copyright © 2015 Colliers International. The information contained herein has been obtained from sources deemed reliable. While every reasonable effort has been made to ensure its accuracy, we cannot guarantee it. No responsibility is assumed for any inaccuracies. Readers are encouraged to consult their professional advisors prior to acting on any of the material contained in this report. Colliers International | Austin 111 Congress Avenue, Suite 750 Austin, Texas 78701 +1 512 539 3000 colliers.com/texas/austin FOR MORE INFORMATION Broker Contacts: Travis Hicks Vice President | Austin +1 512 539 3005 travis.hicks@colliers.com Bentley Smith Senior Associate | Austin +1 512 539 3007 bentley.smith@colliers.com Research Contact: Kaitlin Holm Research and Marketing Coordinator | Austin +1 512 565 3021 kaitlin.holm@colliers.com AS OF APRIL 1st, WE HAVE MOVED Our new address is: BUILDING ADDRESS SUBMARKET RBA % LEASED DEVELOPER ESTIMATED DELIVERY DATE BUILDING DESCRIPTION Amazon - 1401 E. McCarty Ln Hays County 855,000 100.0% Seefried Properties, Inc. Jul-16 Industrial Distribution 6301 E Stassney Ln - Expo 12 Southeast 57,600 55.6% Trammel Crow Jul-16 Industrial Warehouse 955 County Road 118 Georgetown 48,215 0.0% Unknown Jul-16 Industrial Warehouse "Harris Ridge Business Center- Bldg 2 1100 E Howard Ln" Far Northeast 44,800 0.0% HPI Real Estate Aug-16 Industrial Warehouse 6301 E Stassney Ln - Expo 13 Southeast 136,000 41.2% Trammel Crow Sep-16 Industrial Warehouse 2121 Scarbrough Dr - Bldg 4 North 80,340 63.2% Clarion Sep-16 Industrial Warehouse 7307 Burleson Rd Southeast 62,500 0.0% Industrial Group Southwest, LLC Dec-16 Industrial Building Capitol Wright Distribution Center Highway 290 East East 500,000 100.0% Capitol Wright Distributing Dec-16 Industrial Distribution Harris Ridge Business Center- Bldg 1 1100 E Howard Ln Far Northeast 51,200 0.0% HPI Real Estate Jan-17 Industrial Warehouse Q2 2016 Industrial Under Construction - 20,000 SF or greater XM SF Q2 2016 Highlights -39.6% ANNUALLY 14.3% QUARTERLY TOTAL INDUSTRIAL INVENTORY 50.1M SF LEASING ACTIVITY Q2 2015 1.7M SFQ3 2015 1.7M SFQ4 2015 1.8M SFQ1 2016 892K SF 2.6% QUARTERLY 9.2% ANNUALLY 7.2% 142K SF VACANCY NET ABSORPTION CURRENT $9.81/SF AVERAGE RENTAL RATE UNDER CONSTRUCTION 1,787,440 SF DOWN FROM 1,796,940 SF IN Q1 2016 Q2 2016 1.02M SF 1.86M SF 1.67M SF 1.69M SF