Q3 2015 Austin Industrial Market Research Report
•
1 like•211 views

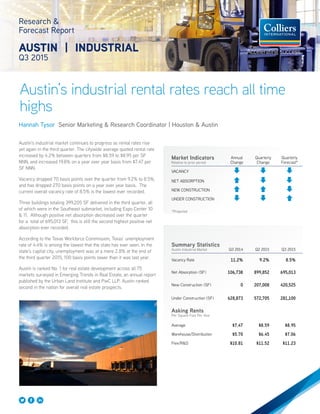
Austin's industrial rental rates reach all time highs

Recommended
Recommended
More Related Content
What's hot
What's hot (20)
Similar to Q3 2015 Austin Industrial Market Research Report
Similar to Q3 2015 Austin Industrial Market Research Report (20)
More from Colliers International | Houston
More from Colliers International | Houston (20)
Recently uploaded
Recently uploaded (20)
Q3 2015 Austin Industrial Market Research Report
- 1. Austin’s industrial rental rates reach all time highs Research & Forecast Report AUSTIN | INDUSTRIAL Q3 2015 Hannah Tysor Senior Marketing & Research Coordinator | Houston & Austin Austin’s industrial market continues to progress as rental rates rise yet again in the third quarter. The citywide average quoted rental rate increased by 4.2% between quarters from $8.59 to $8.95 per SF NNN, and increased 19.8% on a year over year basis from $7.47 per SF NNN. Vacancy dropped 70 basis points over the quarter from 9.2% to 8.5%, and has dropped 270 basis points on a year over year basis. The current overall vacancy rate of 8.5% is the lowest ever recorded. Three buildings totaling 399,205 SF delivered in the third quarter, all of which were in the Southeast submarket, including Expo Center 10 & 11. Although positive net absorption decreased over the quarter for a total of 695,013 SF, this is still the second highest positive net absorption ever recorded. According to the Texas Workforce Commission, Texas’ unemployment rate of 4.4% is among the lowest that the state has ever seen. In the state’s capital city, unemployment was at a mere 2.8% at the end of the third quarter 2015, 100 basis points lower than it was last year. Austin is ranked No. 1 for real estate development across all 75 markets surveyed in Emerging Trends in Real Estate, an annual report published by the Urban Land Institute and PwC LLP. Austin ranked second in the nation for overall real estate prospects. Summary Statistics Austin Industrial Market Q3 2014 Q2 2015 Q3 2015 Vacancy Rate 11.2% 9.2% 8.5% Net Absorption (SF) 106,738 899,852 695,013 New Construction (SF) 0 207,008 420,525 Under Construction (SF) 628,873 572,705 281,100 Asking Rents Per Square Foot Per Year Average $7.47 $8.59 $8.95 Warehouse/Distribution $5.70 $6.45 $7.06 Flex/R&D $10.81 $11.52 $11.23 Market Indicators Relative to prior period Annual Change Quarterly Change Quarterly Forecast* VACANCY NET ABSORPTION NEW CONSTRUCTION UNDER CONSTRUCTION *Projected
- 2. IDM Capital purchased 9 flex/warehouse buildings totaling 935,255 SF at 3501 Ed Bluestein Blvd. The seller was JLM Financial Investments. The sale price was not disclosed. Industrial Property Trust purchased 244,161 SF at Tuscany Center at Walnut Creek, buildings 6, 7 and 8. The property, located at 8520 Tuscany Way, was sold by Crow Holdings for an undisclosed amount. Tuscany Center at Walnut Creek Job Growth & Unemployment (not seasonally adjusted) UNEMPLOYMENT 08/14 08/15 AUSTIN 3.9% 2.8% TEXAS 5.3% 4.4% U.S. 6.3% 5.2% JOB GROWTH Annual Change # of Jobs Added AUSTIN 3.4% 31.1K TEXAS 1.8% 212.4K U.S. 2.1% 3.1M 2 Austin Research & Forecast Report | Q3 2015 | Industrial | Colliers International Sales Activity Sources: Real Capital Analytics Q3 2015 No. of Properties: 9 Total SF: 1.8M Average $/SF: $80.26/SF Average Cap Rate: Unknown 3501 Ed Bluestein Blvd. Vacancy & Availability Austin’s citywide vacancy rate dropped 70 basis points over the quarter from 9.2% to 8.5%. The lowest recorded vacancy in Q3 was in the Northwest submarket, where vacancy dropped to 2.2% from 7.3% in Q2. The North submarket also saw a large decrease in vacancy over the quarter with a drop from 8.3% to 6.1%. Among the major industrial submarkets, the Far Northeast submarket saw the largest increase in vacancy, rising from 8.5% to 9.8% over the quarter. The Far Northwest, Central, East and Southeast also saw a rise in vacancy over the quarter. Austin’s industrial pipeline had 281,100 SF of projects underway at the end of the third quarter including Harris Ridge Business Center in the Far Northeast submarket. Three buildings delivered over the quarter in the Southeast submarket totaling 399,205 SF. 0.0% 2.0% 4.0% 6.0% 8.0% 10.0% 12.0% 14.0% 16.0% 18.0% 20.0% $5.00 $5.50 $6.00 $6.50 $7.00 $7.50 $8.00 $8.50 $9.00 $9.50 Industrial Rental Rate and Vacancy Percentage Austin, TX Avg Quoted Rent Avg Vacancy *Vacancy percentage includes direct and sublease space. Absorption & Demand Austin’s industrial market posted 695,013 SF of positive net absorption in the second quarter, which is the second largest amount of absorption ever recorded in the Austin metro area behind last quarter, according to CoStar. The North submarket posted the largest amount of positive net absorption with 298,476 SF. The Southeast submarket also saw an increase in positive net absorption with 171,938 SF posted in the third quarter. The submarket that posted the greatest negative absorption over the quarter was the Far Northeast submarket with 29,850 SF. Rental Rates According to CoStar, our data service provider, the citywide average rental rate increased again in Q3 to an average rate of $8.95 per SF NNN, continuing a steady rise in rental rates since Q2 2009. The highest average rental rate at the end of the third quarter was in the Southwest submarket at $14.03 per SF NNN. The second highest rental rates were in the Far Northwest submarket at $11.00 per SF NNN, which has remained unchanged in 2015. In the Northwest submarket where vacancy dropped drastically in Q3, rents rose from $6.61 per SF NNN in Q2 to $9.12 per SF NNN in Q3. The second largest increase in average rental rate occured in the Hays County submarket, where rents increased from $5.84 per SF NNN to $7.65 per SF NNN over the quarter. Average rental rates for flex/R&D space dropped slightly over the quarter from $11.52 per SF NNN to $11.23 per SF NNN. Average rental rates for warehouse/ distribution space rose again for the 7th consecutive quarter, to $7.06 per SF NNN.
- 3. 3 Austin Research & Forecast Report | Q3 2015 | Industrial | Colliers International33 Q3 2015 Top Industrial Lease Transactions BUILDING NAME/ADDRESS SUBMARKET SF TENANT LEASE DATE 6301 E Stassney - Expo 10 Southeast 152,805 Education Testing Services Jul-15 2400 Grand Parkway - Vista Park North 57,750 Kodiak Assembly Solutions, LLC Jul-15 401C Parker Dr. North 57,600 Capitol Beverage Sep-15 2130 Woodward St Southeast 36,000 Thermo Fisher Scientific Inc.1 Jul-15 12317 Technology Blvd Northwest 24,519 U-Haul Jul-15 9330 United Dr. North 23,060 Pump It Up1 Sep-15 2105 Denton - Rutland Business Park North 22,206 Carisi Inc. Jul-15 9801 Metric Blvd North 21,600 Trane1 Sep-15 4807 Commercial Park Dr. East 10,062 UpRev Jul-15 Leasing Activity Austin’s industrial leasing activity recorded 405,602 square feet in Q3 2015. Expo Business Park in the Southeast submarket accounts for 152,805 SF of leased space for Education Testing Services. 1 Renewal 2 Expansion 3 Sublease 4 Pre-lease/proposed or under construction AUSTIN INDUSTRIAL MARKET STATISTICAL SUMMARY Q3 2015 Market # Bldgs Rentable Area Direct Vacant SF Direct Vacancy Rate Sublet Vacant SF Sublet Vacancy Rate Total Vacant SF Total Vacancy Rate 3Q15 Net Absorption 2Q15 Net Absorption 3Q2015 Comple- tions 2Q15 Comple- tions SF Under Construc- tion Austin Total 789 48,118,520 3,888,512 8.1% 223,550 0.5% 4,112,062 8.5% 695,013 899,852 399,205 207,008 281,100 Central 32 1,152,201 99,770 8.7% 1,019 0.1% 100,789 8.7% (12,423) (1,511) - - - East 66 2,789,268 167,910 6.0% 57,461 2.1% 225,371 8.1% (9,181) 2,407 - Far Northeast 35 2,405,834 235,341 9.8% - 0.0% 235,341 9.8% (29,850) 168,991 153,000 Far Northwest 17 777,361 82,499 10.6% - 0.0% 82,499 10.6% (6,275) 2,930 - - - Hays County 37 2,244,854 234,119 10.4% 13,800 0.6% 247,919 11.0% 20,429 133,824 - 162,470 - North 215 13,495,226 763,558 5.7% 55,429 0.4% 818,987 6.1% 298,476 111,863 - - - Northeast 112 7,739,653 829,433 10.7% 13,000 0.2% 842,433 10.9% 44,944 369,357 - 44,538 20,500 Northwest 30 2,663,637 46,482 1.7% 11,084 0.4% 57,566 2.2% 137,035 21,600 - - - Round Rock 46 2,375,596 230,847 9.7% - 0.0% 230,847 9.7% 77,920 12,928 - - 50,000 South 36 1,677,992 51,517 3.1% 11,437 0.7% 62,954 3.8% 2,000 242 - - - Southeast 158 10,586,867 1,106,666 10.5% 52,820 0.5% 1,159,486 11.0% 171,938 79,721 399,205 - 57,600 Southwest 5 210,031 40,370 19.2% 7,500 3.6% 47,870 22.8% - (2,500) - - Austin Industrial Market Summary
- 4. 4 Austin Research & Forecast Report | Q2 2015 | Office | Colliers International4 North American Research & Forecast Report | Q4 2014 | Office Market Outlook | Colliers International Copyright © 2015 Colliers International. The information contained herein has been obtained from sources deemed reliable. While every reasonable effort has been made to ensure its accuracy, we cannot guarantee it. No responsibility is assumed for any inaccuracies. Readers are encouraged to consult their professional advisors prior to acting on any of the material contained in this report. Colliers International | Market 000 Address, Suite # 000 Address, Suite # +1 000 000 0000 colliers.com/<<market>> 4 North American Research & Forecast Report | Q4 2014 | Office Market Outlook | Colliers International Copyright © 2015 Colliers International. The information contained herein has been obtained from sources deemed reliable. While every reasonable effort has been made to ensure its accuracy, we cannot guarantee it. No responsibility is assumed for any inaccuracies. Readers are encouraged to consult their professional advisors prior to acting on any of the material contained in this report. Colliers International | Austin 515 Congress Avenue, Suite 1700 Austin, Texas 78701 +1 512 539 3000 colliers.com/texas/austin FOR MORE INFORMATION Broker Contacts: Travis Hicks Vice President | Austin +1 512 539 3005 travis.hicks@colliers.com Bentley Smith Associate | Austin +1 512 539 3007 bentley.smith@colliers.com Research Contact: Hannah Tysor Senior Marketing & Research Coordinator | Houston & Austin +1 713 830 2192 hannah.tysor@colliers.com 281K SF BUILDING ADDRESS SUBMARKET RBA % LEASED DEVELOPER ESTIMATED DELIVERY DATE BUILDING DESCRIPTION Harris Ridge Business Center 1100 E Howard Ln. - Bldg 5 Far Northeast 153,000 0.0% HPI Development Mar-16 Industrial Warehouse Mustang Creek Industrial Park 197 Edmond Round Rock 50,000 0.0% Taylor EDC Oct-15 Industrial Warehouse 6301 E Stassney Ln - Expo 12 Southeast 57,600 66.0% Trammel Crow Sep-16 Industrial Warehouse 9503 Brown Ln - Bldg 4 Northeast 20,500 100.0% Dalton Mar-16 BTS Q3 2015 Industrial Under Construction - 20,000 SF or greater delivered inventory 399ksf 132 8. 48.1 Million SF TOTAL INDUSTRIAL INVENTORY XM SF Q3 2015 Highlights 695,013 SF Net Absorption Down from 899,852 SF in Q2 19.8% Annual 4.2% Quarterly RENTAL RATES Up to $8.95 from $7.47 in Q3 2014