1. 10
INDUSTRI AL INDEX
INDUSTRIALINDEX
Total Total
NPI Industrial East Midwest South West
3rd Q 2015 3.09 3.67 3.18 3.26 3.60 3.97
2nd Q 2015 3.14 3.78 3.45 3.49 3.66 4.01
One Year 13.48 15.64 14.24 14.48 14.66 16.84
Three Years 11.91 13.23 12.56 11.65 13.09 13.94
Five Years 12.55 13.22 12.15 11.57 12.55 14.43
Ten Years 8.02 7.95 7.16 6.10 7.64 8.98
Twenty Years 9.81 10.18 10.01 8.08 8.83 11.61
INDUSTRIAL TOTAL RETURNS
Total Total
NPI Industrial East Midwest South West
3rd Q 2015 1.22 1.35 1.47 1.47 1.45 1.24
2nd Q 2015 1.26 1.35 1.45 1.49 1.47 1.22
One Year 5.11 5.55 5.85 6.21 6.08 5.06
Three Years 5.40 5.84 6.34 6.32 6.29 5.33
Five Years 5.67 6.11 6.52 6.53 6.45 5.68
Ten Years 5.82 6.34 6.72 6.75 6.67 5.92
Twenty Years 7.08 7.59 7.93 7.89 7.76 7.31
INDUSTRIAL INCOME RETURNS
Total Total
NPI Industrial East Midwest South West
3rd Q 2015 1.86 2.32 1.70 1.79 2.14 2.73
2nd Q 2015 1.89 2.43 2.00 2.00 2.18 2.80
One Year 8.07 9.69 8.05 7.91 8.21 11.36
Three Years 6.25 7.09 5.94 5.10 6.50 8.28
Five Years 6.60 6.81 5.37 4.81 5.83 8.40
Ten Years 2.11 1.53 0.42 -0.62 0.91 2.93
Twenty Years 2.59 2.45 1.97 0.18 1.00 4.08
INDUSTRIAL CAPITAL APPRECIATION RETURNS
5TH PERCENTILE LOWER MEDIAN UPPER 95TH PERCENTILE
ONE-YEAR RETURNS
45
40
35
30
25
20
15
10
5
0
-5
-10
-15
-20
-25
-30
-35
-40
-45
45
40
35
30
25
20
15
10
5
0
-5
-10
-15
-20
-25
-30
-35
-40
-45
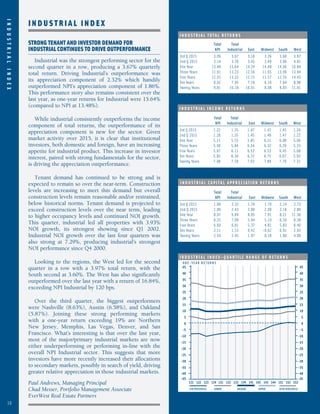
INDUSTRIAL INDEX—QUARTILE RANGE OF RETURNS
121 122 123 124 131 132 133 134 141 142 143 144 151 152 153
STRONG TENANT AND INVESTOR DEMAND FOR
INDUSTRIAL CONTINUES TO DRIVE OUTPERFORMANCE
Industrial was the strongest performing sector for the
second quarter in a row, producing a 3.67% quarterly
total return. Driving Industrial’s outperformance was
its appreciation component of 2.32% which handily
outperformed NPI’s appreciation component of 1.86%.
This performance story also remains consistent over the
last year, as one-year returns for Industrial were 15.64%
(compared to NPI at 13.48%).
While industrial consistently outperforms the income
component of total returns, the outperformance of its
appreciation component is new for the sector. Given
market activity over 2015, it is clear that institutional
investors, both domestic and foreign, have an increasing
appetite for industrial product. This increase in investor
interest, paired with strong fundamentals for the sector,
is driving the appreciation outperformance.
Tenant demand has continued to be strong and is
expected to remain so over the near-term. Construction
levels are increasing to meet this demand but overall
construction levels remain reasonable and/or restrained,
below historical norms. Tenant demand is projected to
exceed construction levels over the near term, leading
to higher occupancy levels and continued NOI growth.
This quarter, industrial led all properties with 3.93%
NOI growth, its strongest showing since Q1 2002.
Industrial NOI growth over the last four quarters was
also strong at 7.29%, producing industrial’s strongest
NOI performance since Q4 2000.
Looking to the regions, the West led for the second
quarter in a row with a 3.97% total return, with the
South second at 3.60%. The West has also significantly
outperformed over the last year with a return of 16.84%,
exceeding NPI Industrial by 120 bps.
Over the third quarter, the biggest outperformers
were Nashville (8.63%), Austin (6.58%), and Oakland
(5.87%). Joining these strong performing markets
with a one-year return exceeding 19% are Northern
New Jersey, Memphis, Las Vegas, Denver, and San
Francisco. What’s interesting is that over the last year,
most of the major/primary industrial markets are now
either underperforming or performing in-line with the
overall NPI Industrial sector. This suggests that more
investors have more recently increased their allocations
to secondary markets, possibly in search of yield, driving
greater relative appreciation in those industrial markets.
Paul Andrews, Managing Principal
Chad Messer, Portfolio Management Associate
EverWest Real Estate Partners