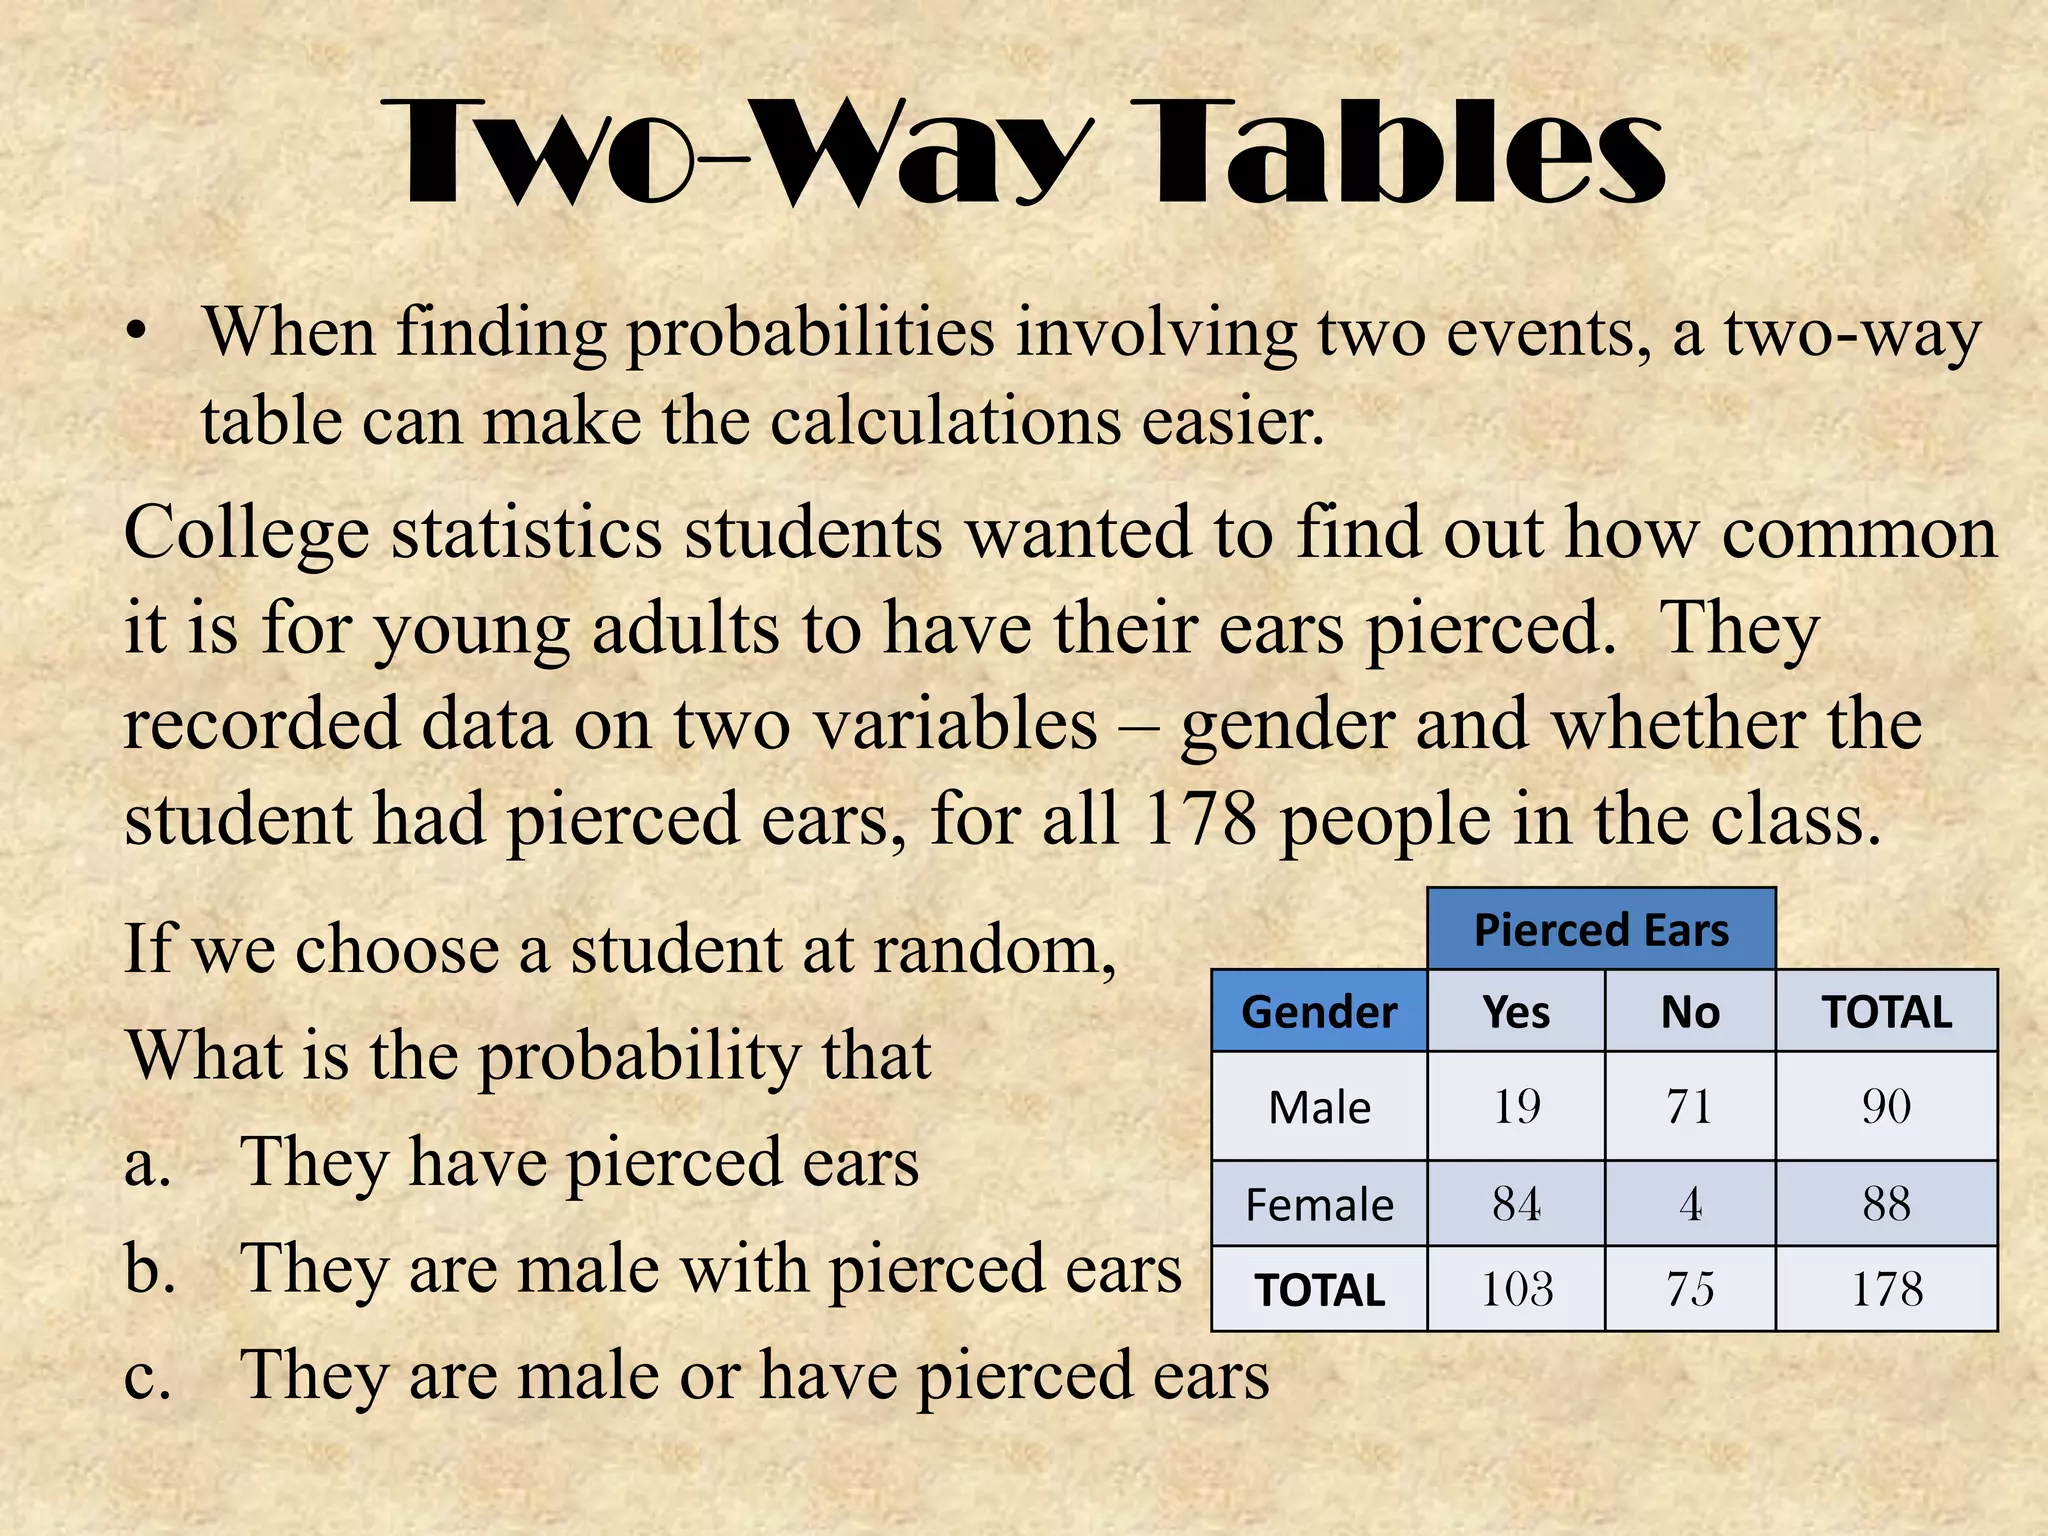
Two-Way Tables
• When finding probabilities involving two events, a two-way
table can make the calculations easier.

College statistics students wanted to find out how common
it is for young adults to have their ears pierced. They
recorded data on two variables – gender and whether the
student had pierced ears, for all 178 people in the class.
If we choose a student at random,
Gender
What is the probability that
Male
a. They have pierced ears
Female
b. They are male with pierced ears TOTAL
c. They are male or have pierced ears

Pierced Ears
Yes

No

TOTAL

19

71

90

84

4

88

103

75

178
Venn-Diagrams
• If events A and B are not mutually exclusive, they can occur
together
• The probability that one or the other occurs is less than the
sum of their probabilities
Venn-Diagrams
• A Venn diagram takes of the double counting problem using
the General Addition Rule of Two Events:
P(A or B) = P(A) + P(B) – P (A and B)
If two events are mutually exclusive, the P(A and B) = 0
- This is just a special case of the addition rule
since P(A and B) = 0, we are subtracting nothing
P(A or B) = P(A) + P(B)
Venn-Diagrams
Vocabulary and Standard Notation:
• The complement of an event AC contains
the outcomes that are not in A

• Events A and B are mutually
exclusive (disjoint) if they do
not overlap, that have no
outcomes in common.
Venn-Diagrams
Vocabulary and Standard Notation:
• The event A and B is the intersection
of A and B, and it is notated as
A∩B

• The event A or B is the union of
A and B, and it is notated as
AUB
Venn-Diagrams
The notation that will be used on the AP Exam that is also on
the equation sheet:
P(A U B) = P(A) + P(B) – P(A ∩ B)
or
and
• A U B represents union (or)
• A ∩ B represents intersection (and)
Pg. 306-307

Two way tables & venn diagrams

  • 1.
    Two-Way Tables • Whenfinding probabilities involving two events, a two-way table can make the calculations easier. College statistics students wanted to find out how common it is for young adults to have their ears pierced. They recorded data on two variables – gender and whether the student had pierced ears, for all 178 people in the class. If we choose a student at random, Gender What is the probability that Male a. They have pierced ears Female b. They are male with pierced ears TOTAL c. They are male or have pierced ears Pierced Ears Yes No TOTAL 19 71 90 84 4 88 103 75 178
  • 2.
    Venn-Diagrams • If eventsA and B are not mutually exclusive, they can occur together • The probability that one or the other occurs is less than the sum of their probabilities
  • 3.
    Venn-Diagrams • A Venndiagram takes of the double counting problem using the General Addition Rule of Two Events: P(A or B) = P(A) + P(B) – P (A and B) If two events are mutually exclusive, the P(A and B) = 0 - This is just a special case of the addition rule since P(A and B) = 0, we are subtracting nothing P(A or B) = P(A) + P(B)
  • 4.
    Venn-Diagrams Vocabulary and StandardNotation: • The complement of an event AC contains the outcomes that are not in A • Events A and B are mutually exclusive (disjoint) if they do not overlap, that have no outcomes in common.
  • 5.
    Venn-Diagrams Vocabulary and StandardNotation: • The event A and B is the intersection of A and B, and it is notated as A∩B • The event A or B is the union of A and B, and it is notated as AUB
  • 6.
    Venn-Diagrams The notation thatwill be used on the AP Exam that is also on the equation sheet: P(A U B) = P(A) + P(B) – P(A ∩ B) or and • A U B represents union (or) • A ∩ B represents intersection (and) Pg. 306-307