Downloaded 761 times


This document discusses key concepts in research methods. It defines what constitutes a science, including being based on empirical evidence, being objective and falsifiable. It also discusses peer review which ensures research quality, and some of its limitations. Different research designs are examined like experiments, observations and surveys. Ethical issues in research and ways to address them are outlined. The document also covers reliability and validity, important considerations in research quality. Sampling methods and their pros and cons are defined. Finally, it provides guidance on how to structure answers when discussing research methods concepts or studies.
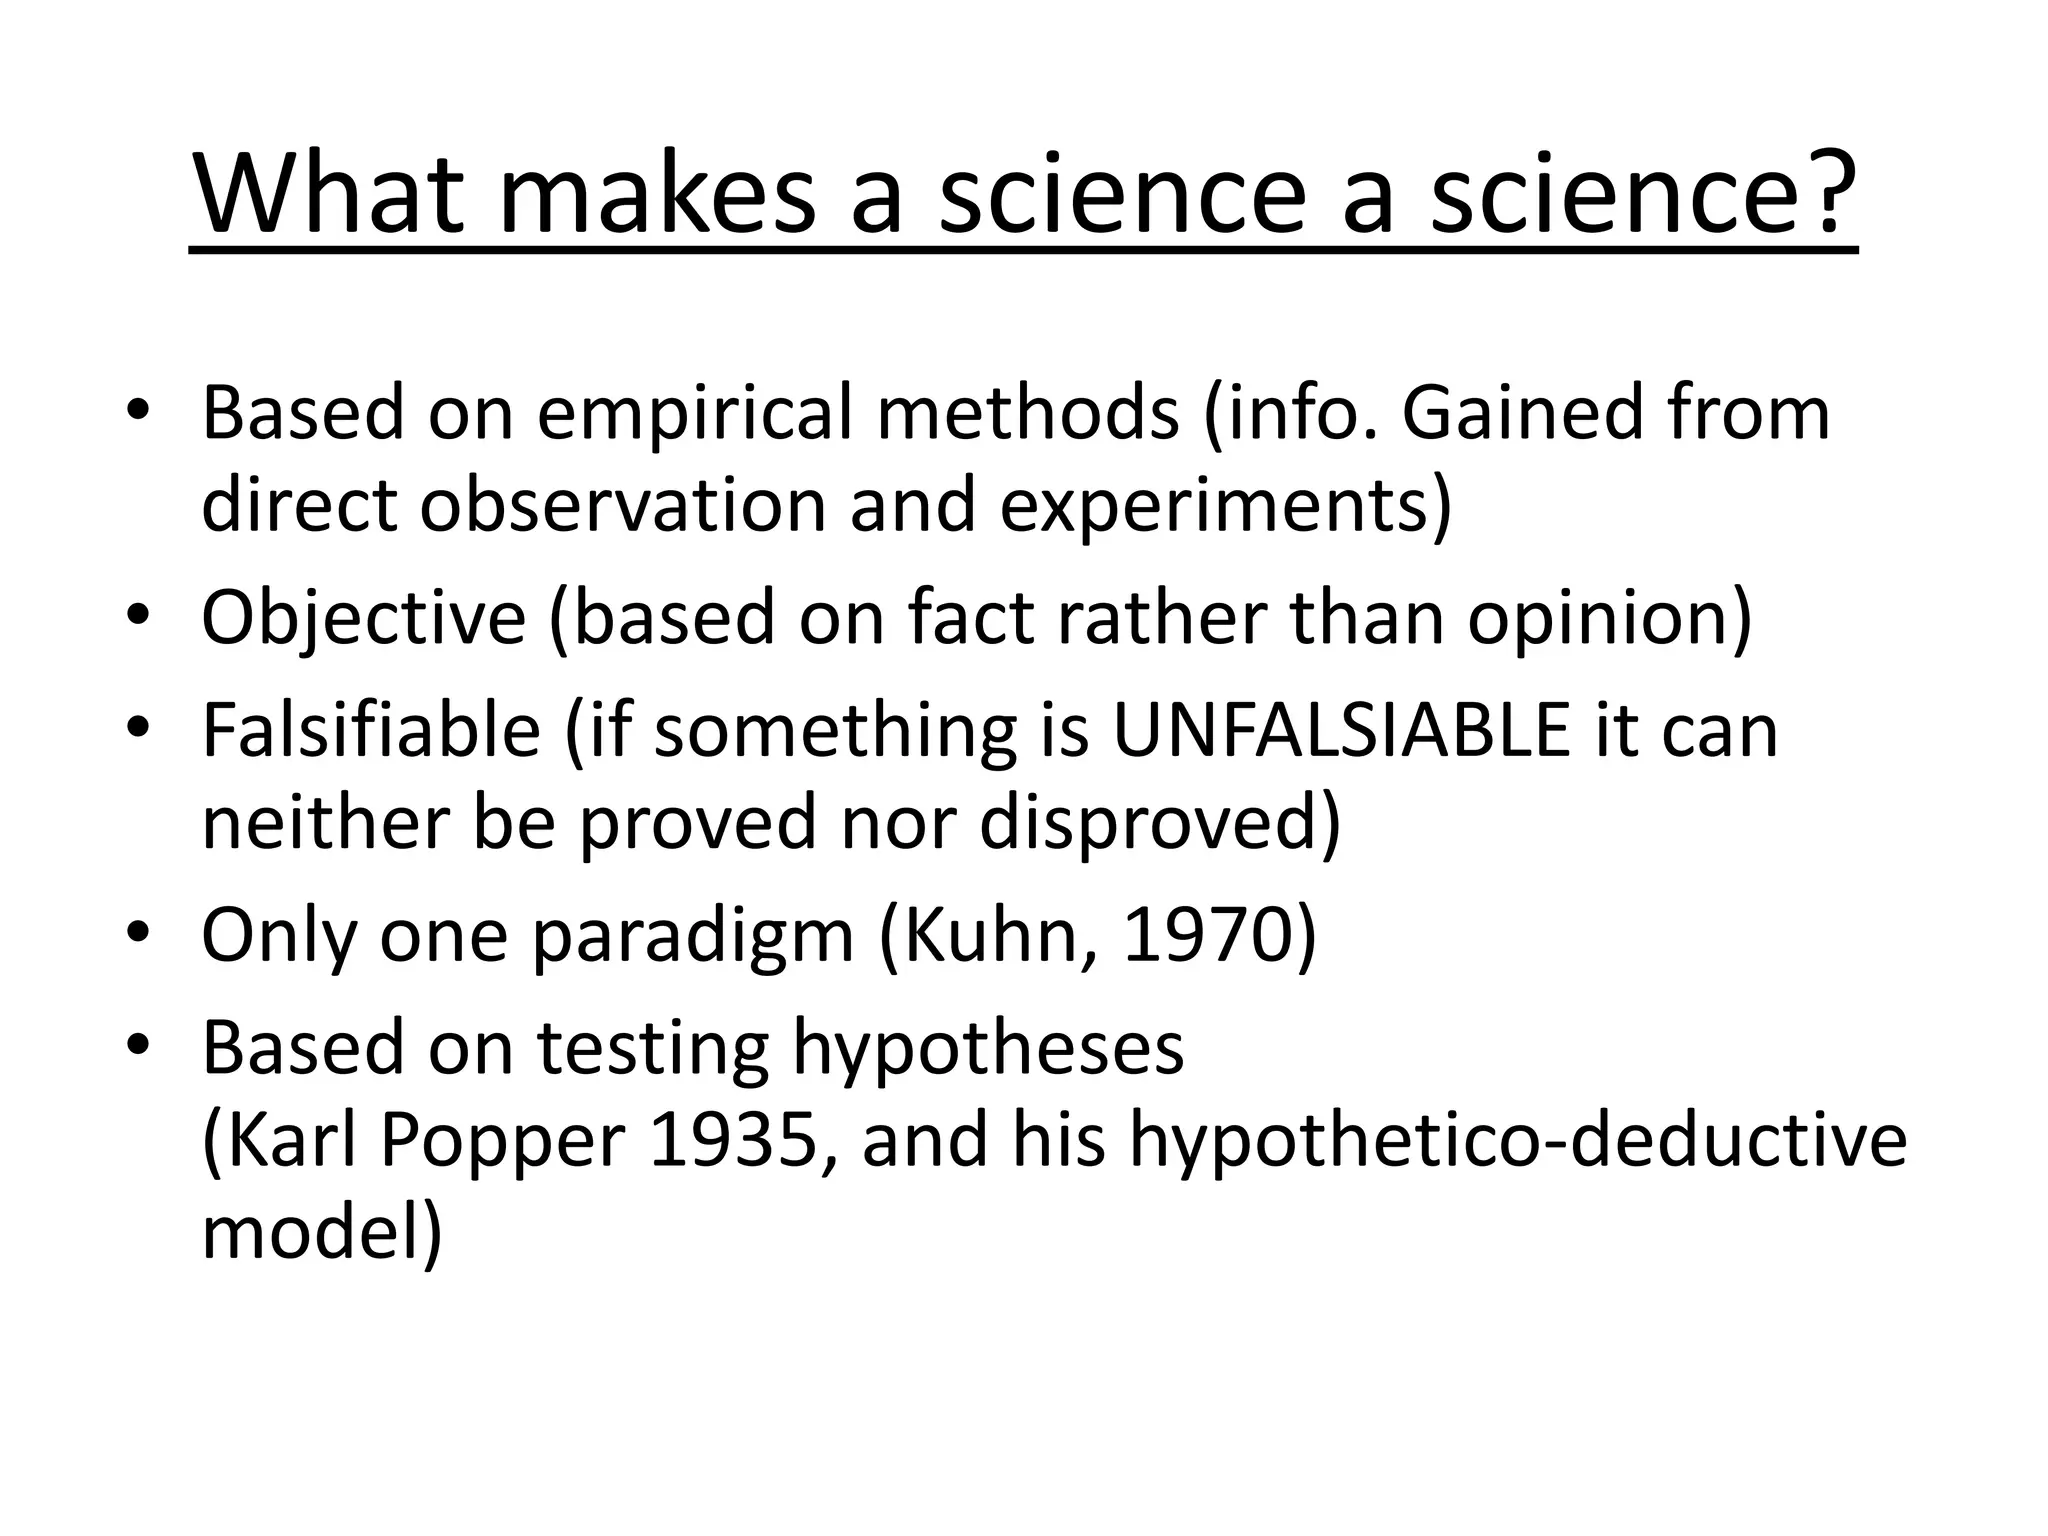
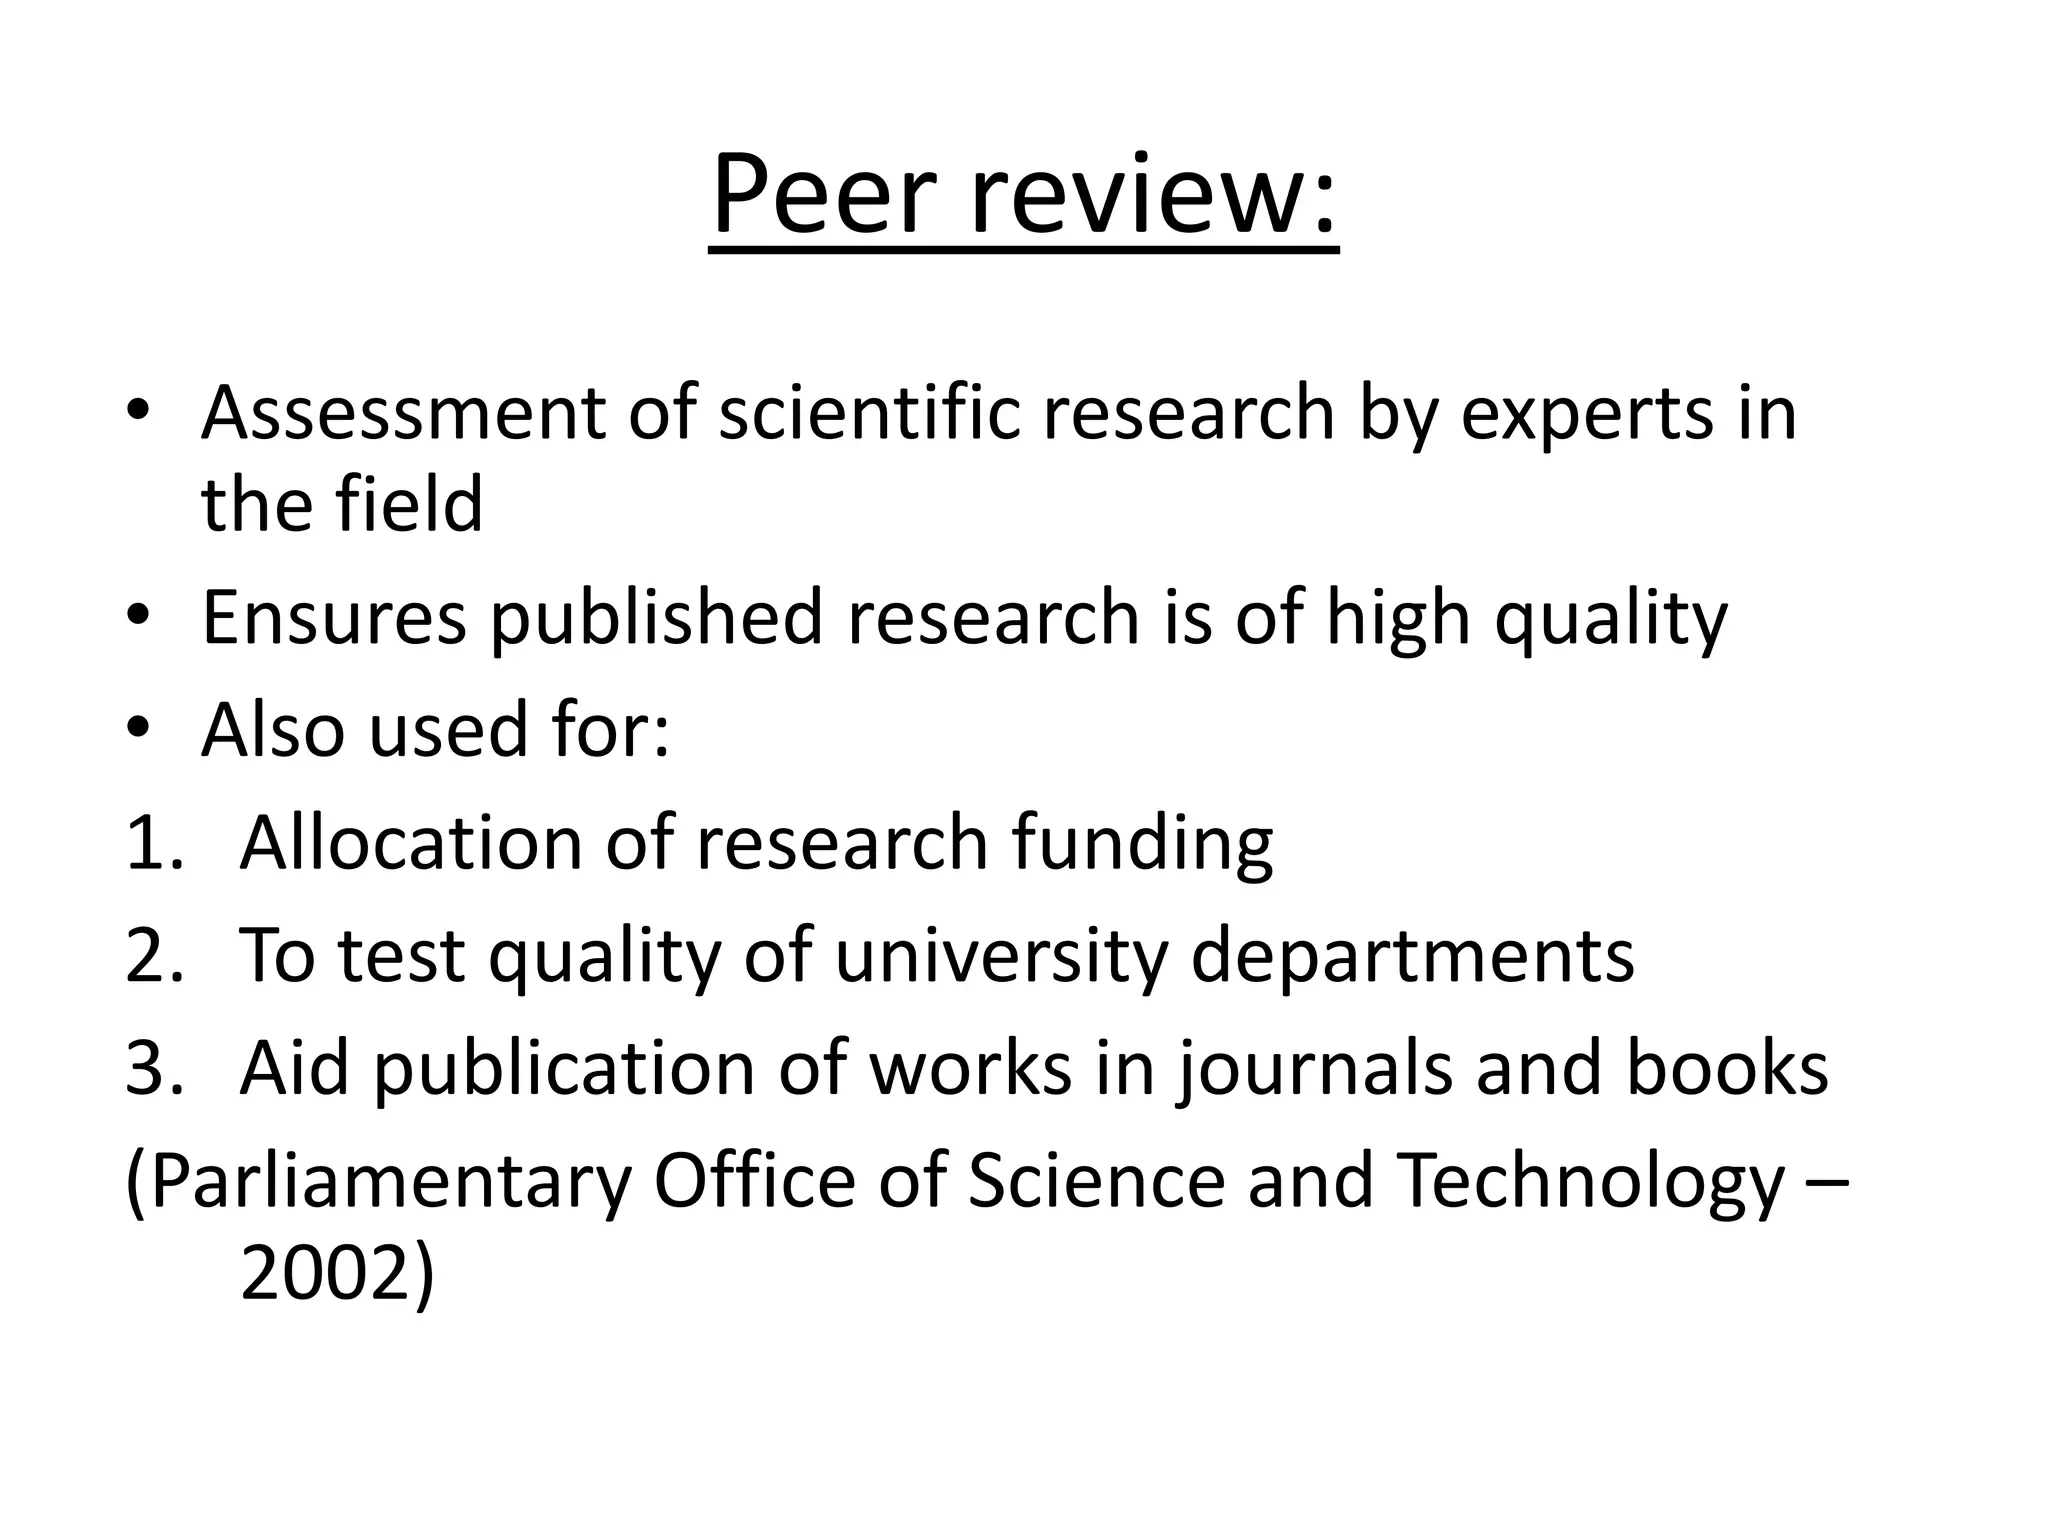
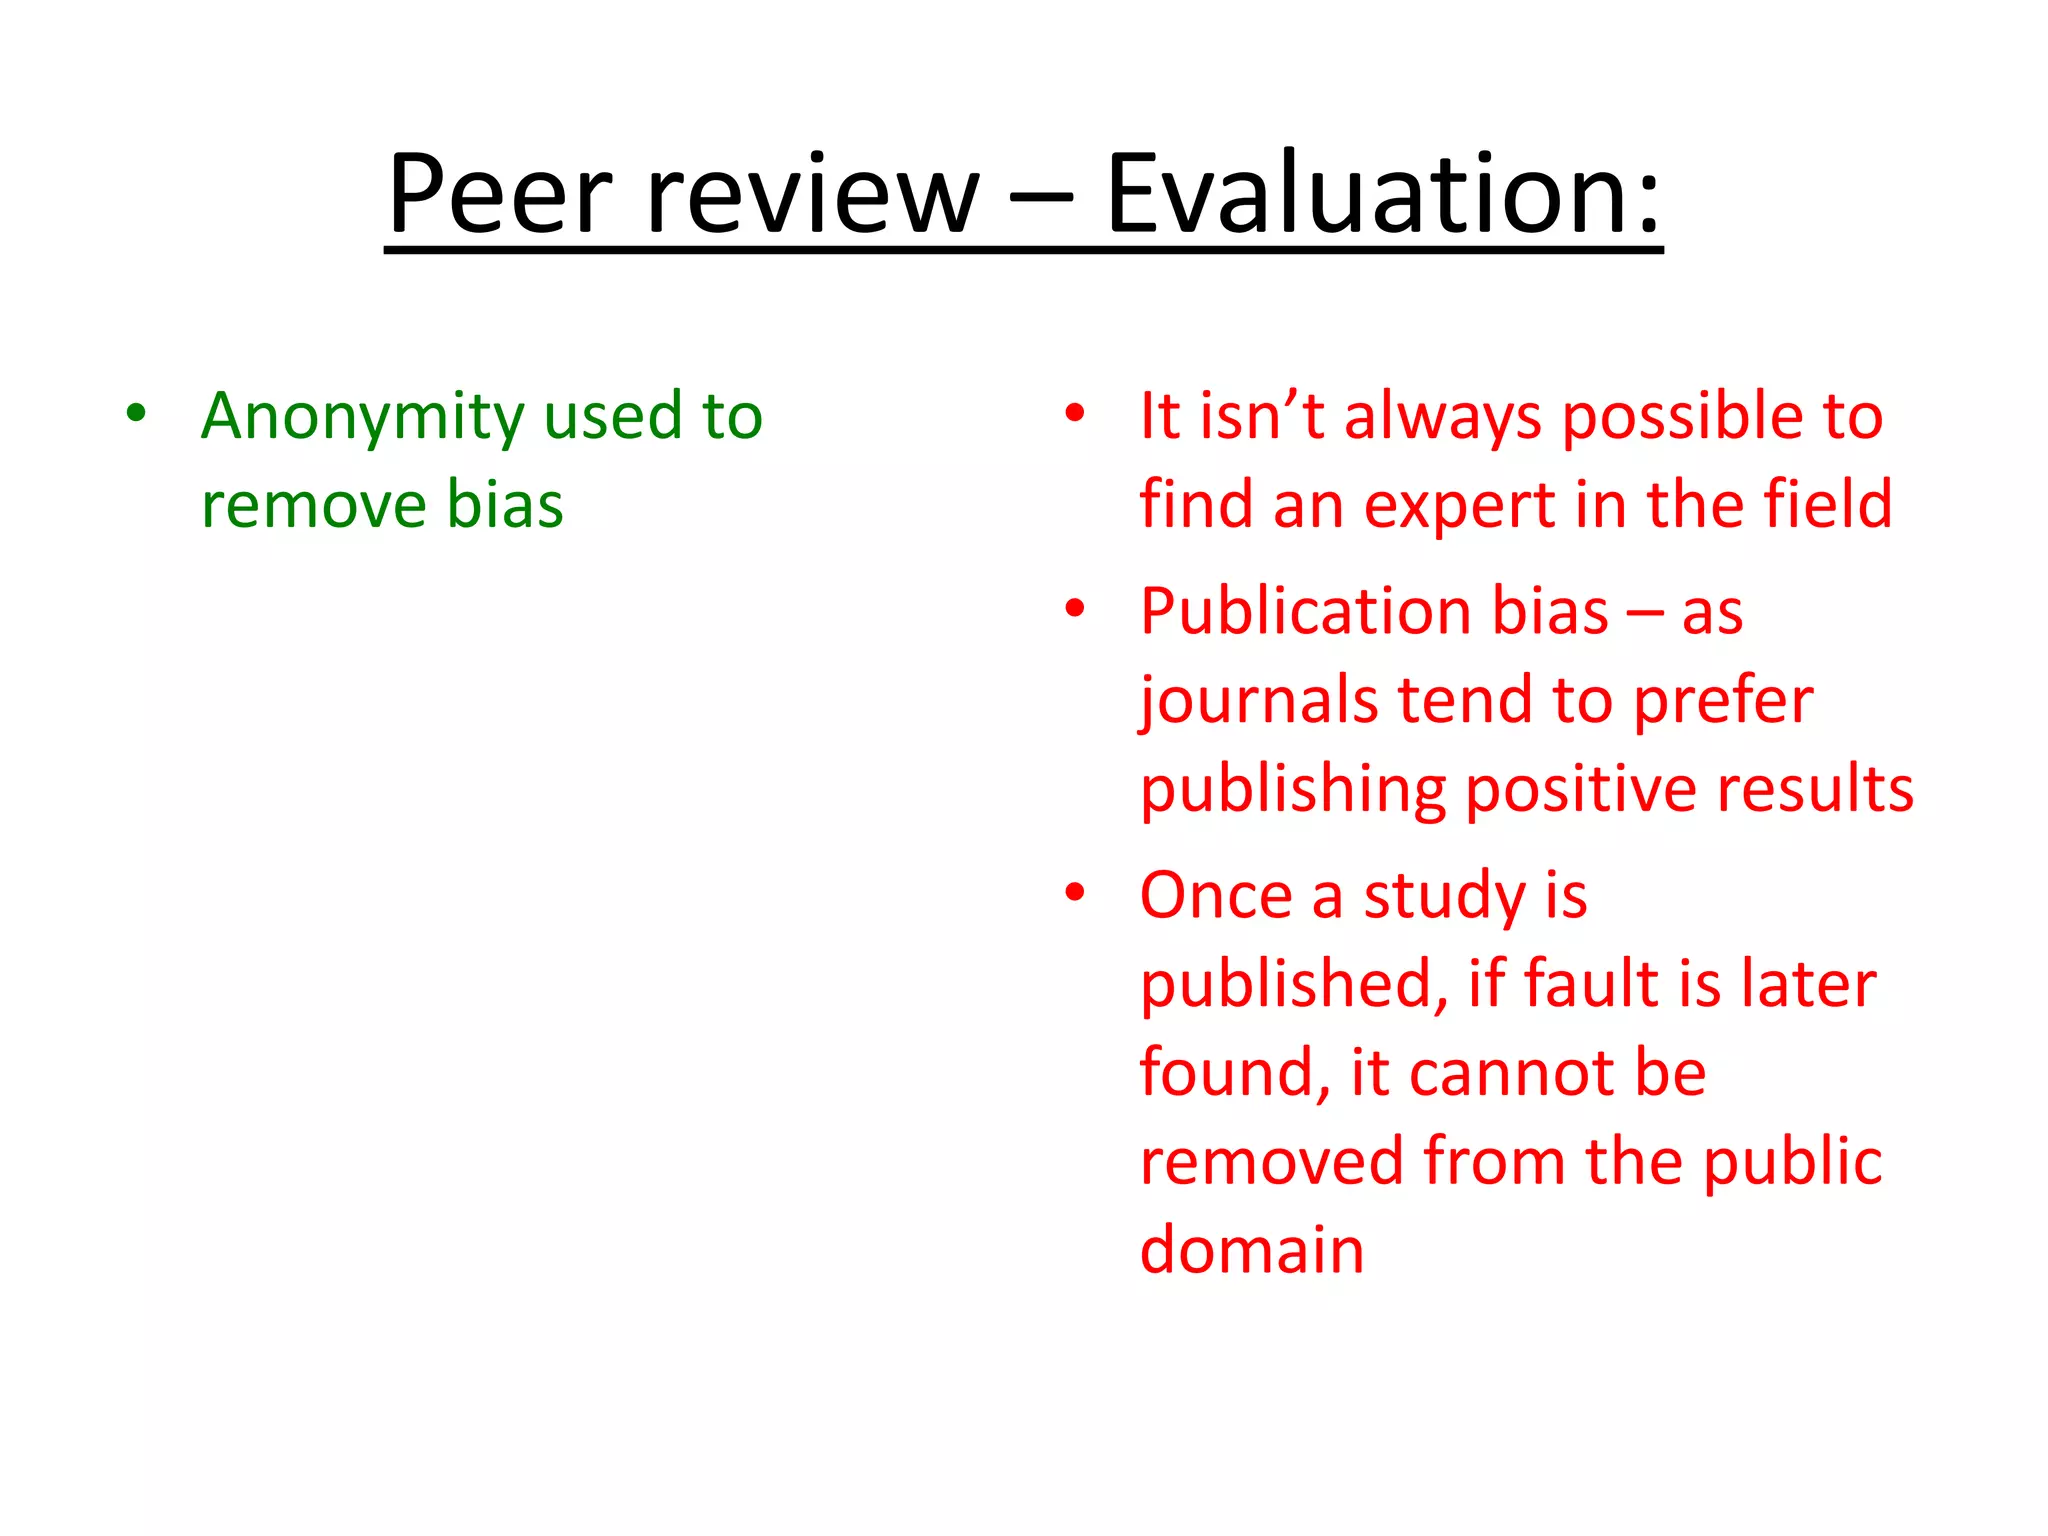
Overview of research methods, defining science, peer review processes, and evaluation criteria.
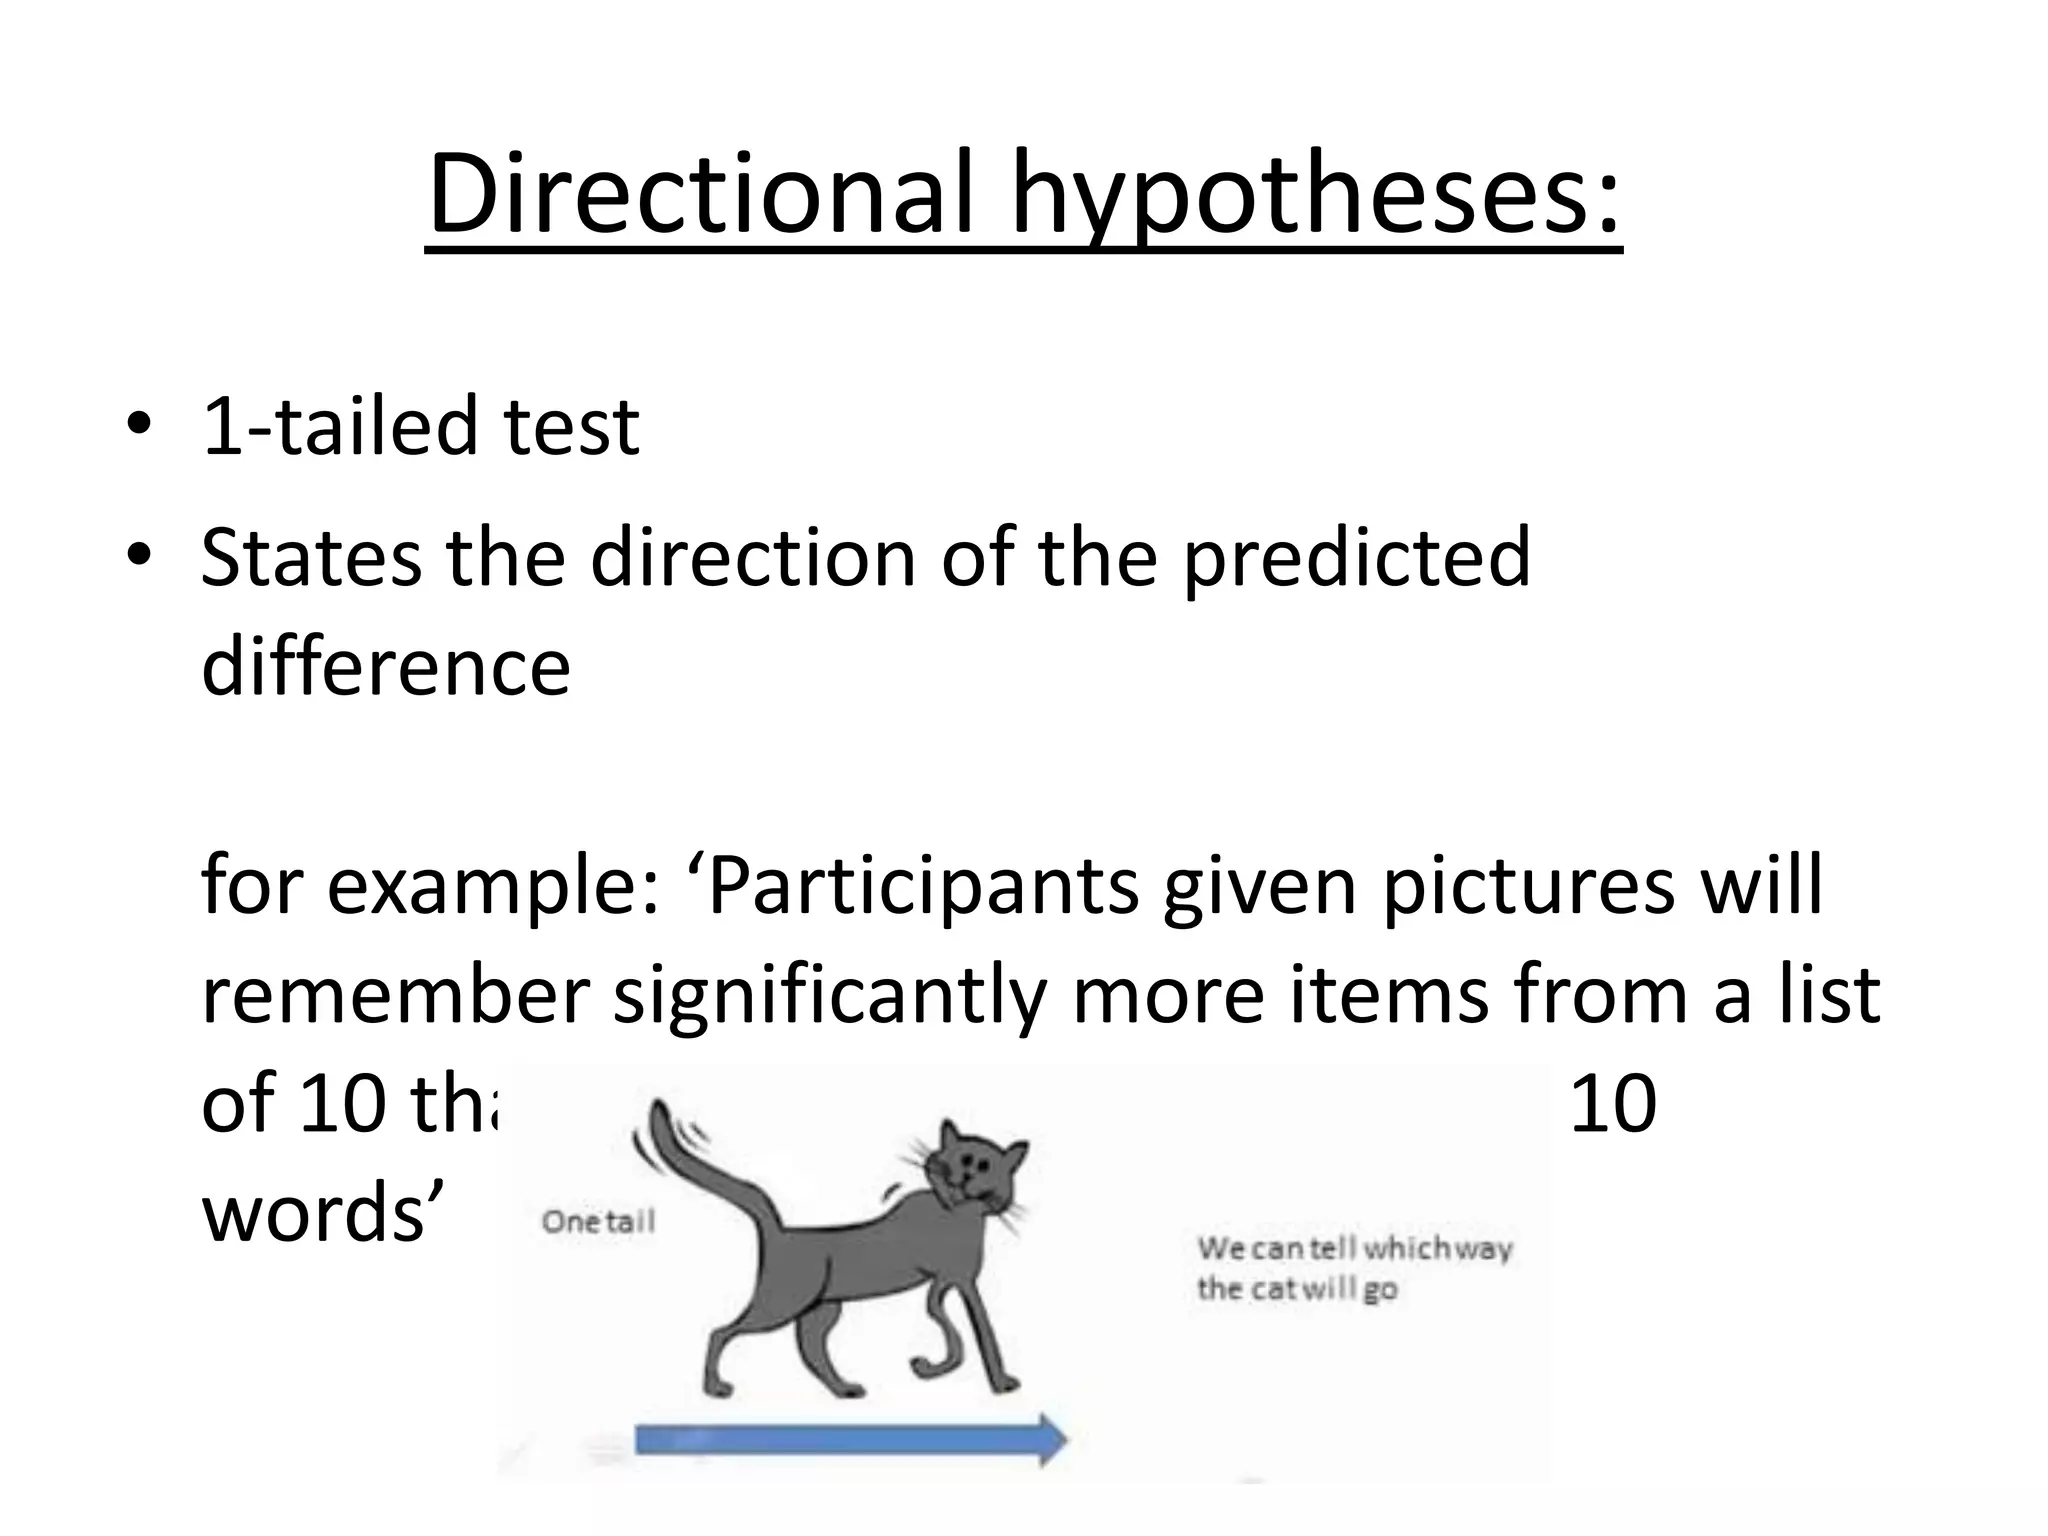
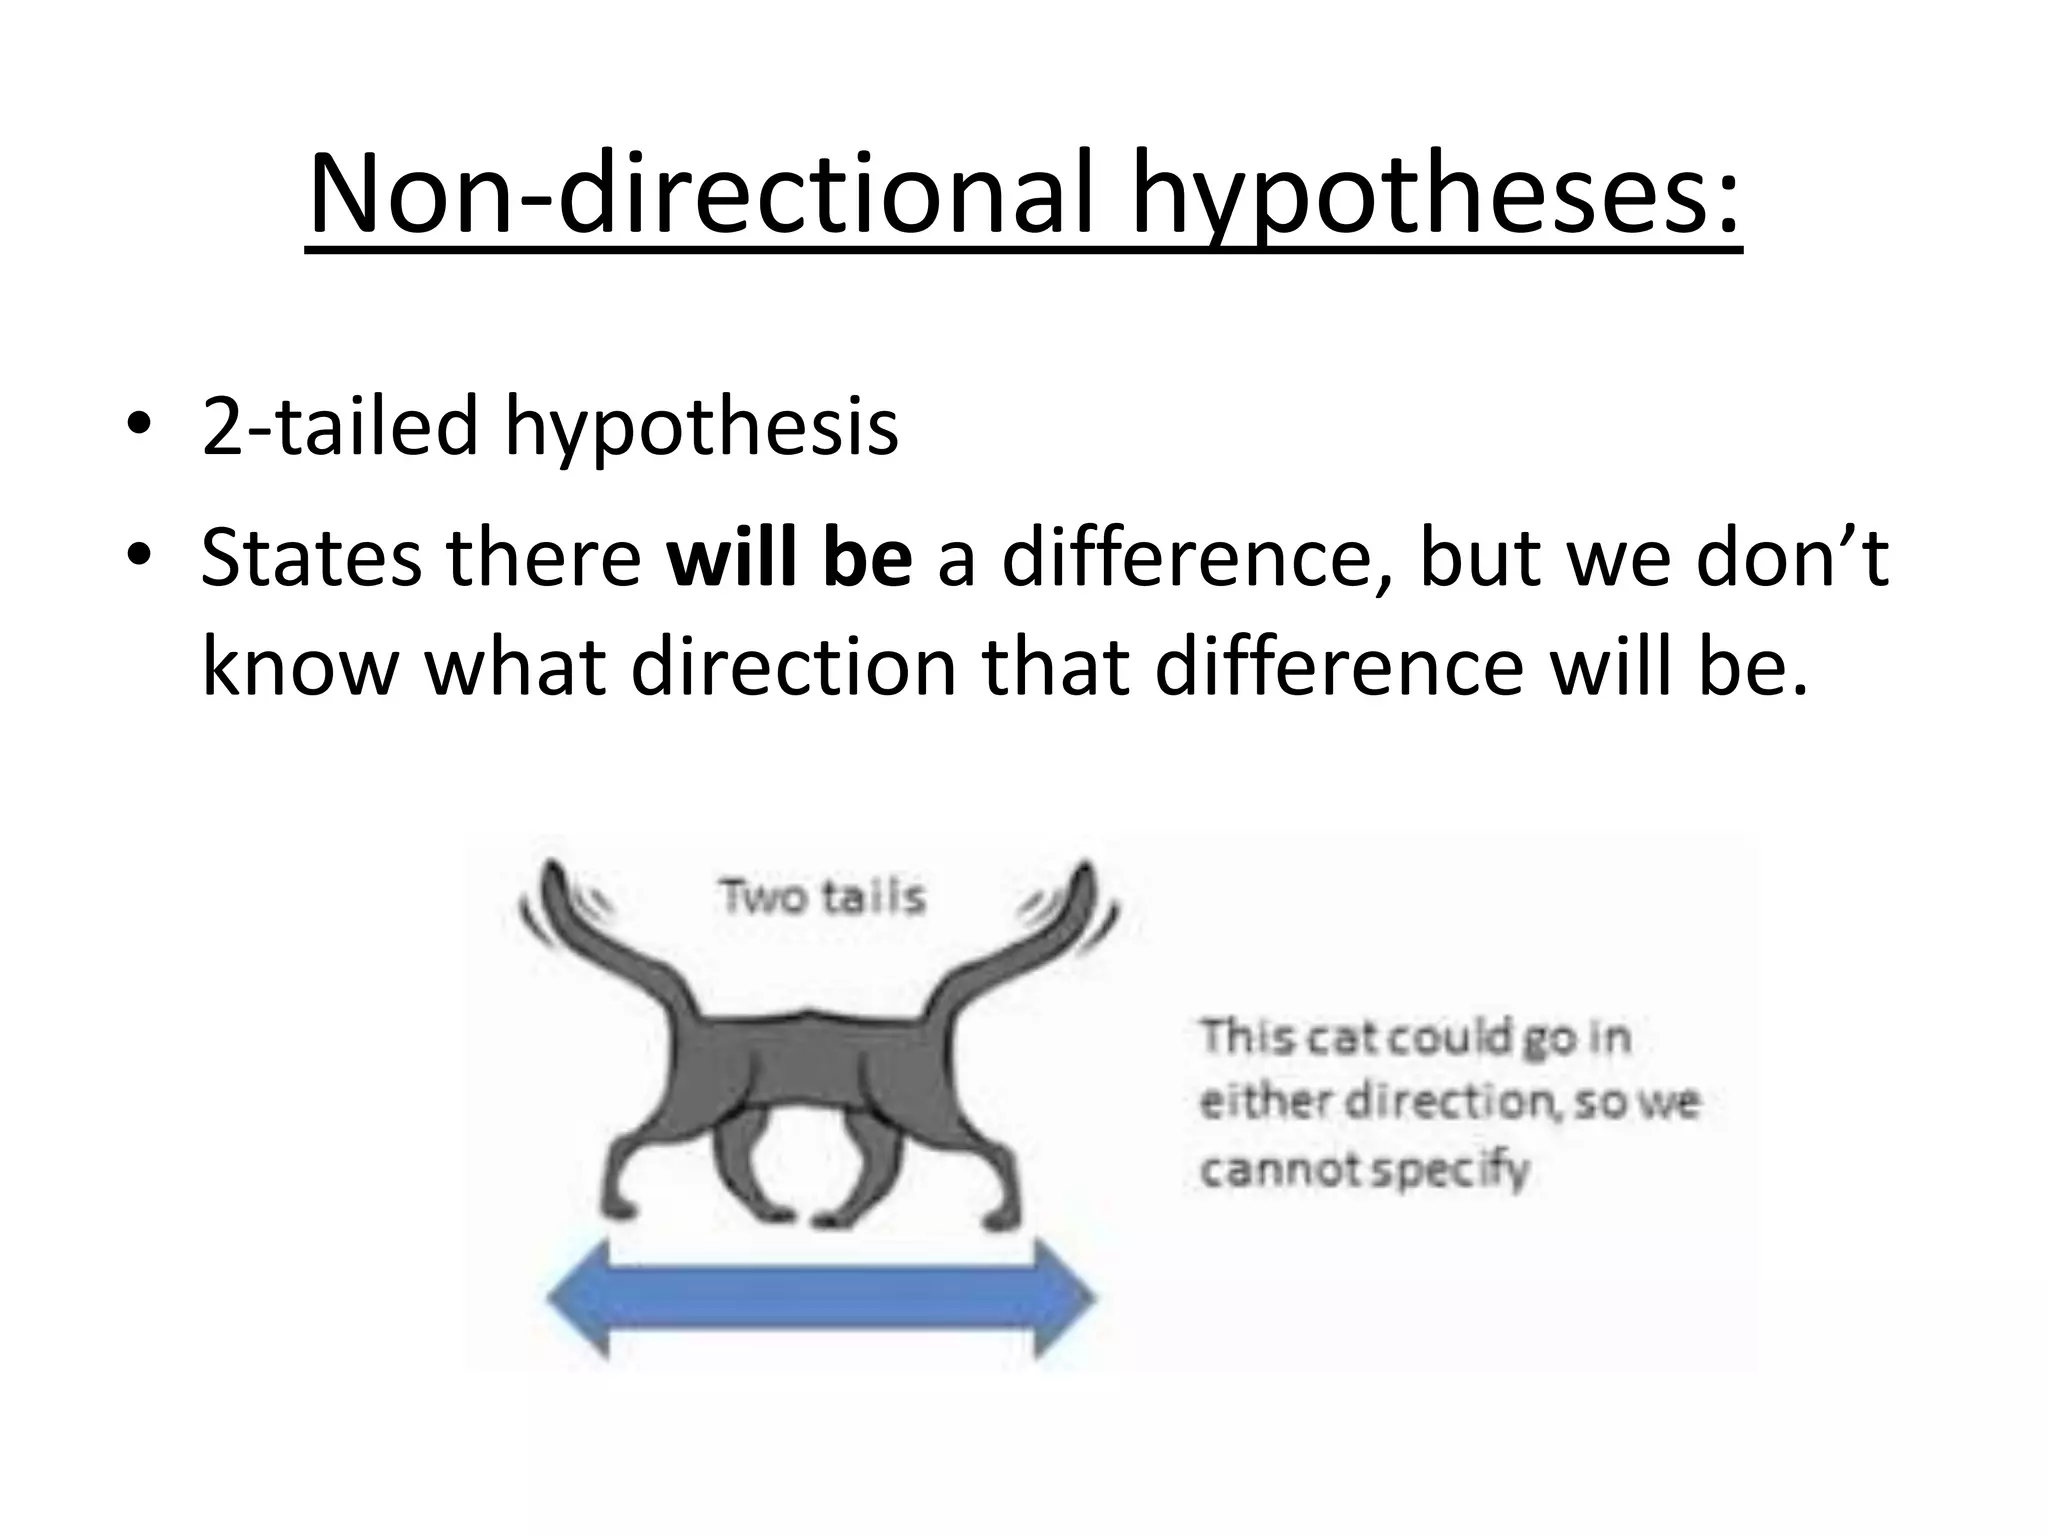
Definition of aims, theories, and types of hypotheses (null, directional, non-directional), and their significance.
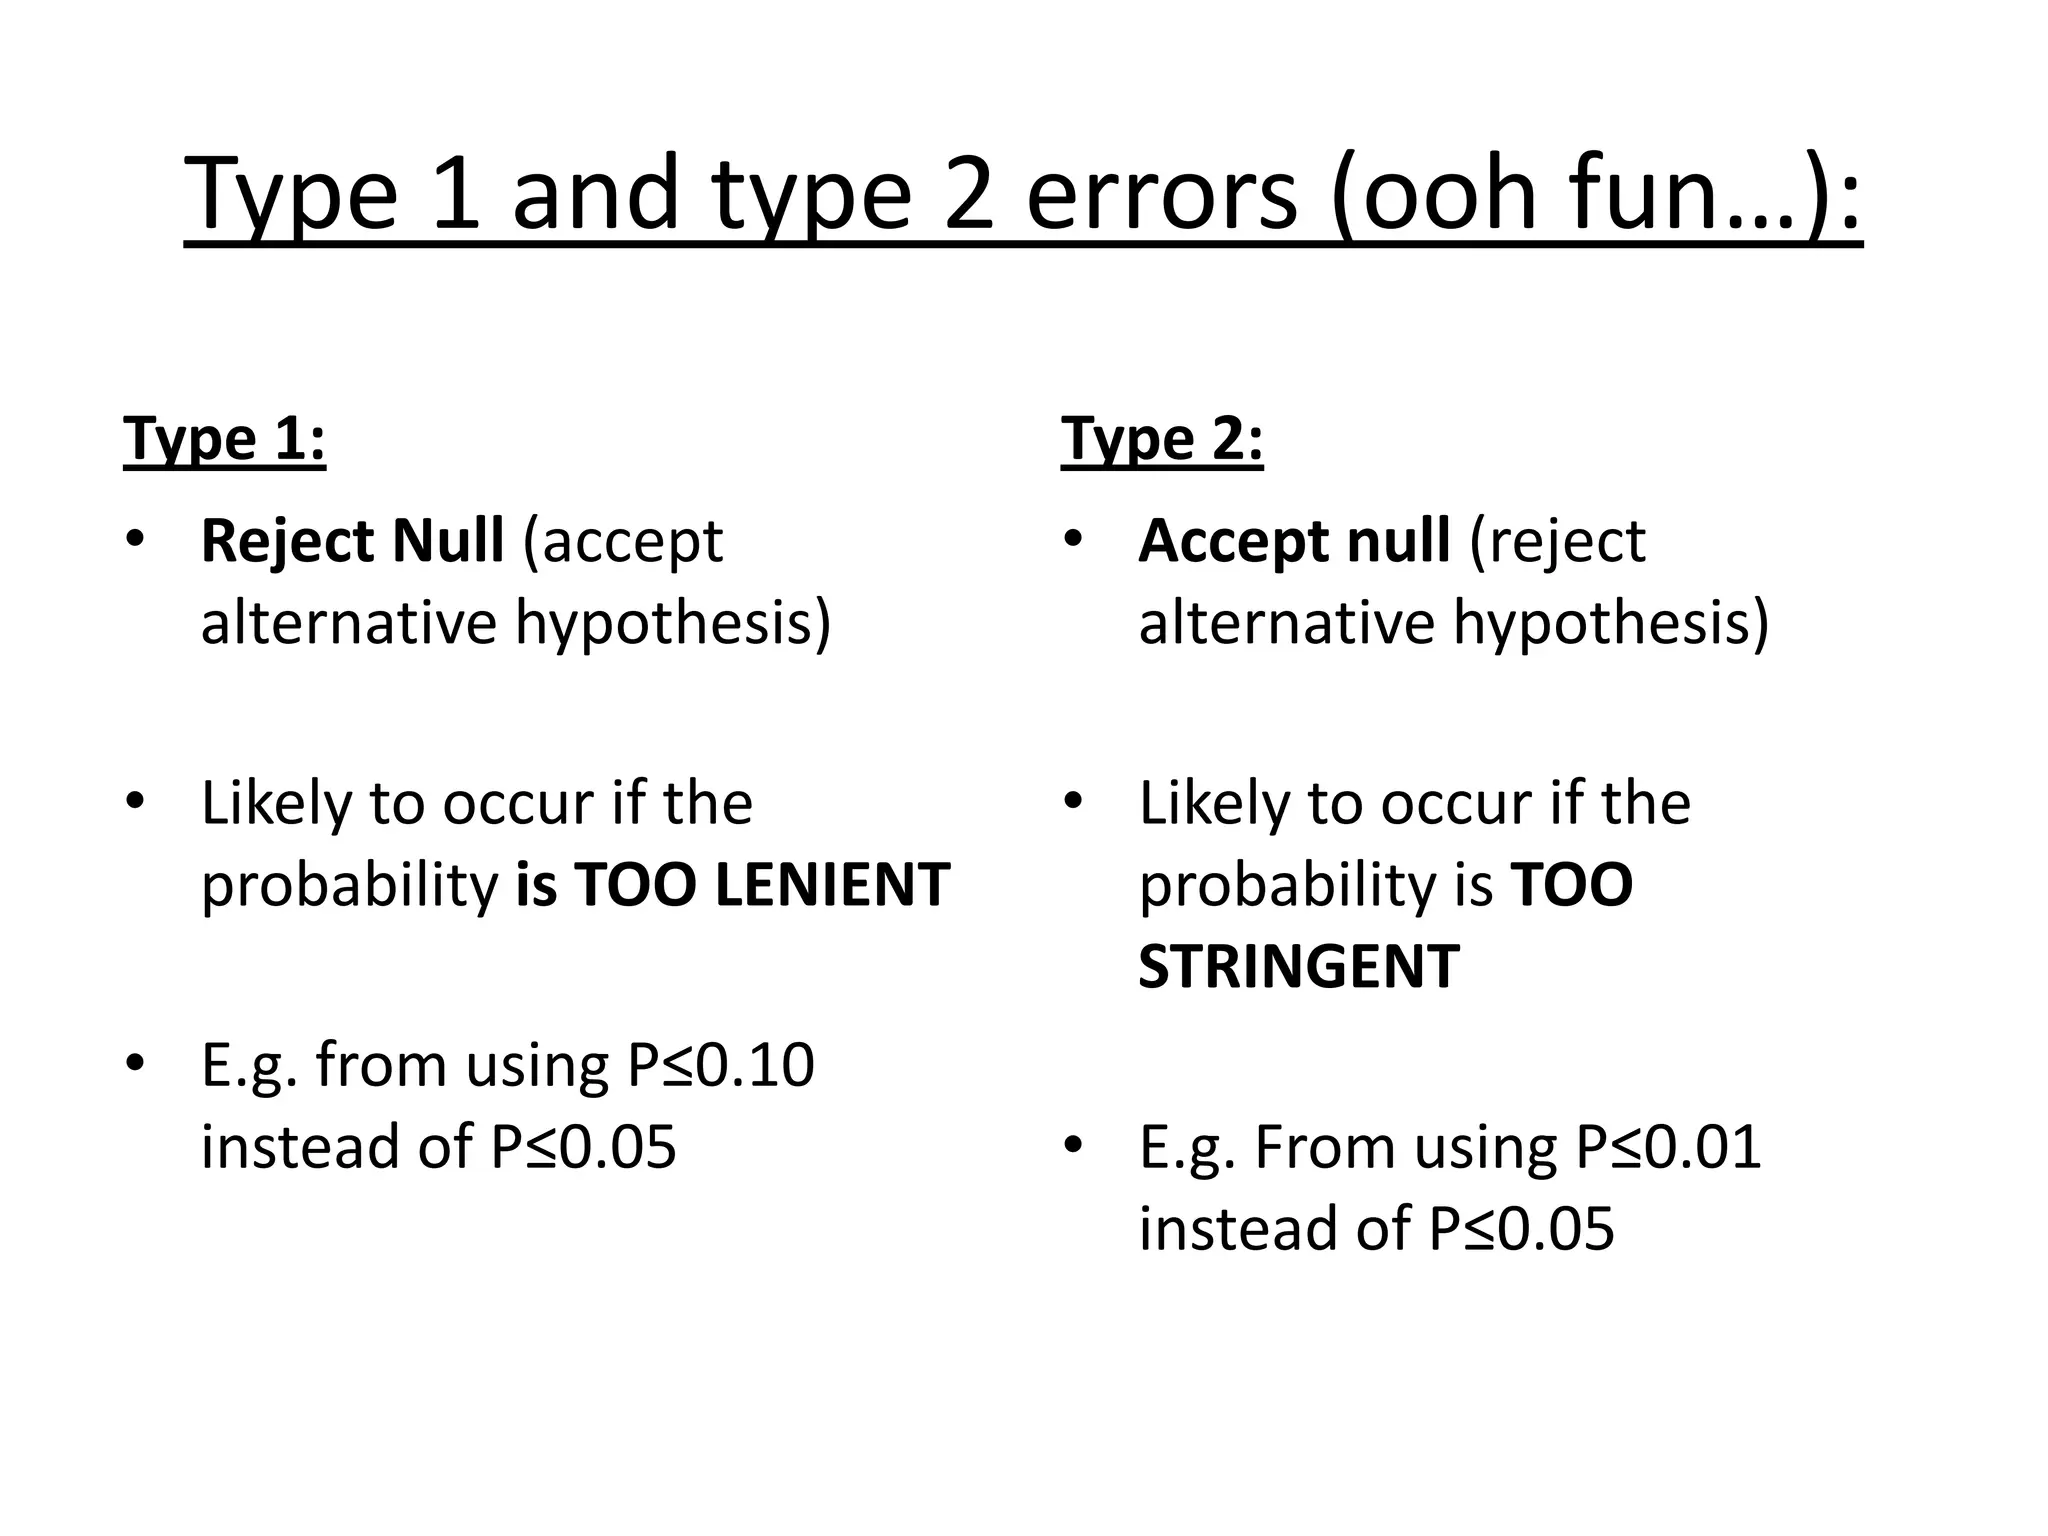
Explains Type 1 and Type 2 errors in hypothesis testing and significance levels in research.
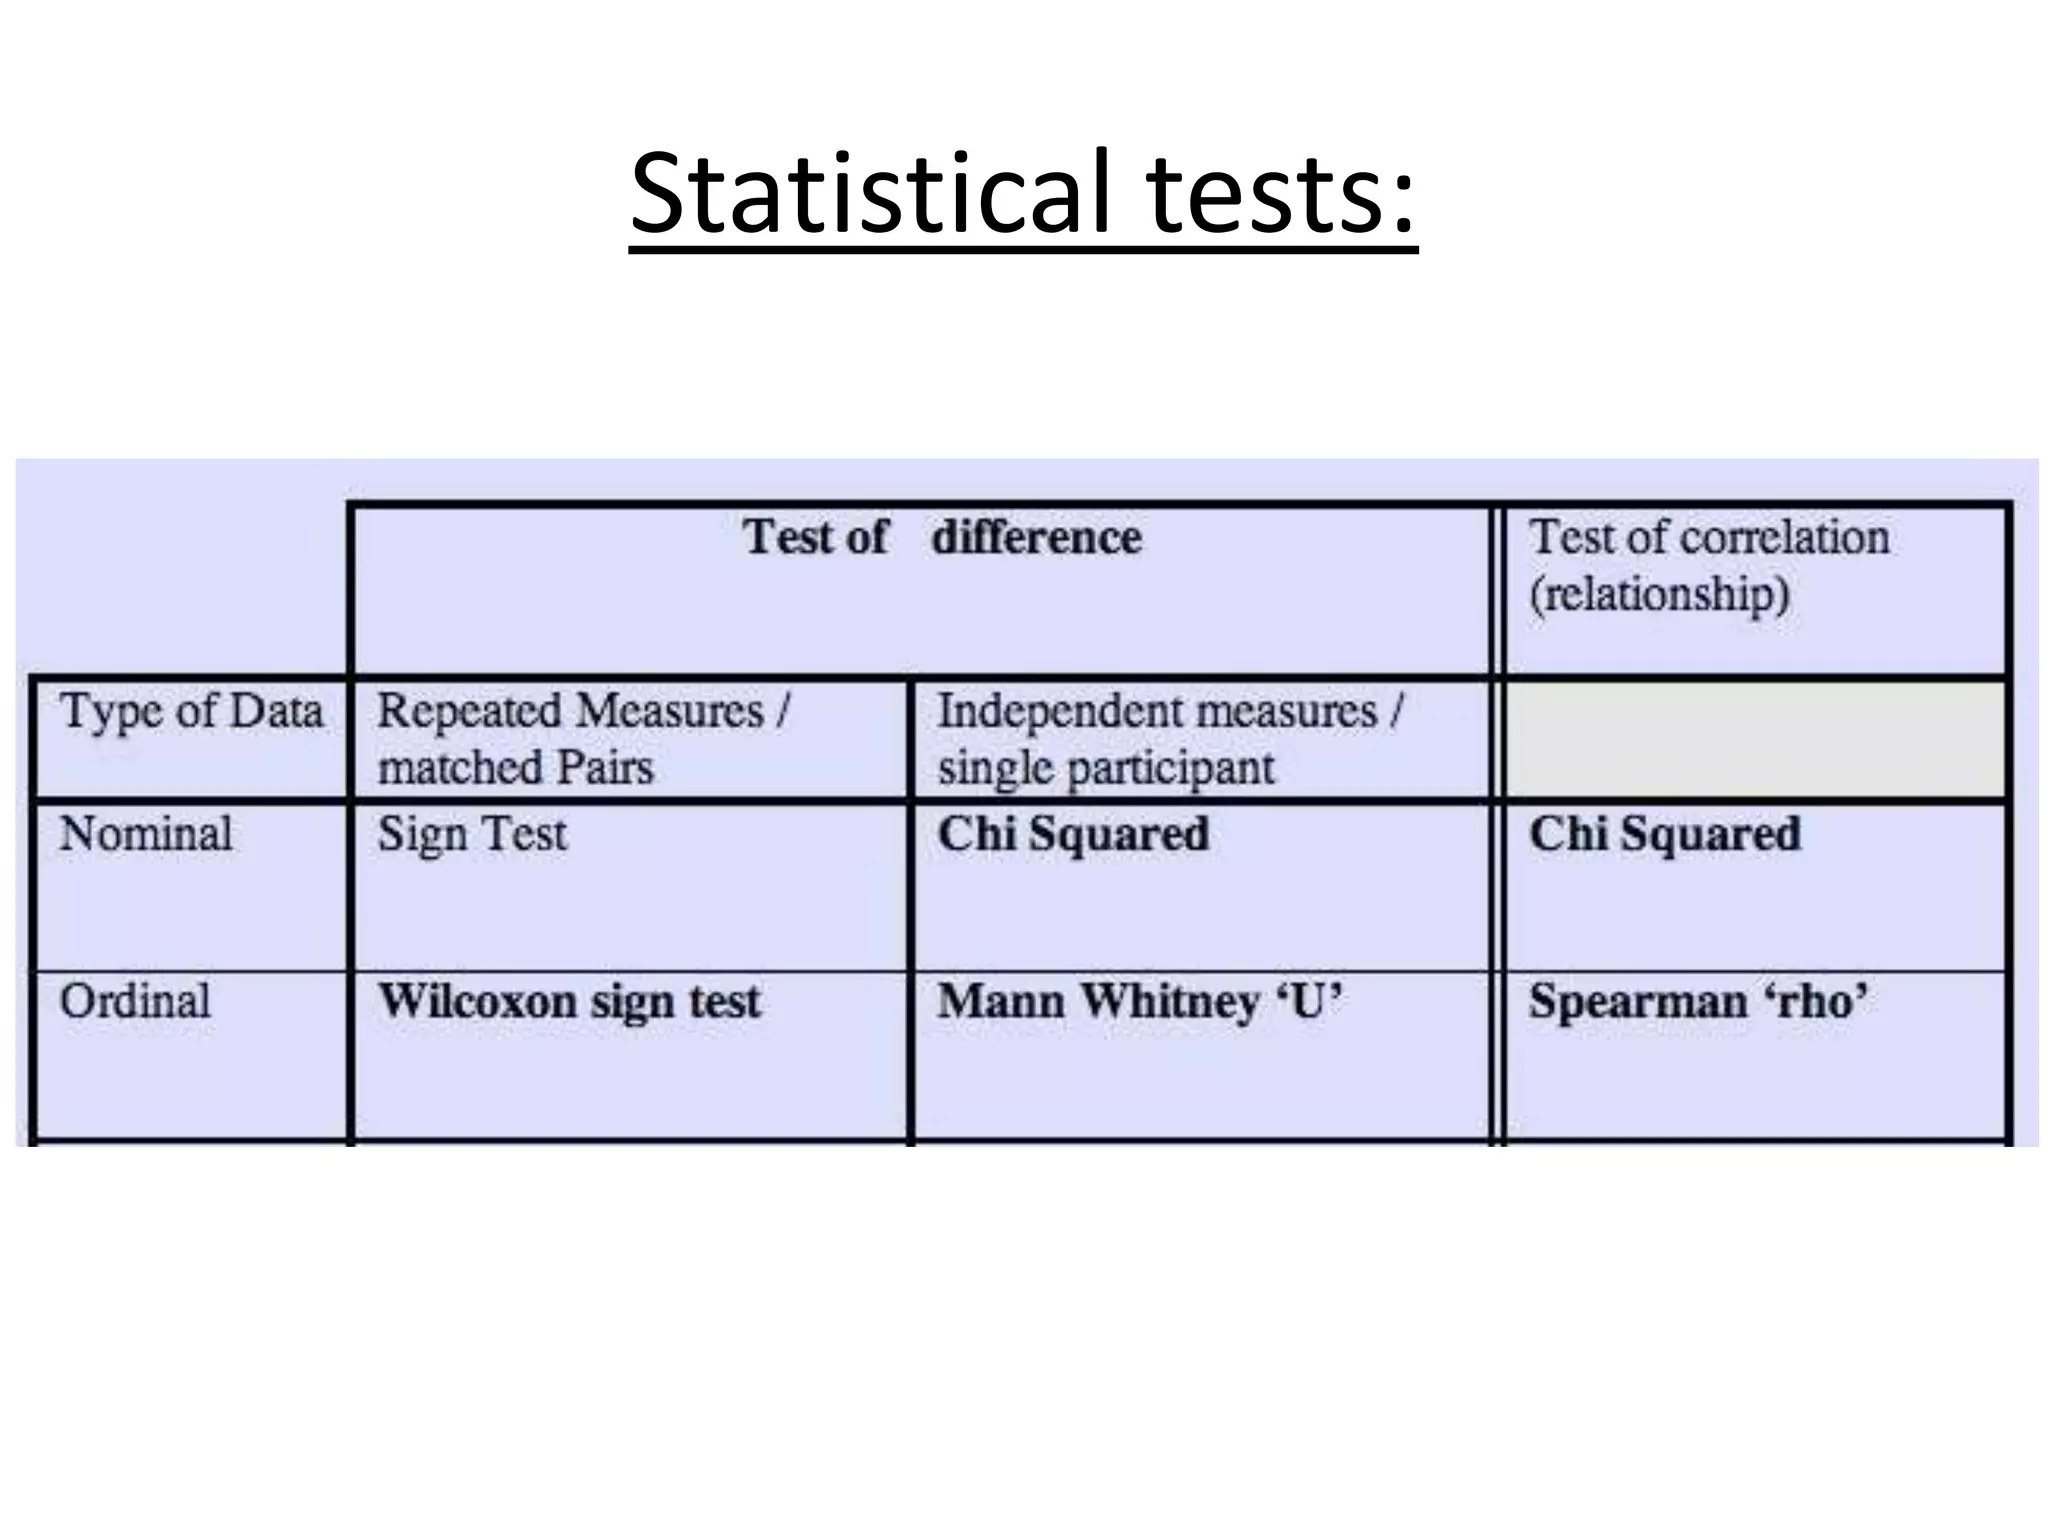
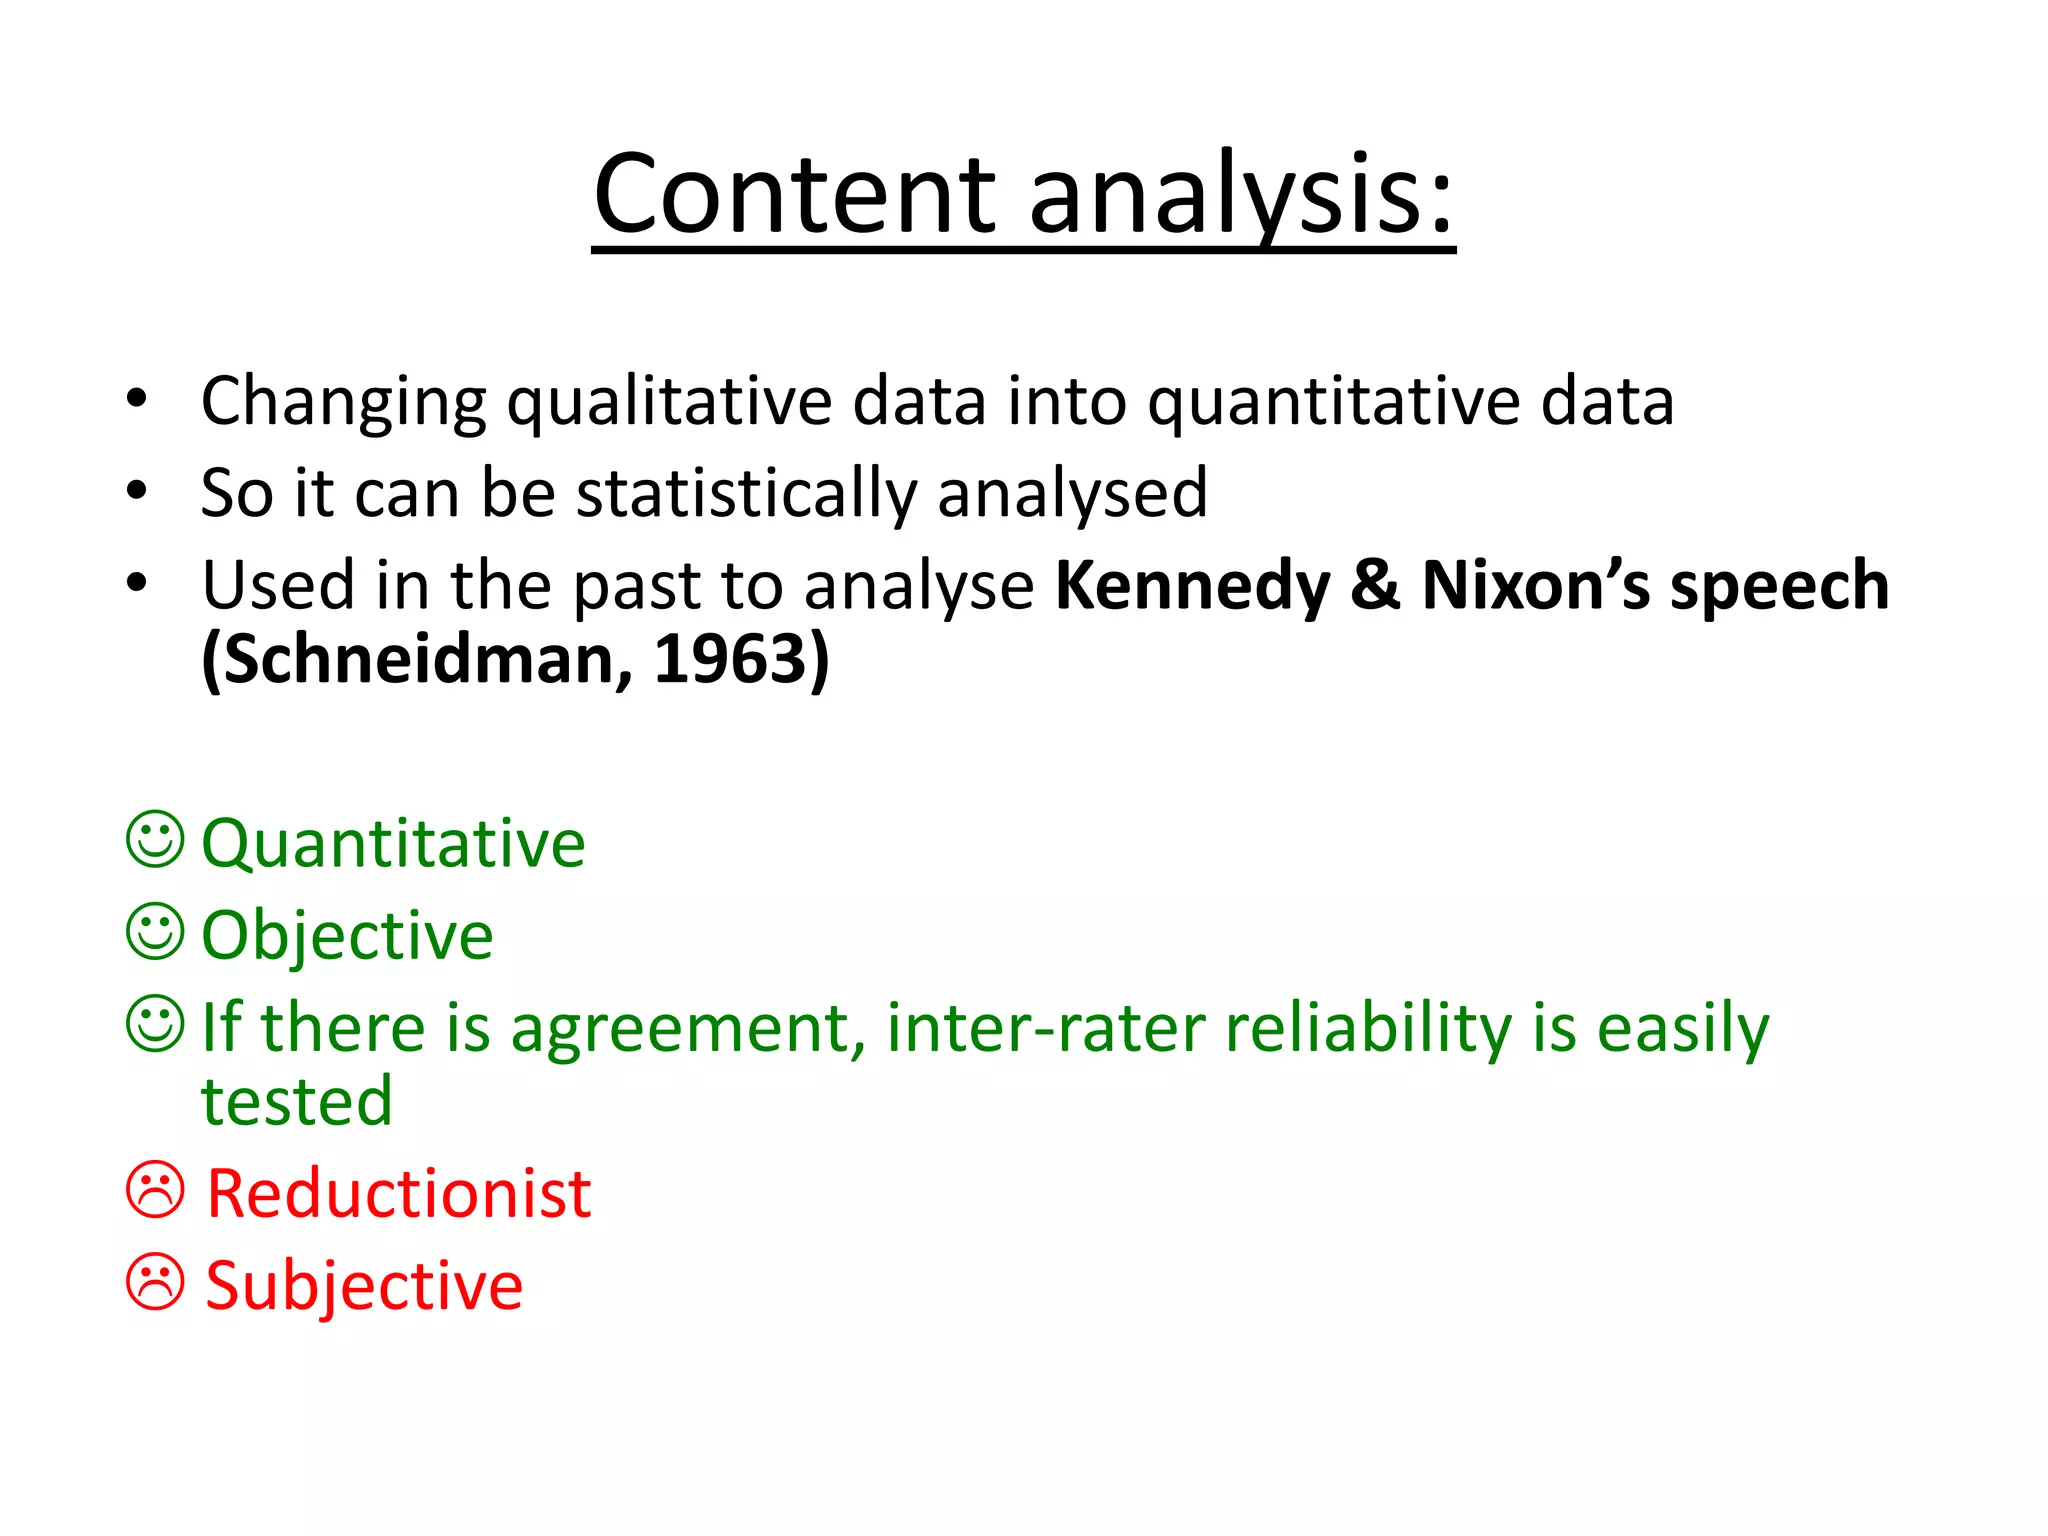
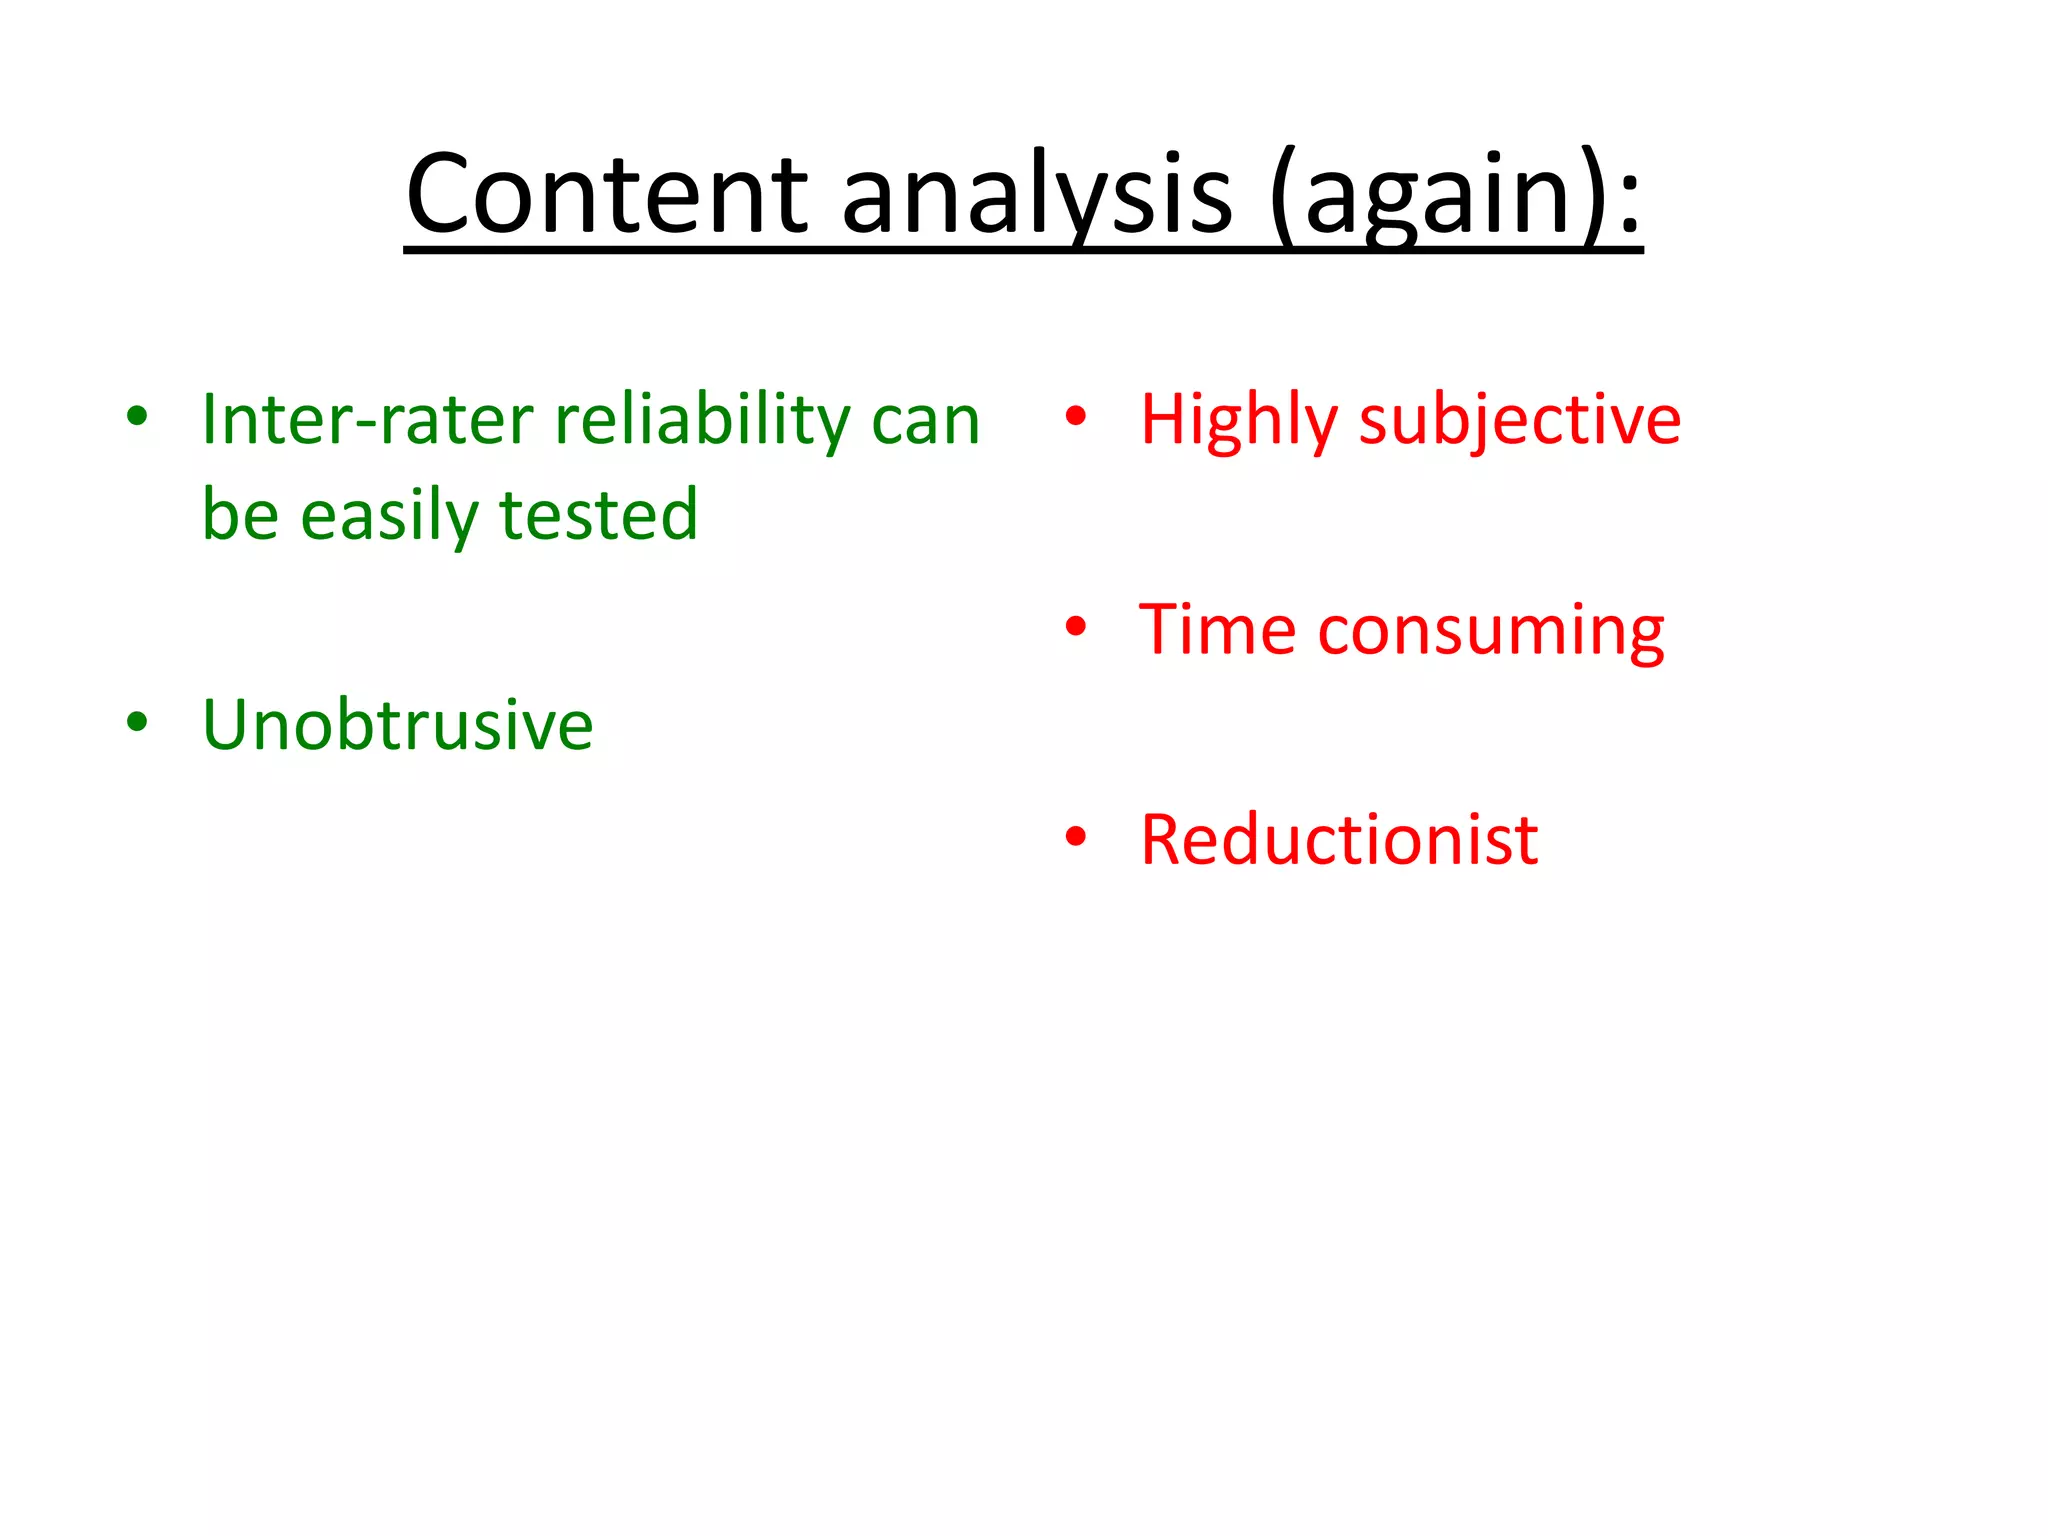
Introduction to statistical tests, content analysis, and its pros and cons.
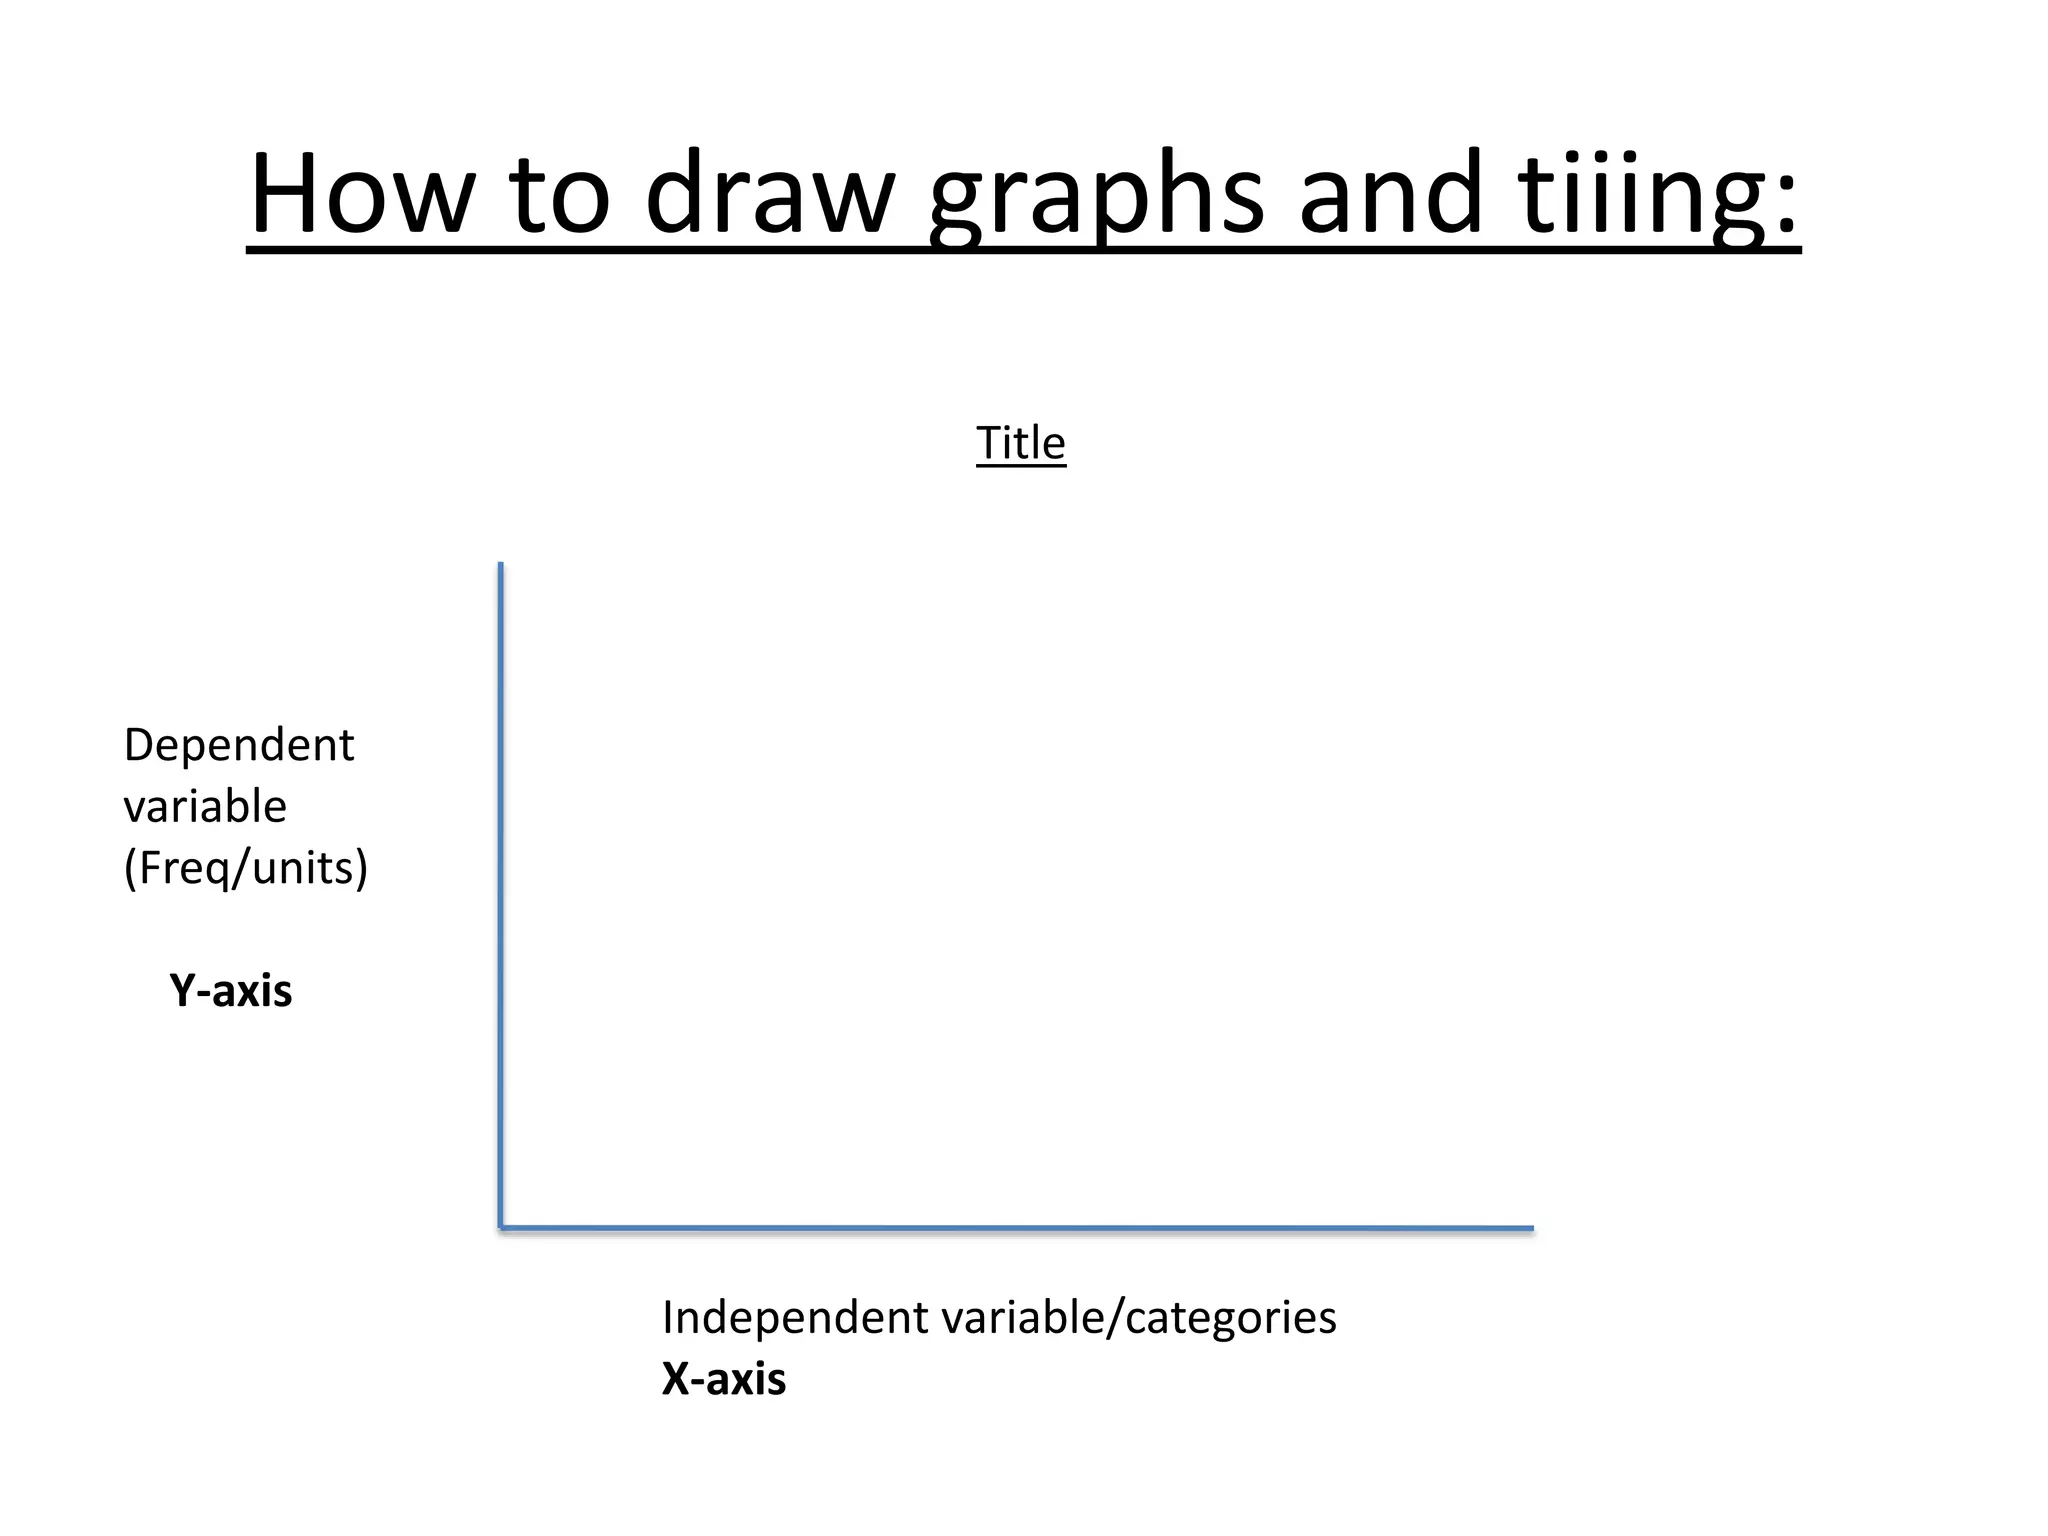
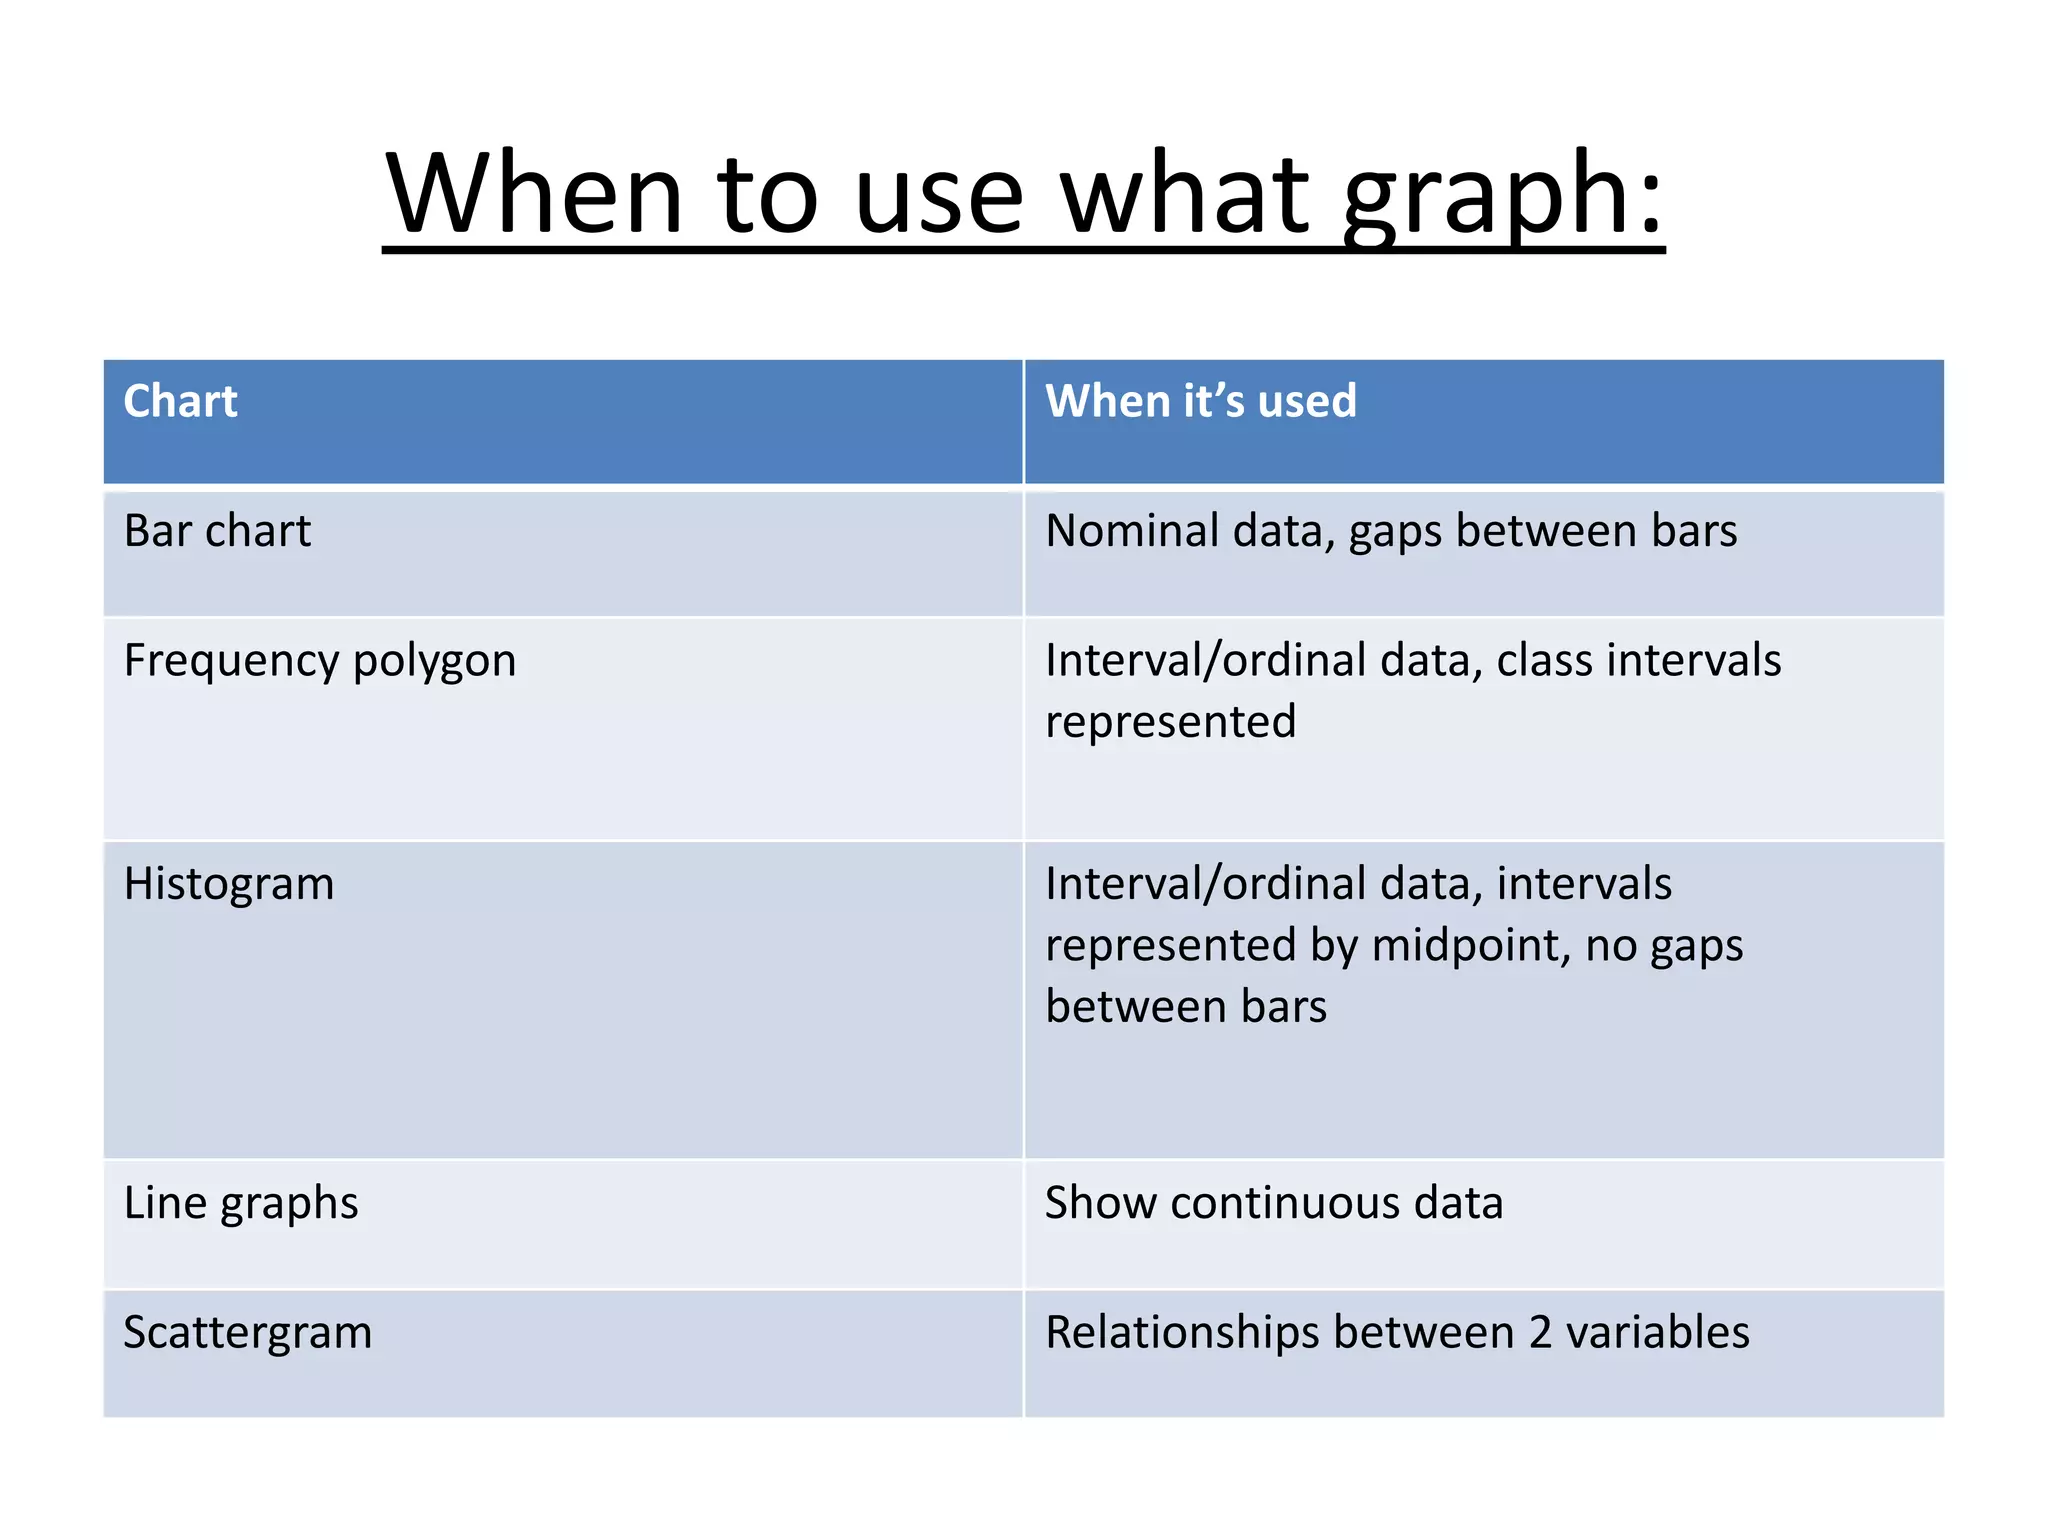
Guidelines for drawing graphs and when to use different types of graphs in data representation.
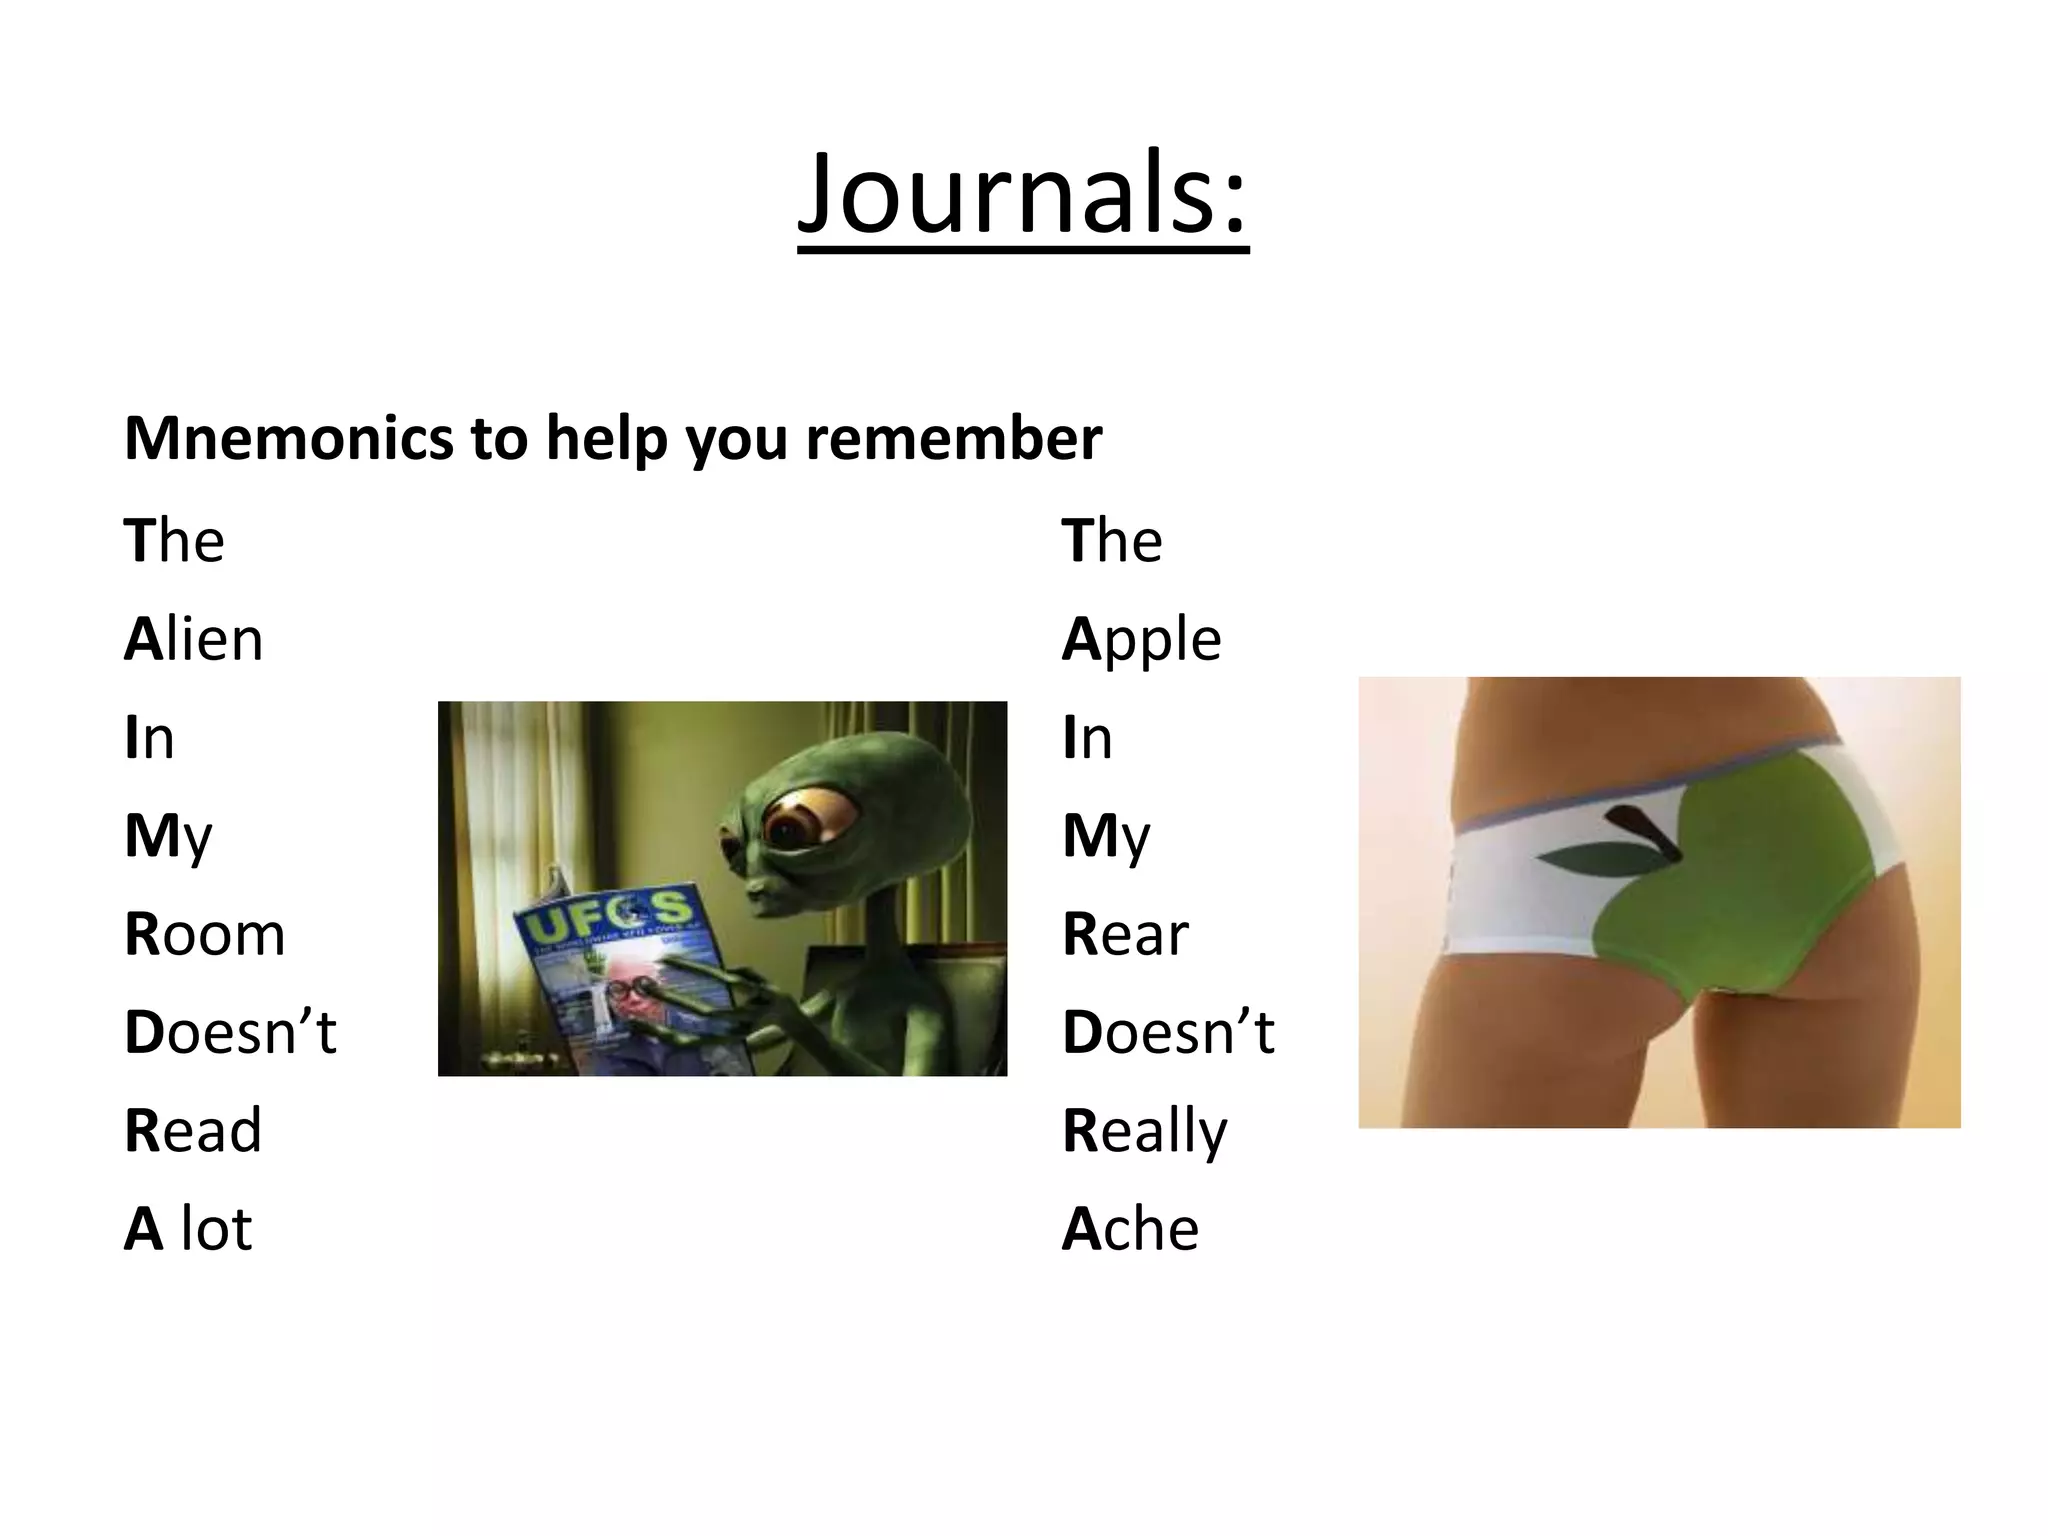
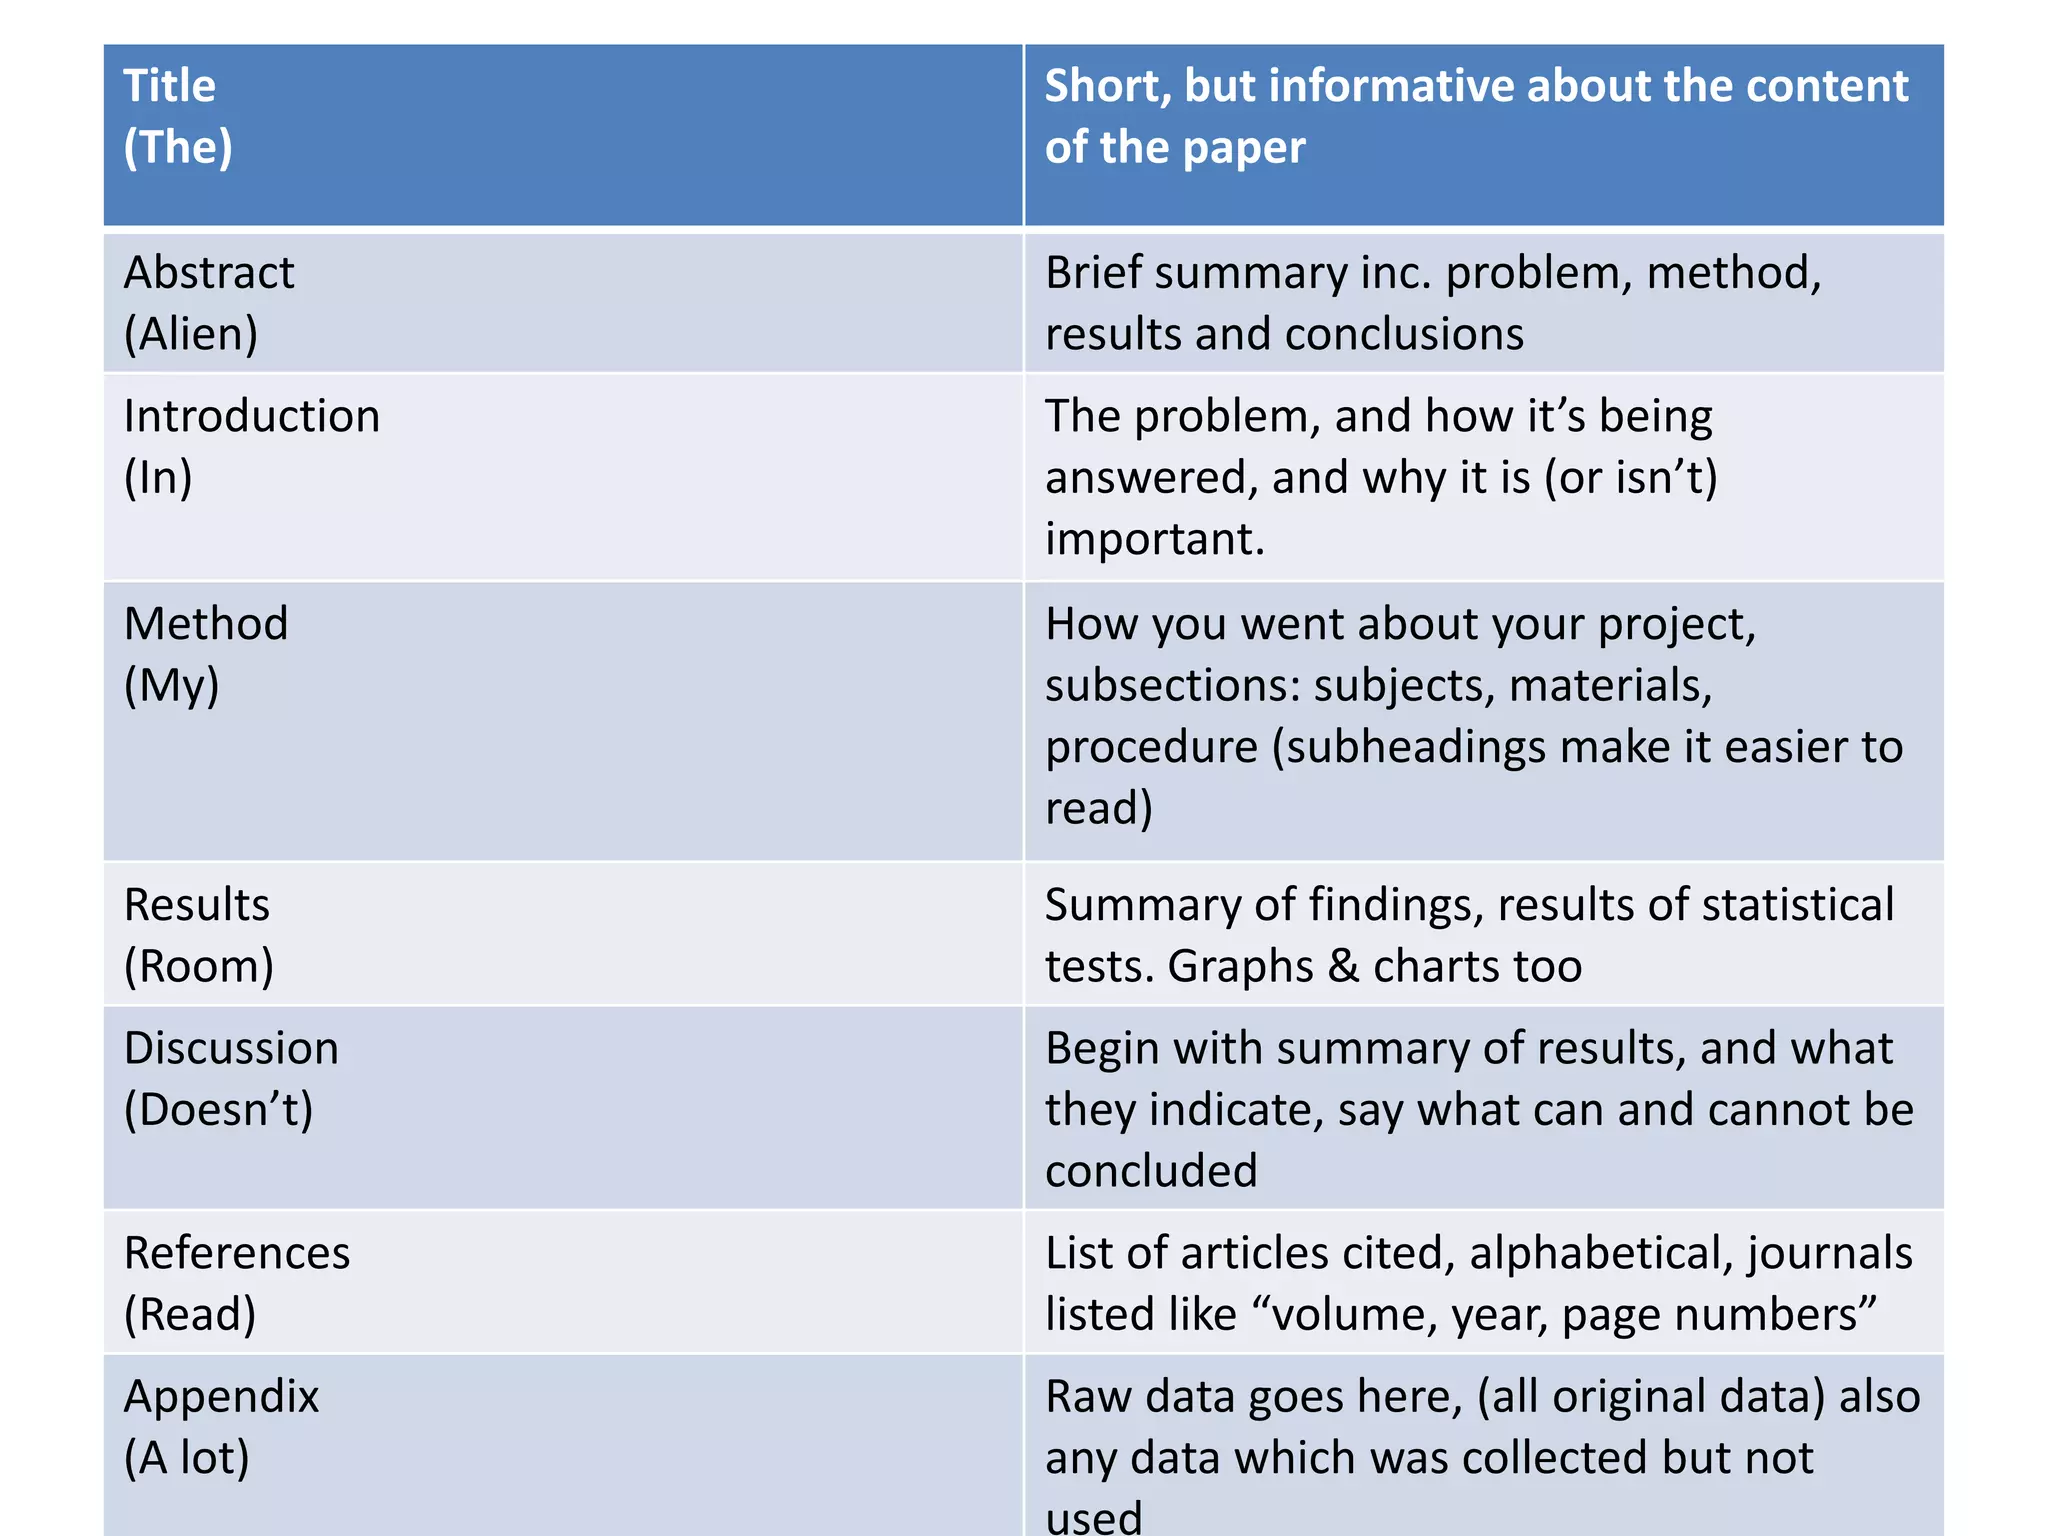
Mnemonic for remembering the structure of a research paper, including title, abstract, and sections.
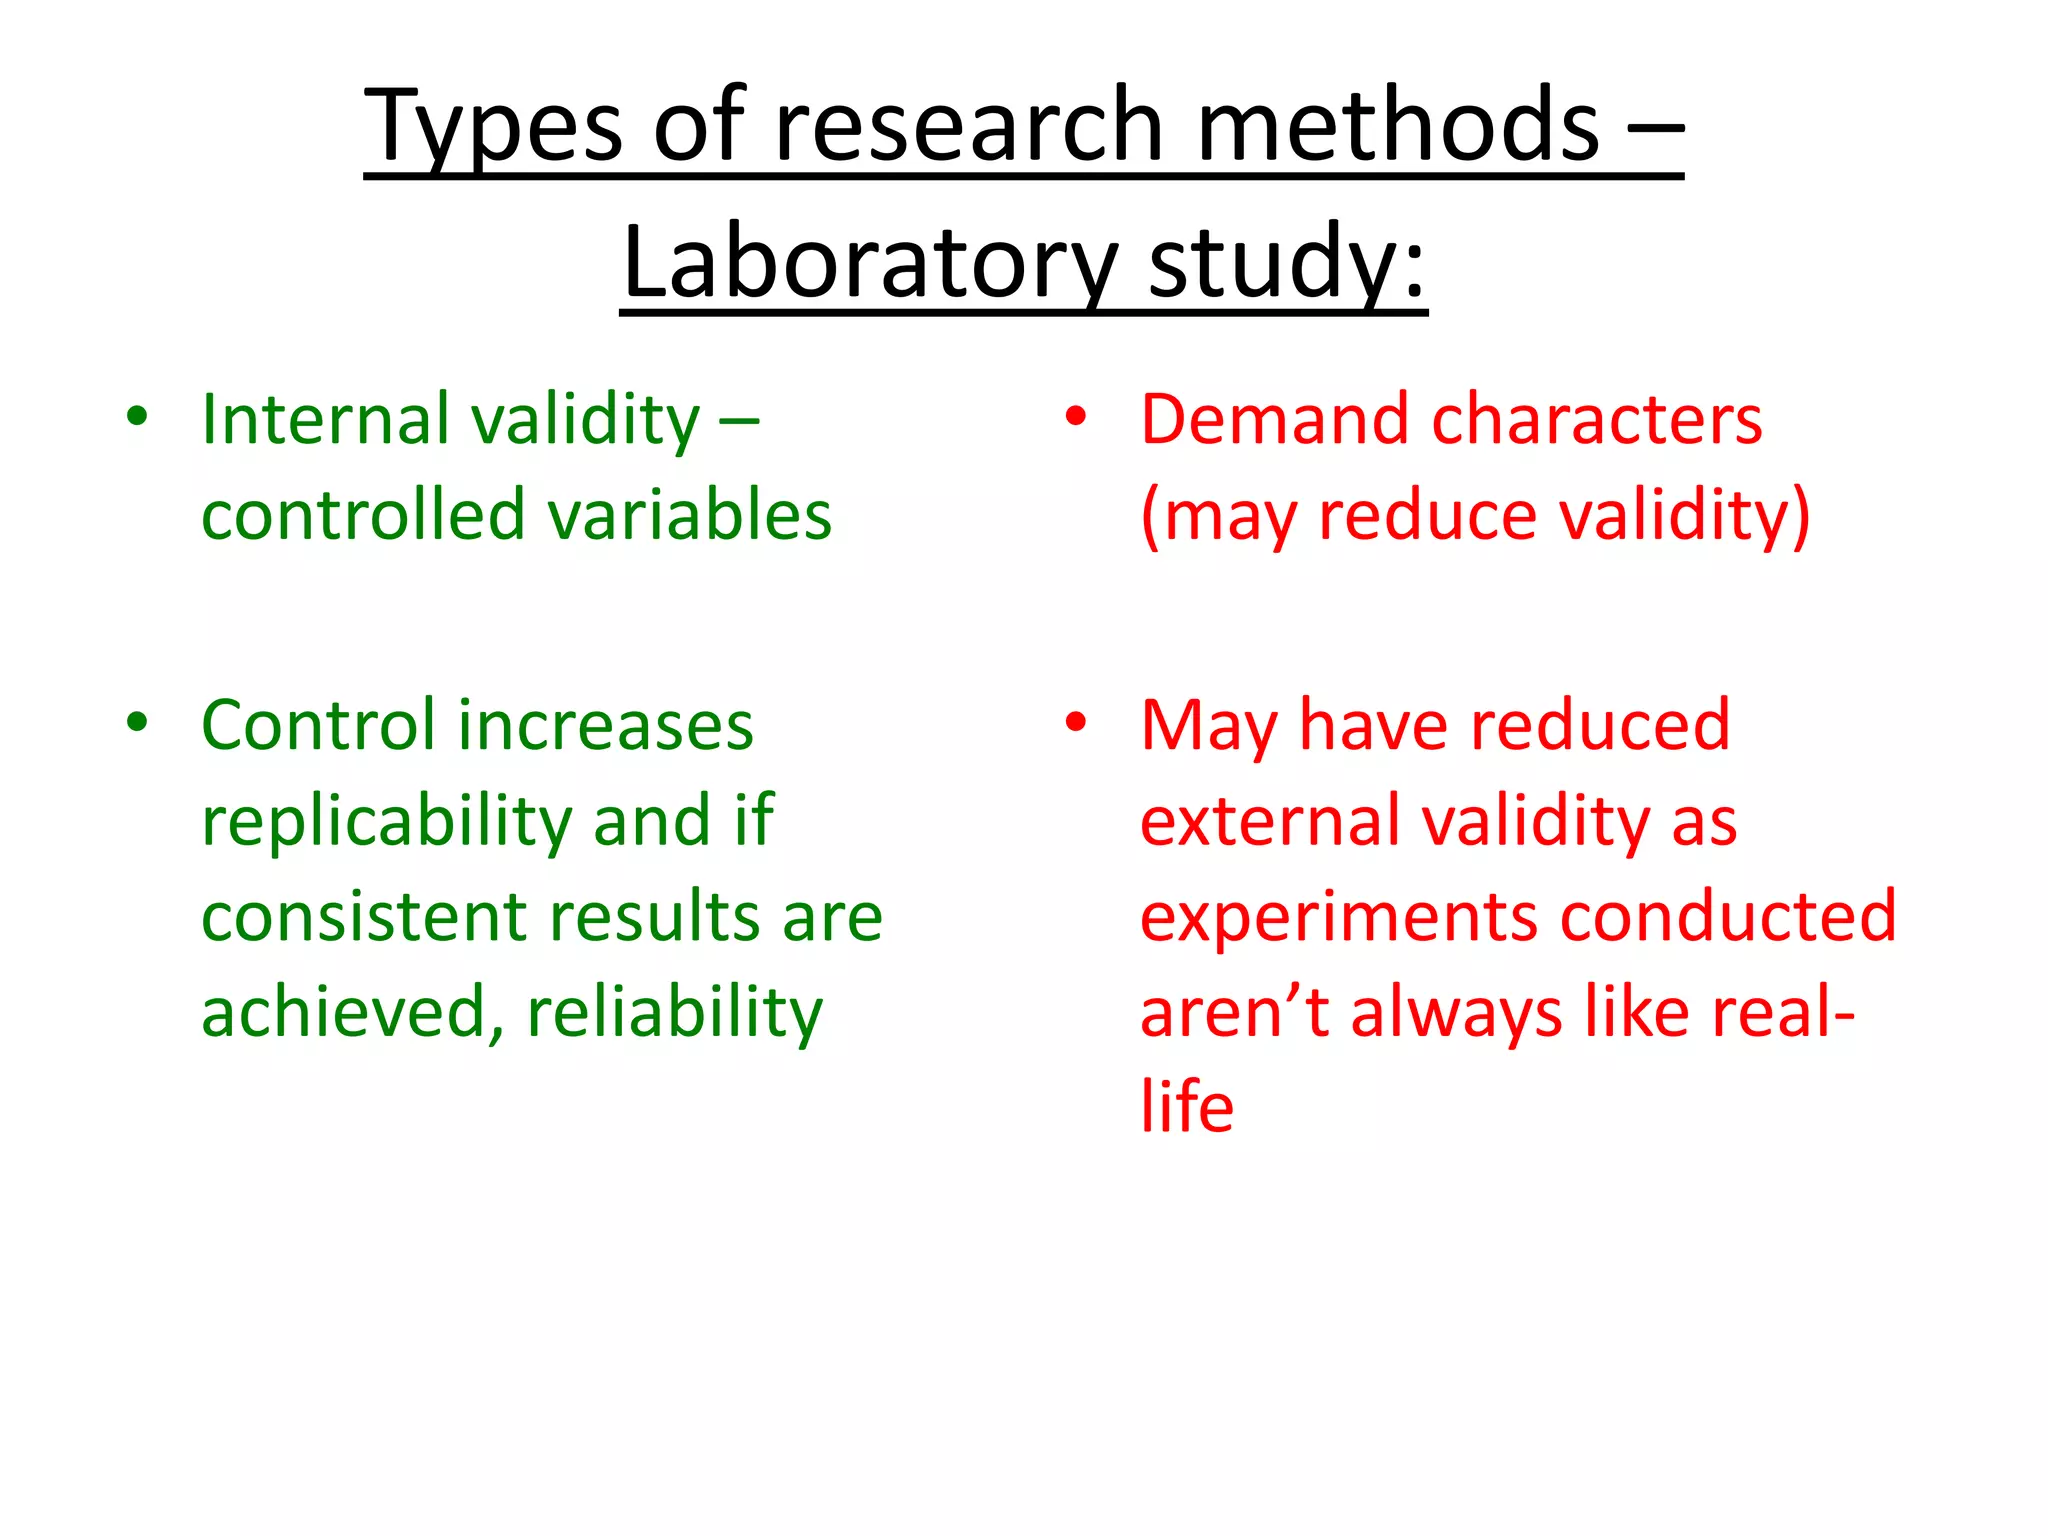
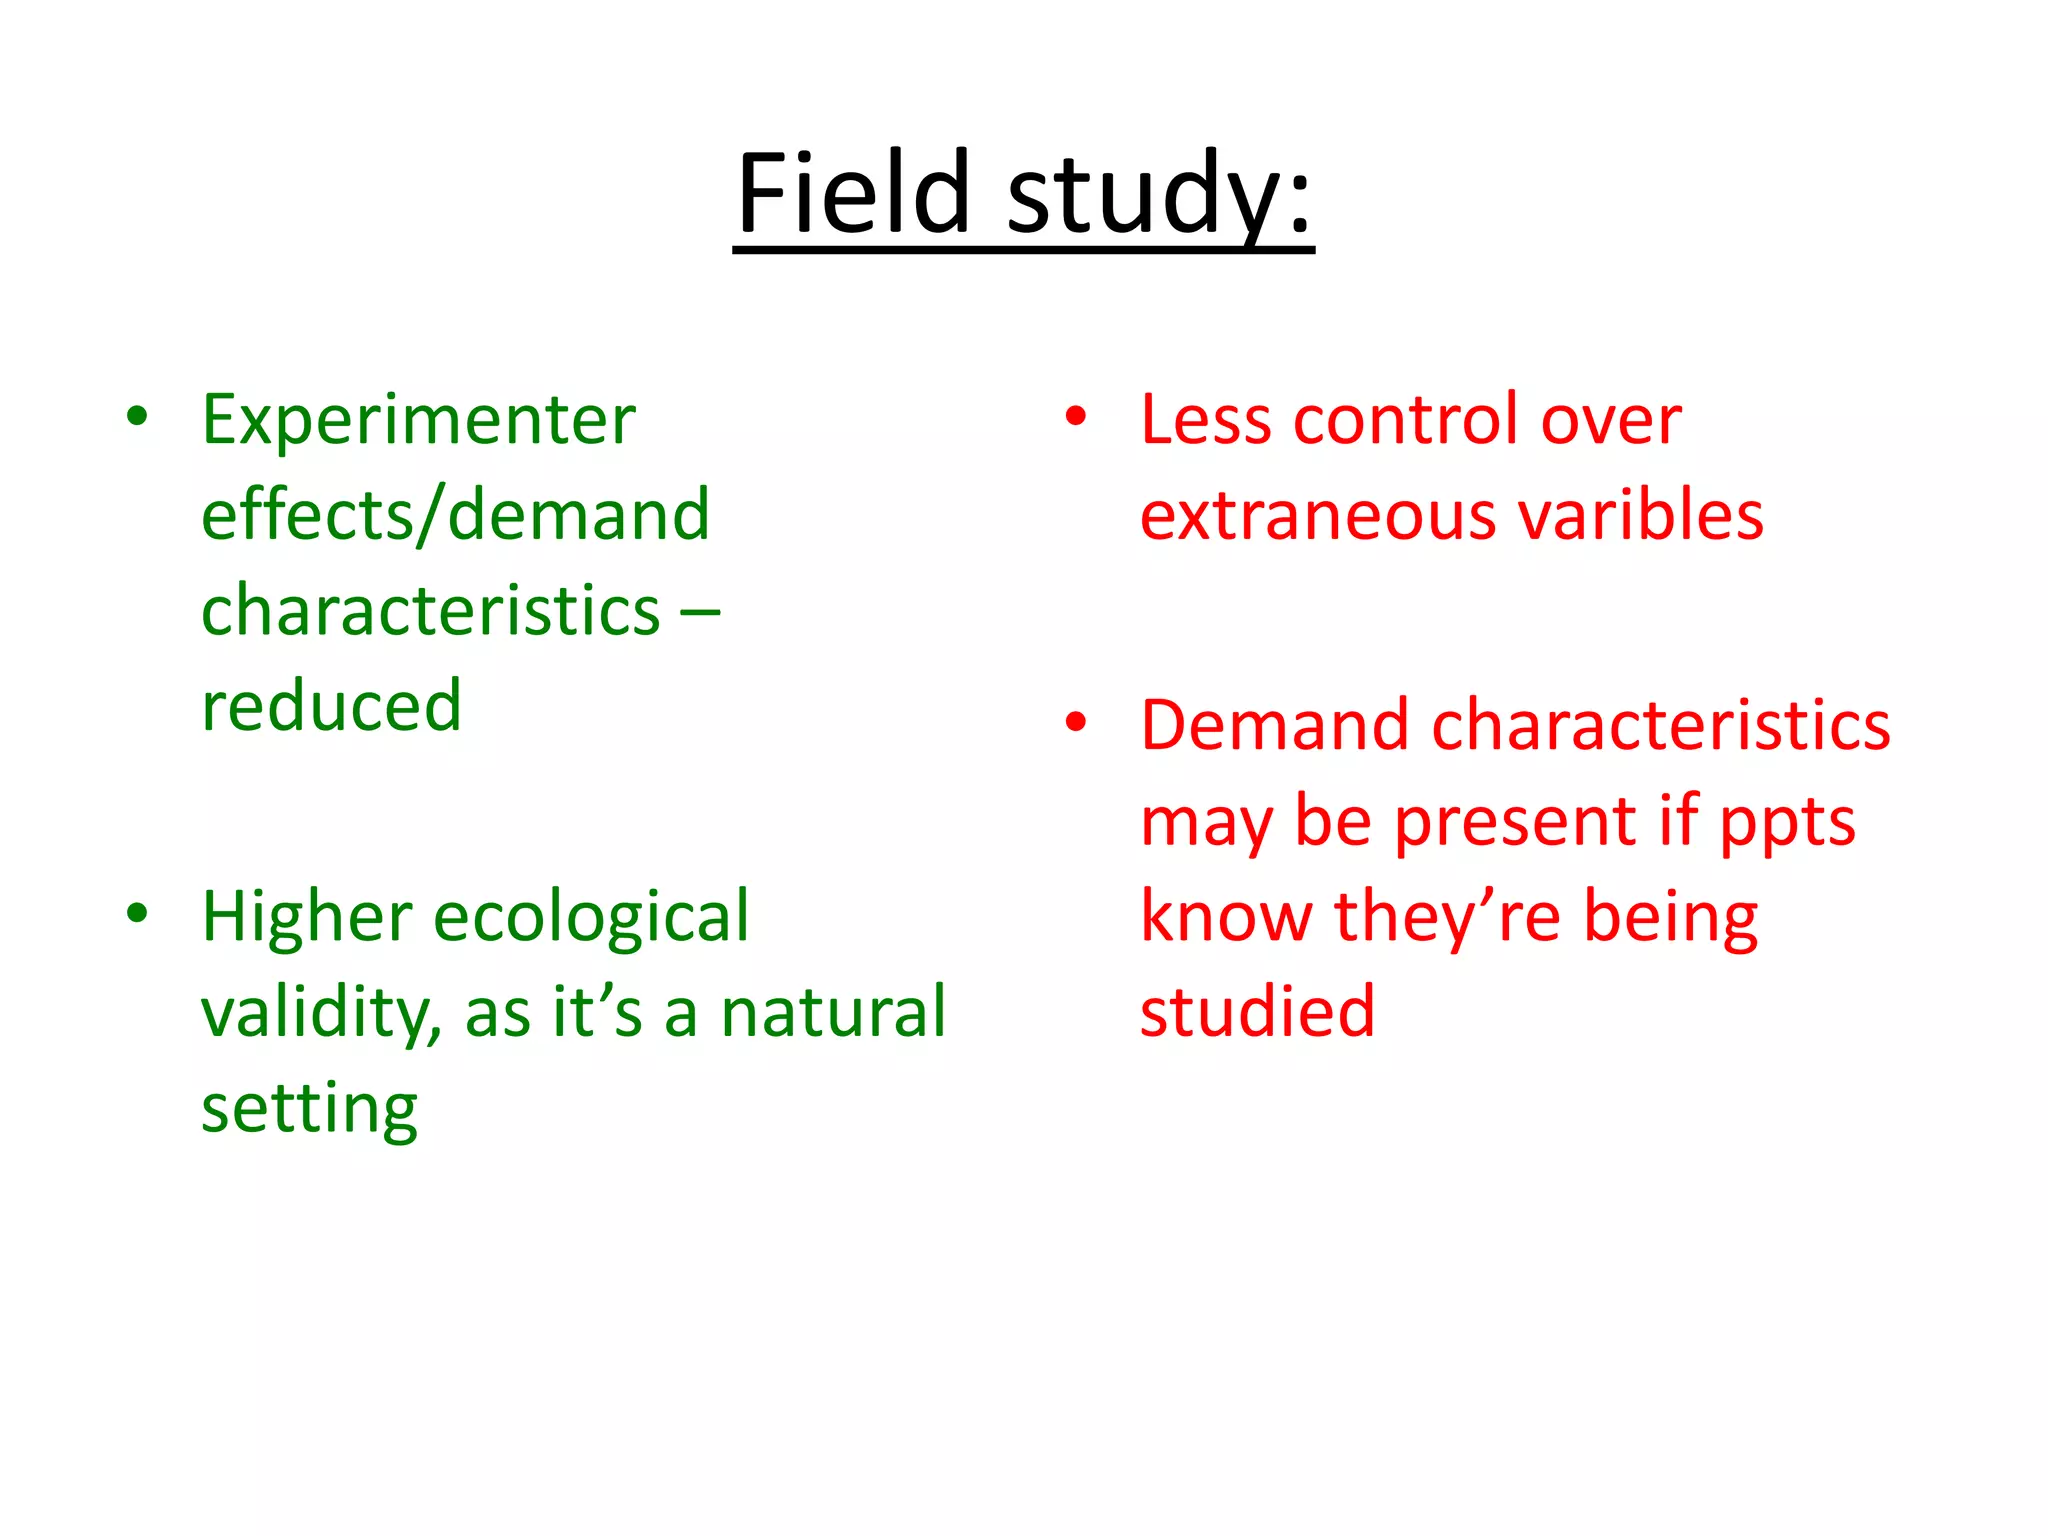
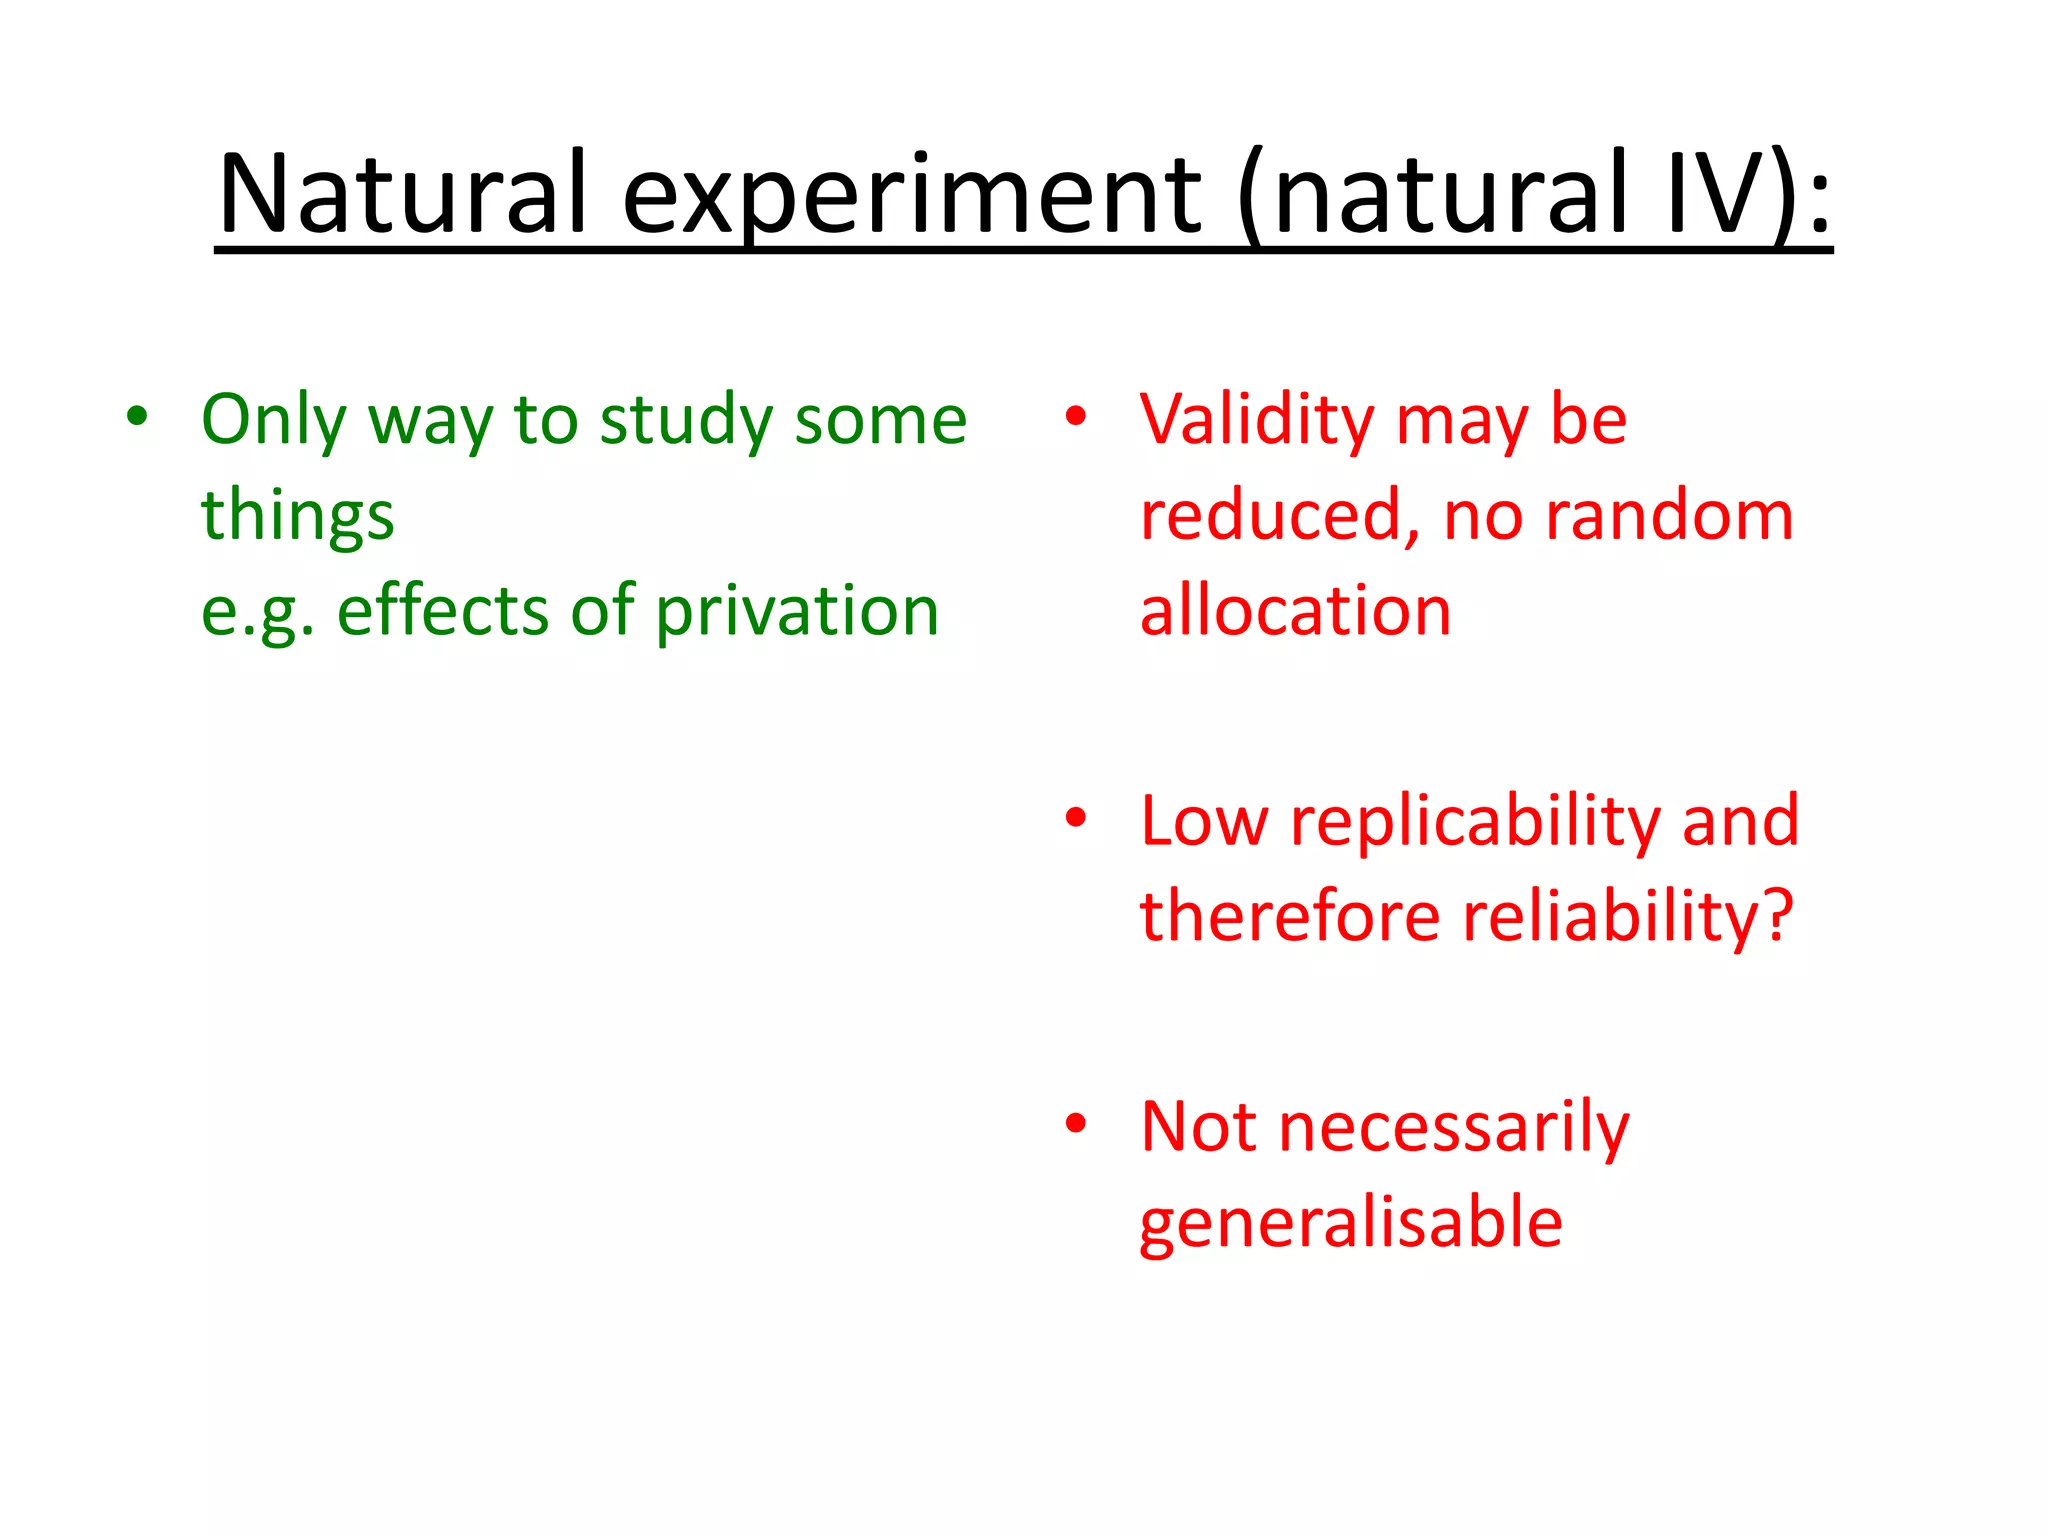
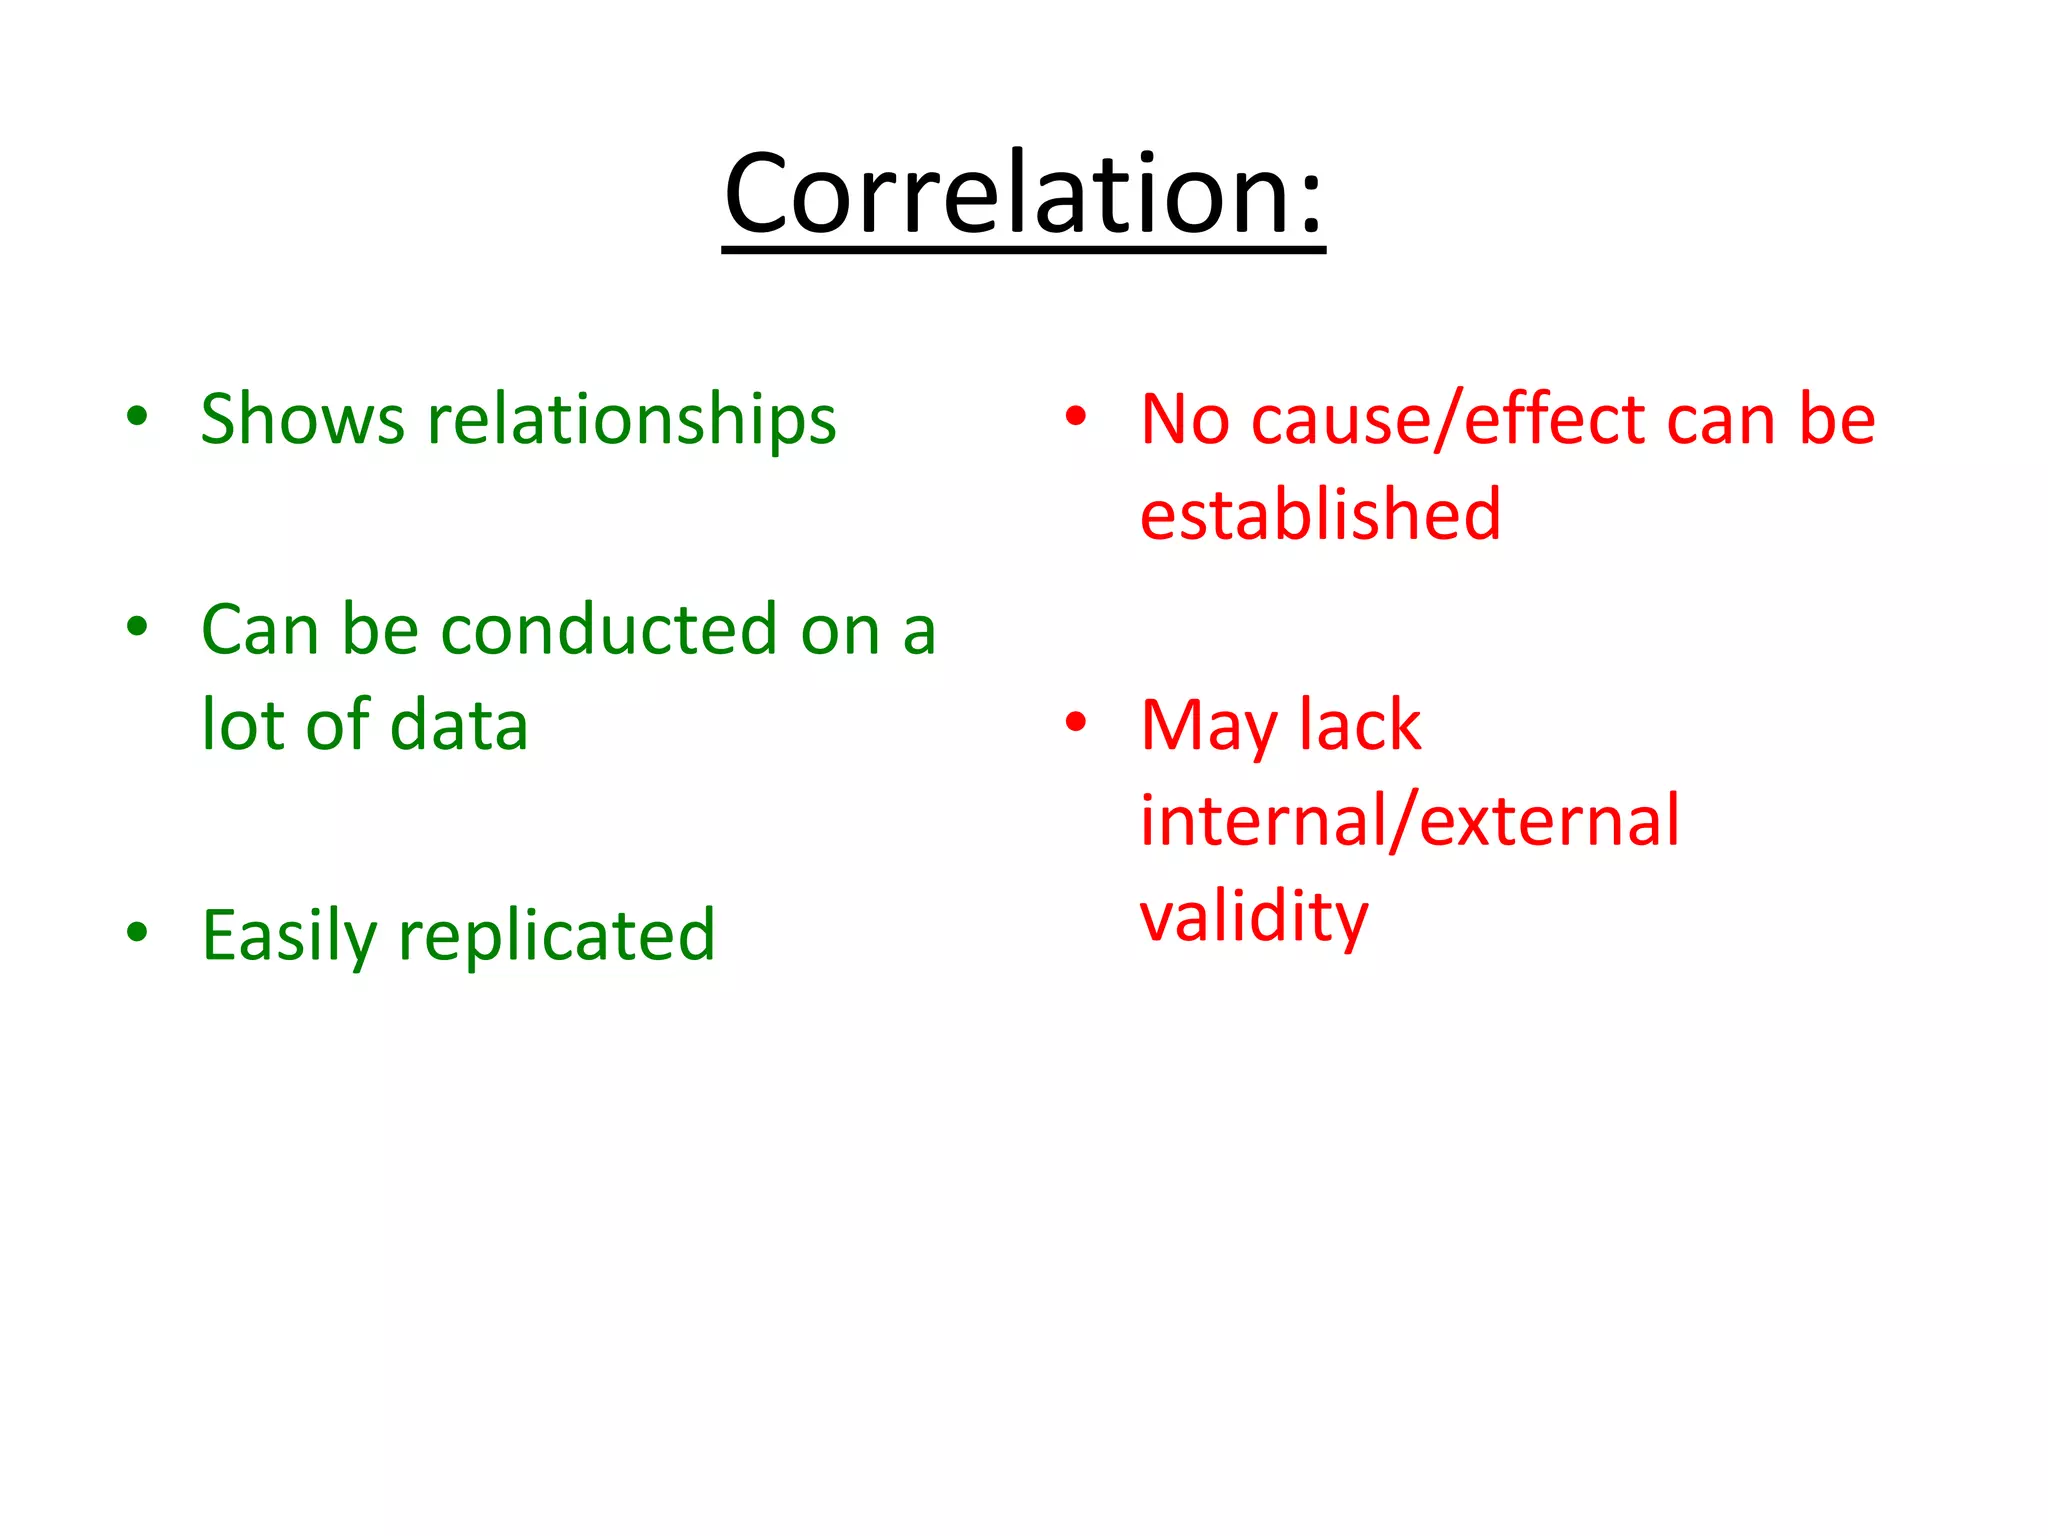
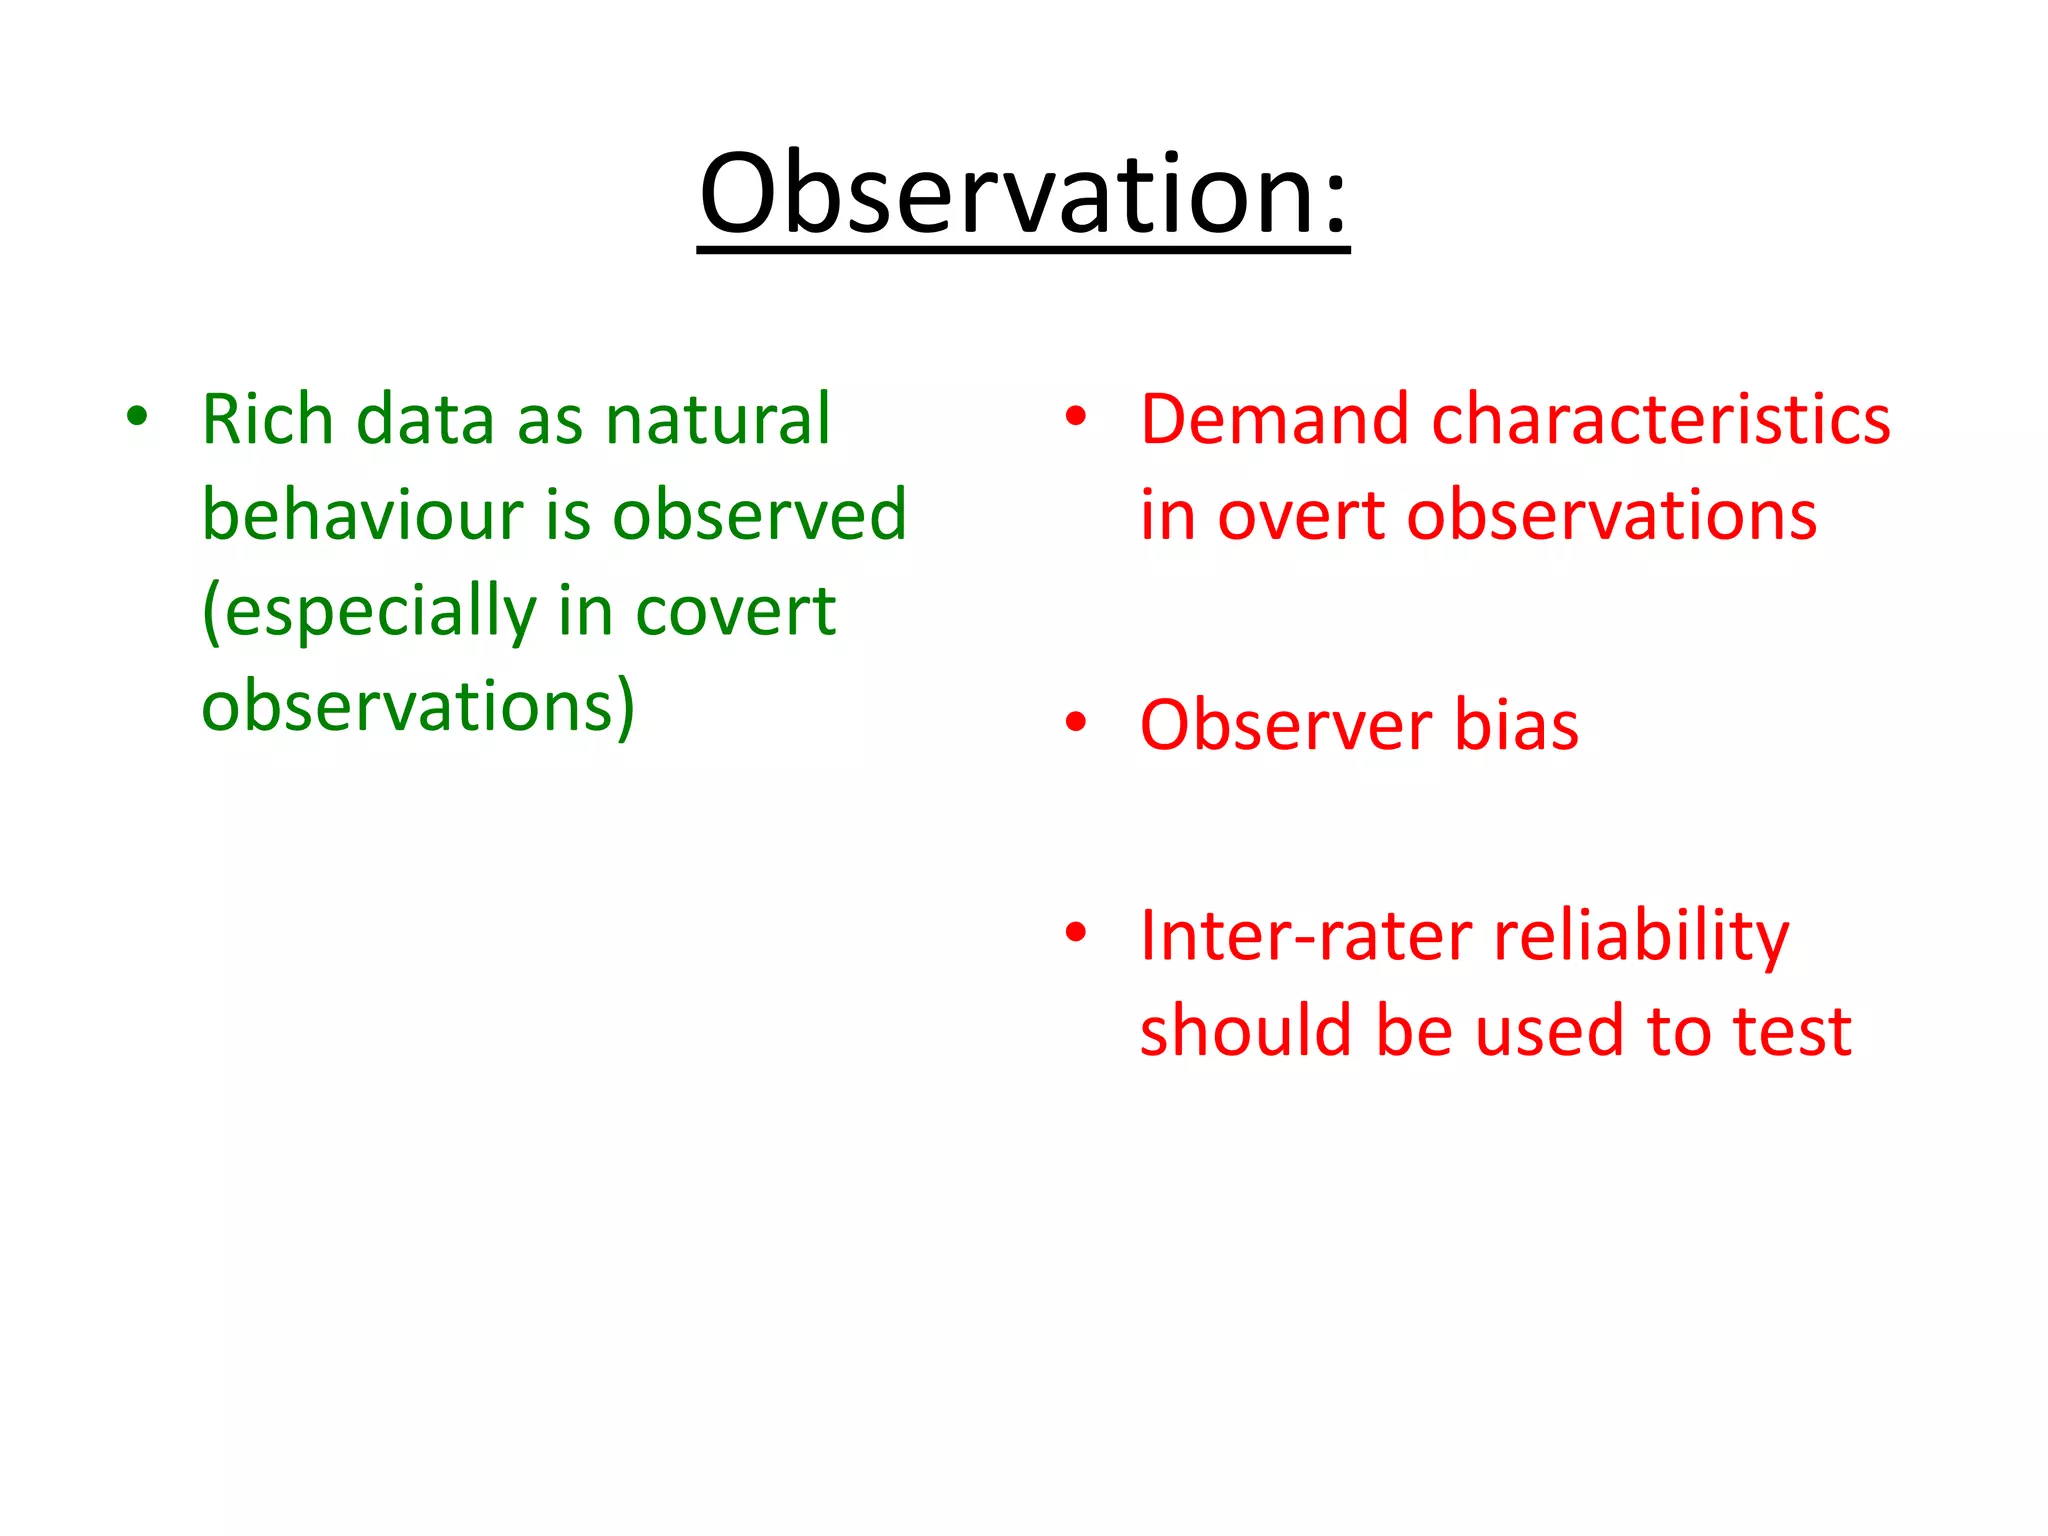
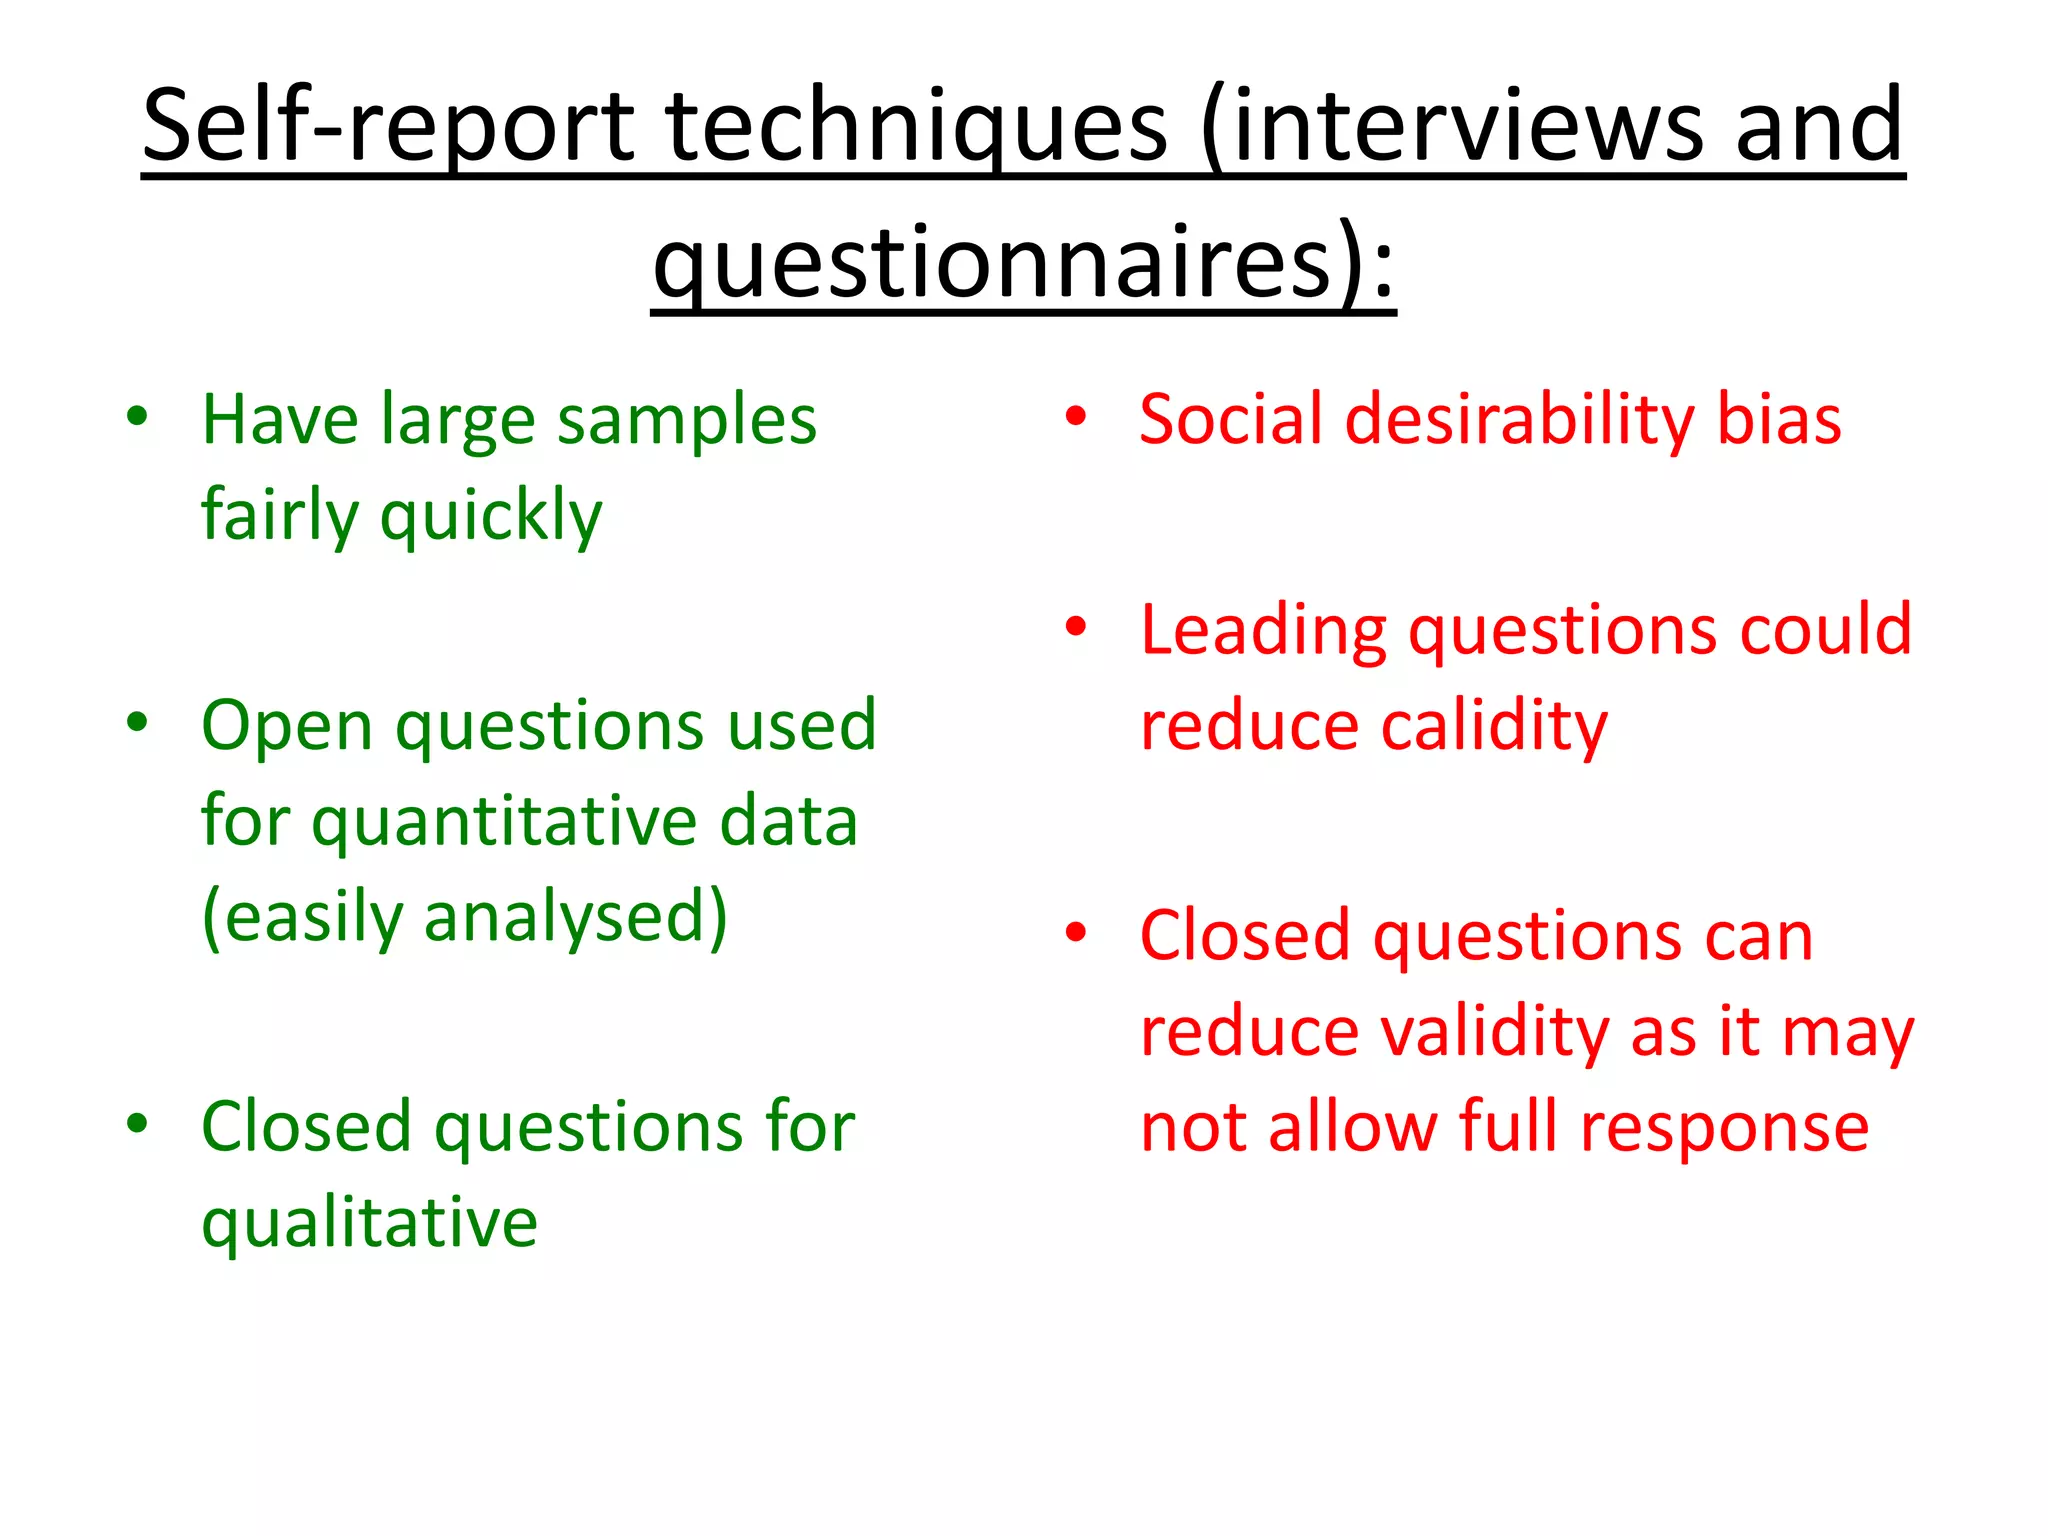
Descriptions and evaluations of laboratory studies, field studies, natural experiments, observations, and self-report techniques.
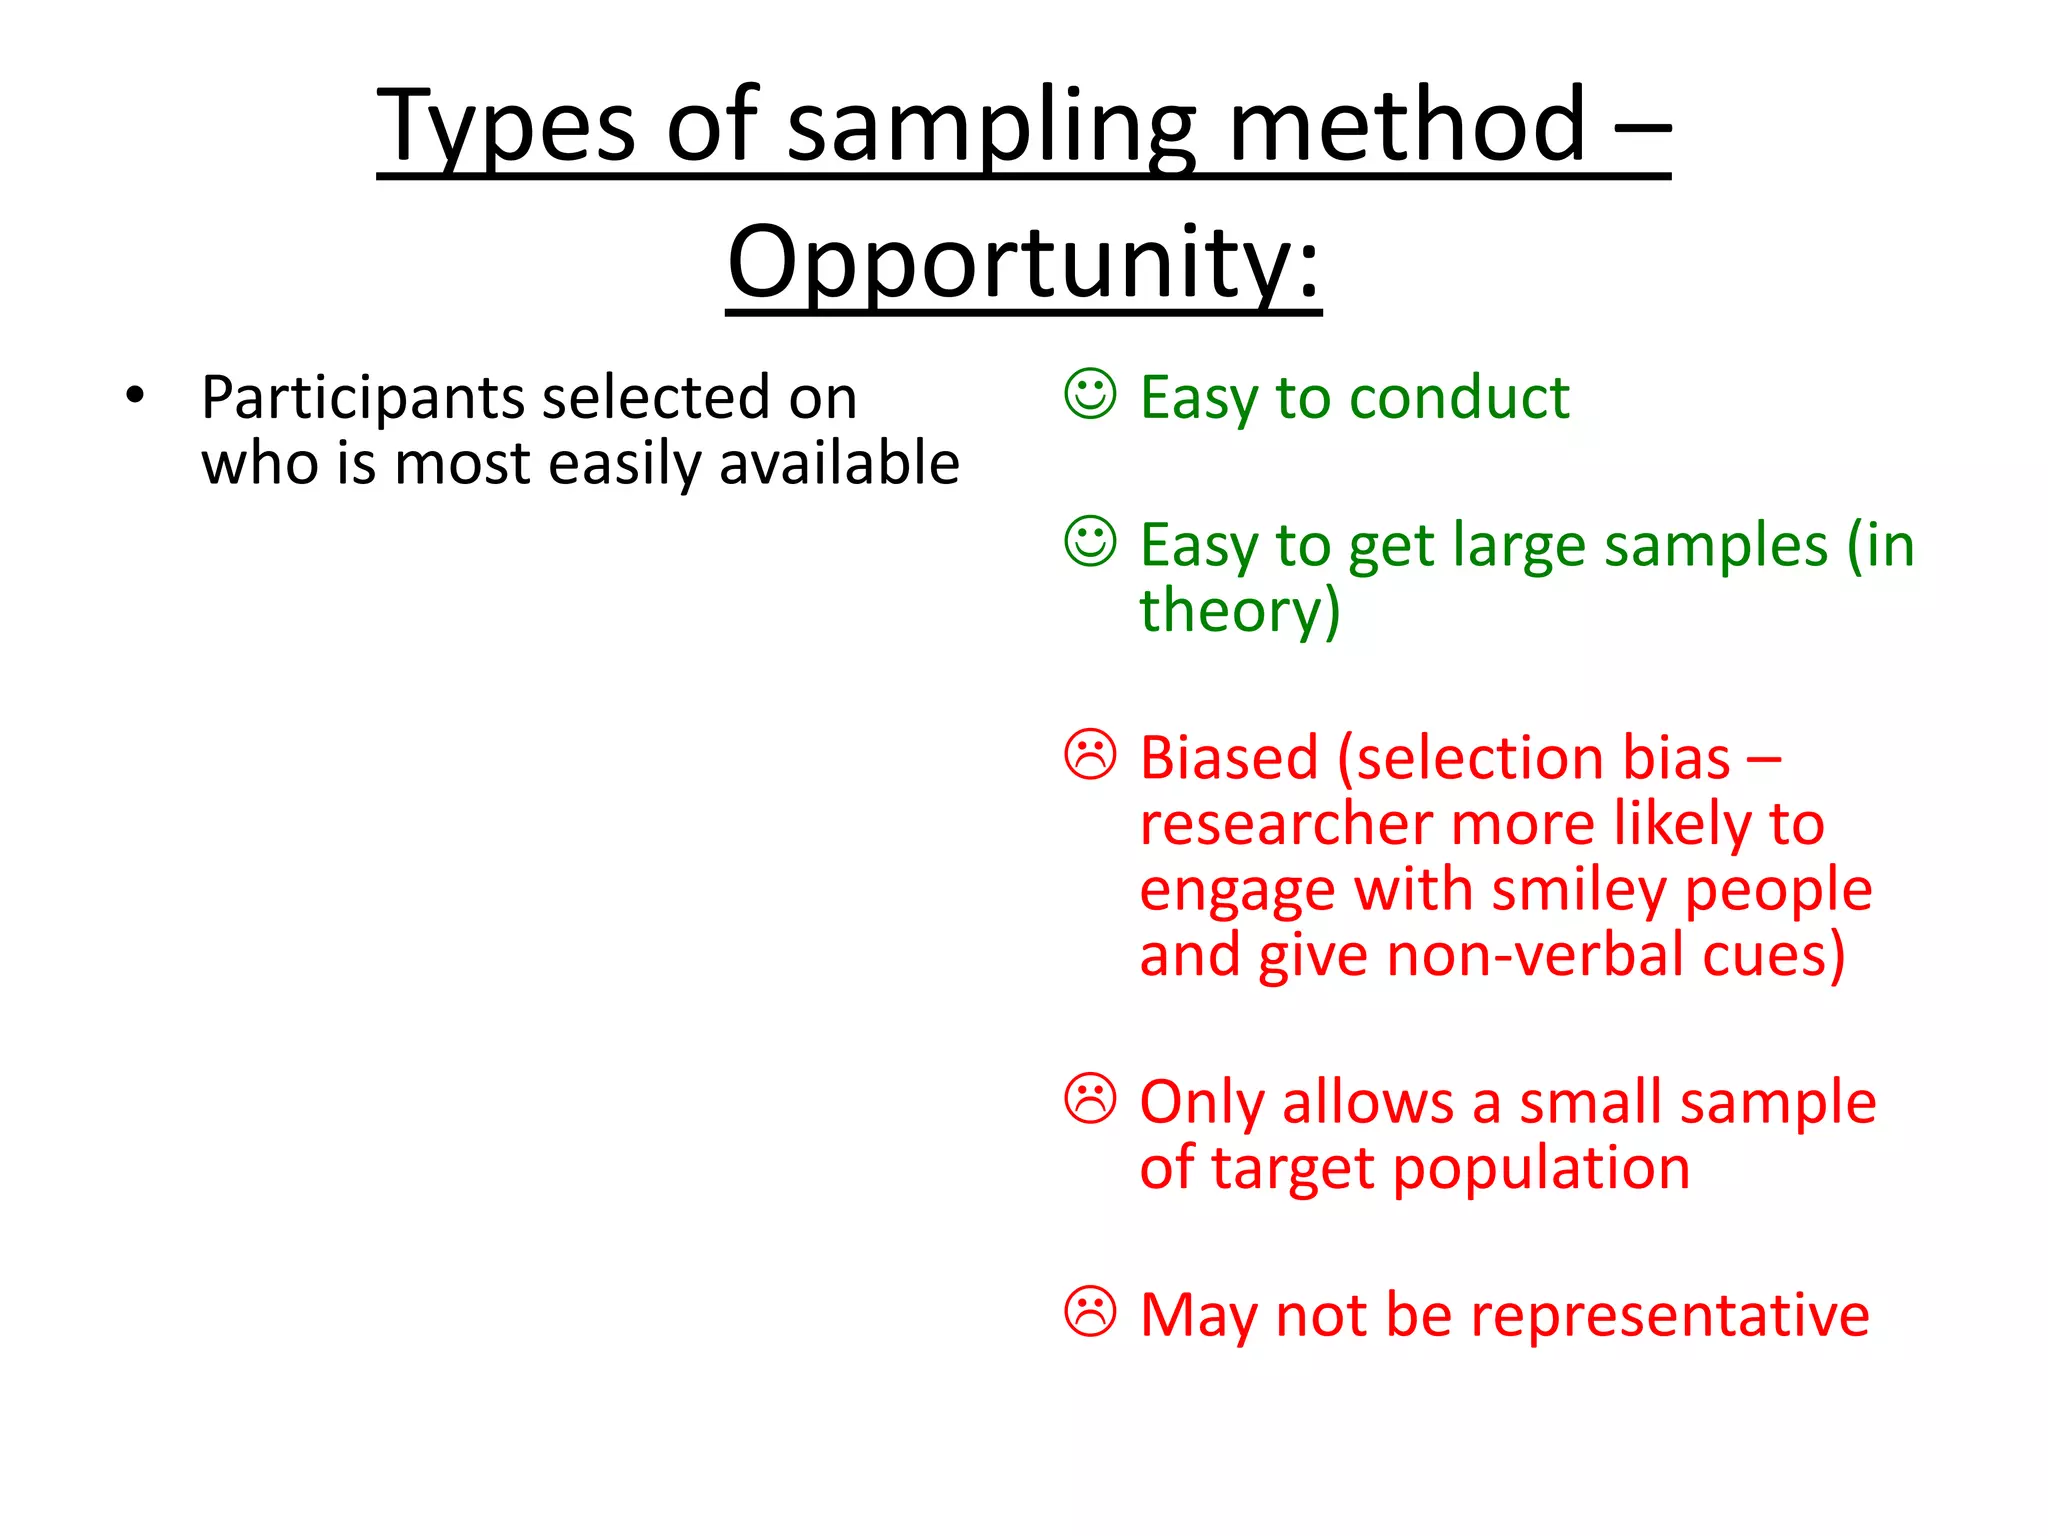
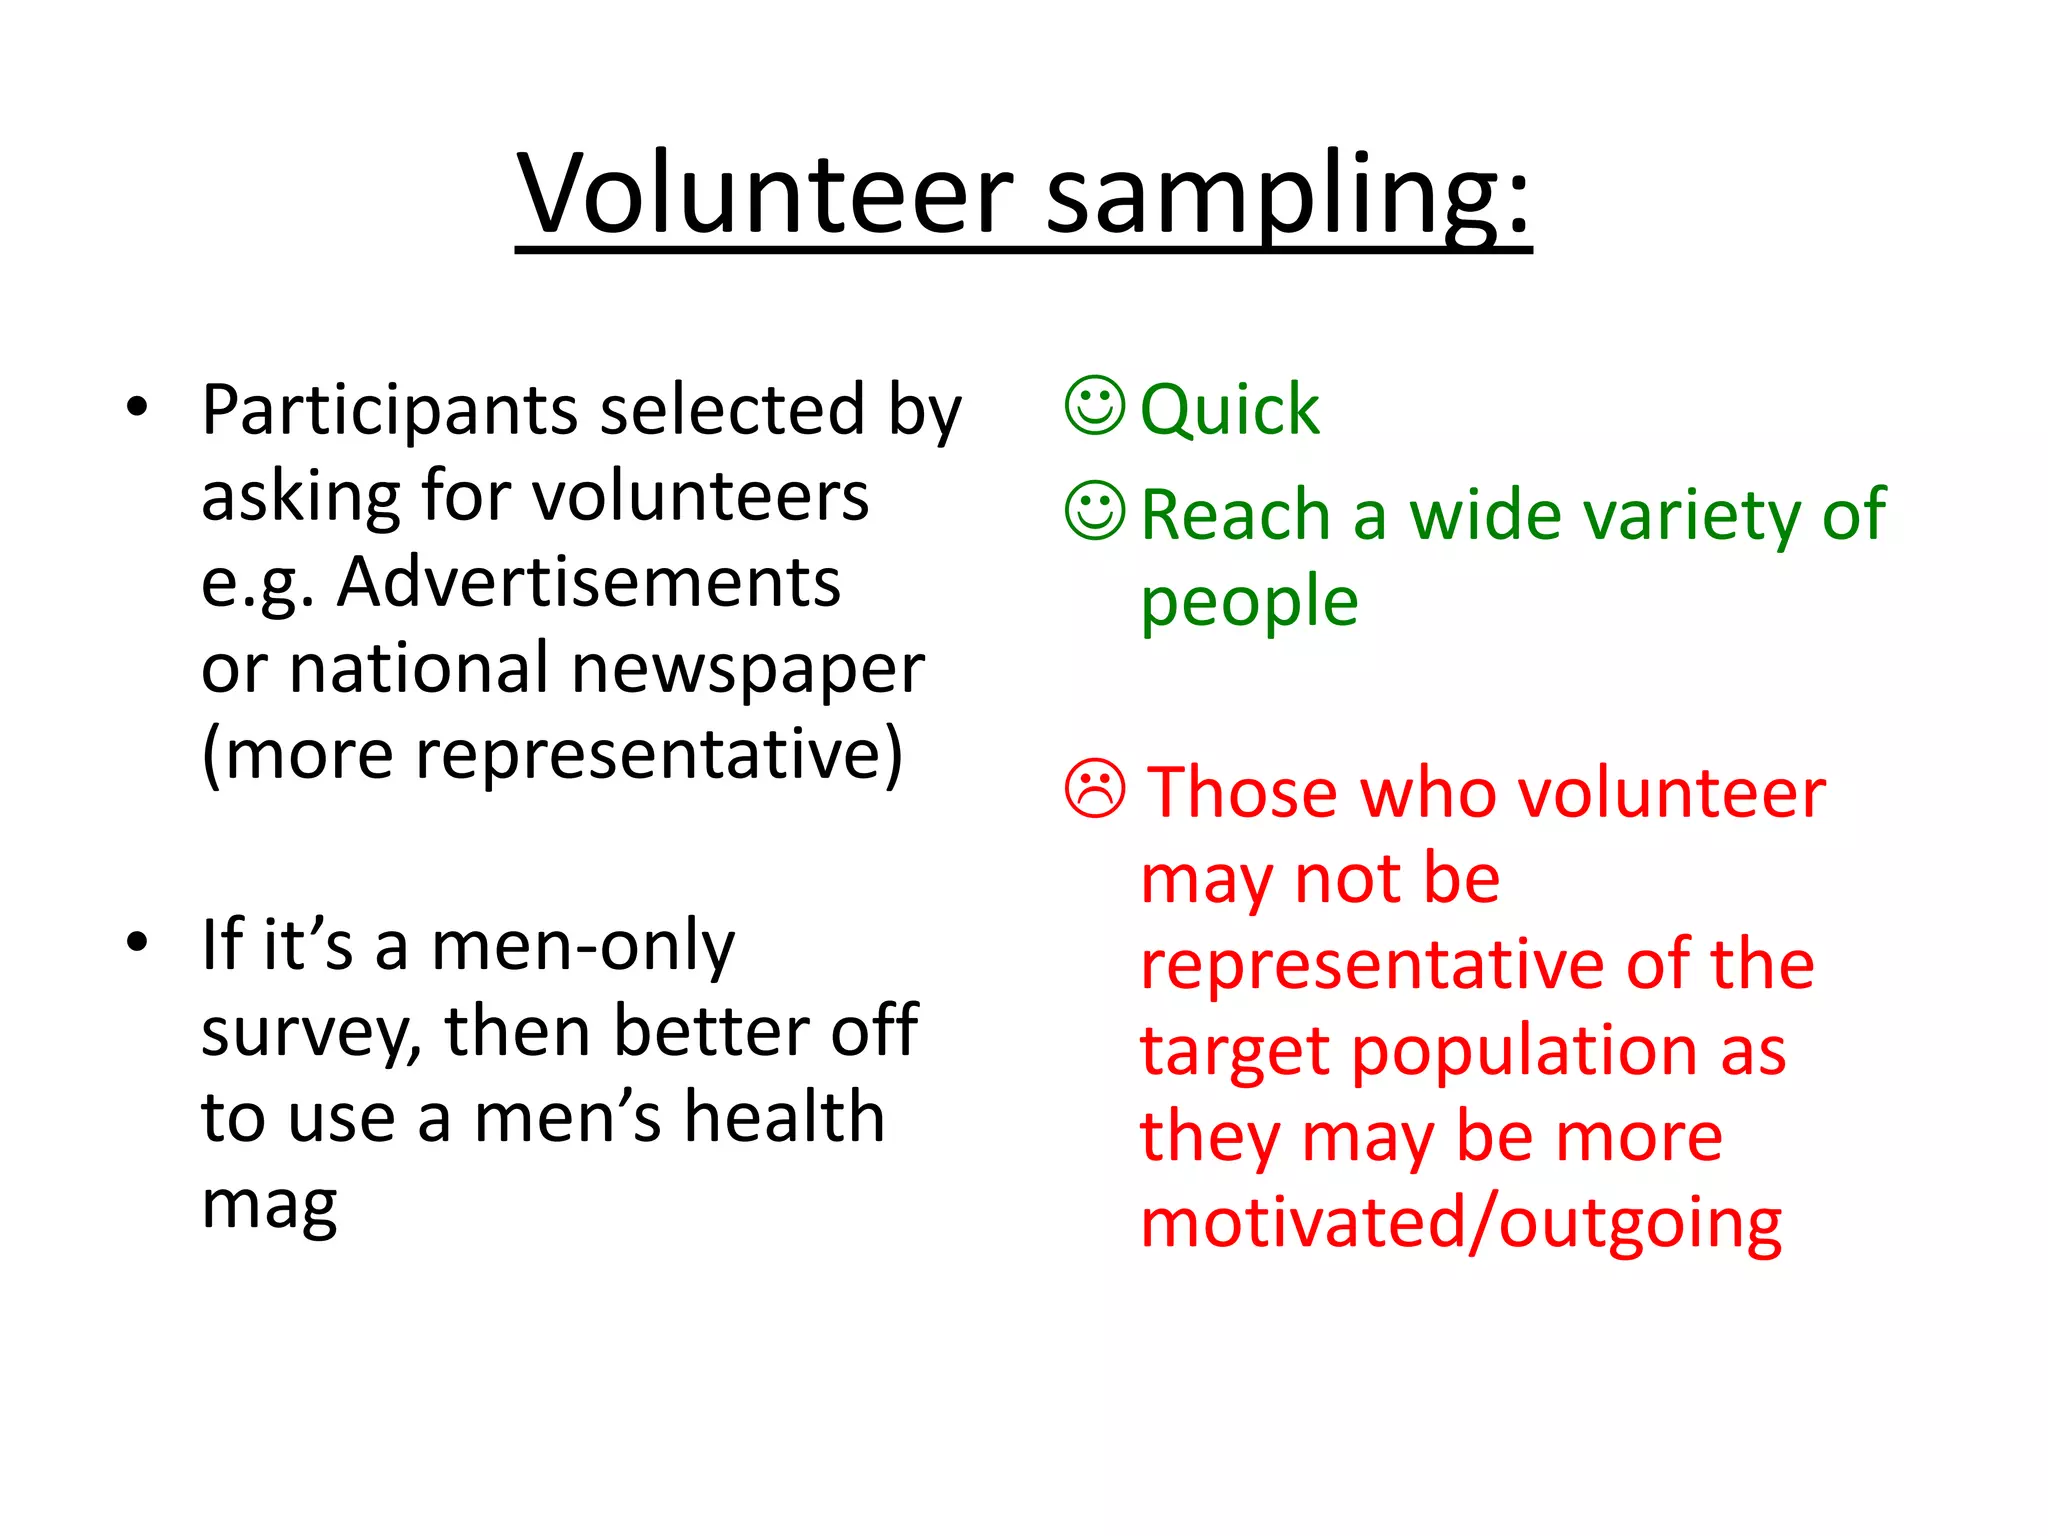
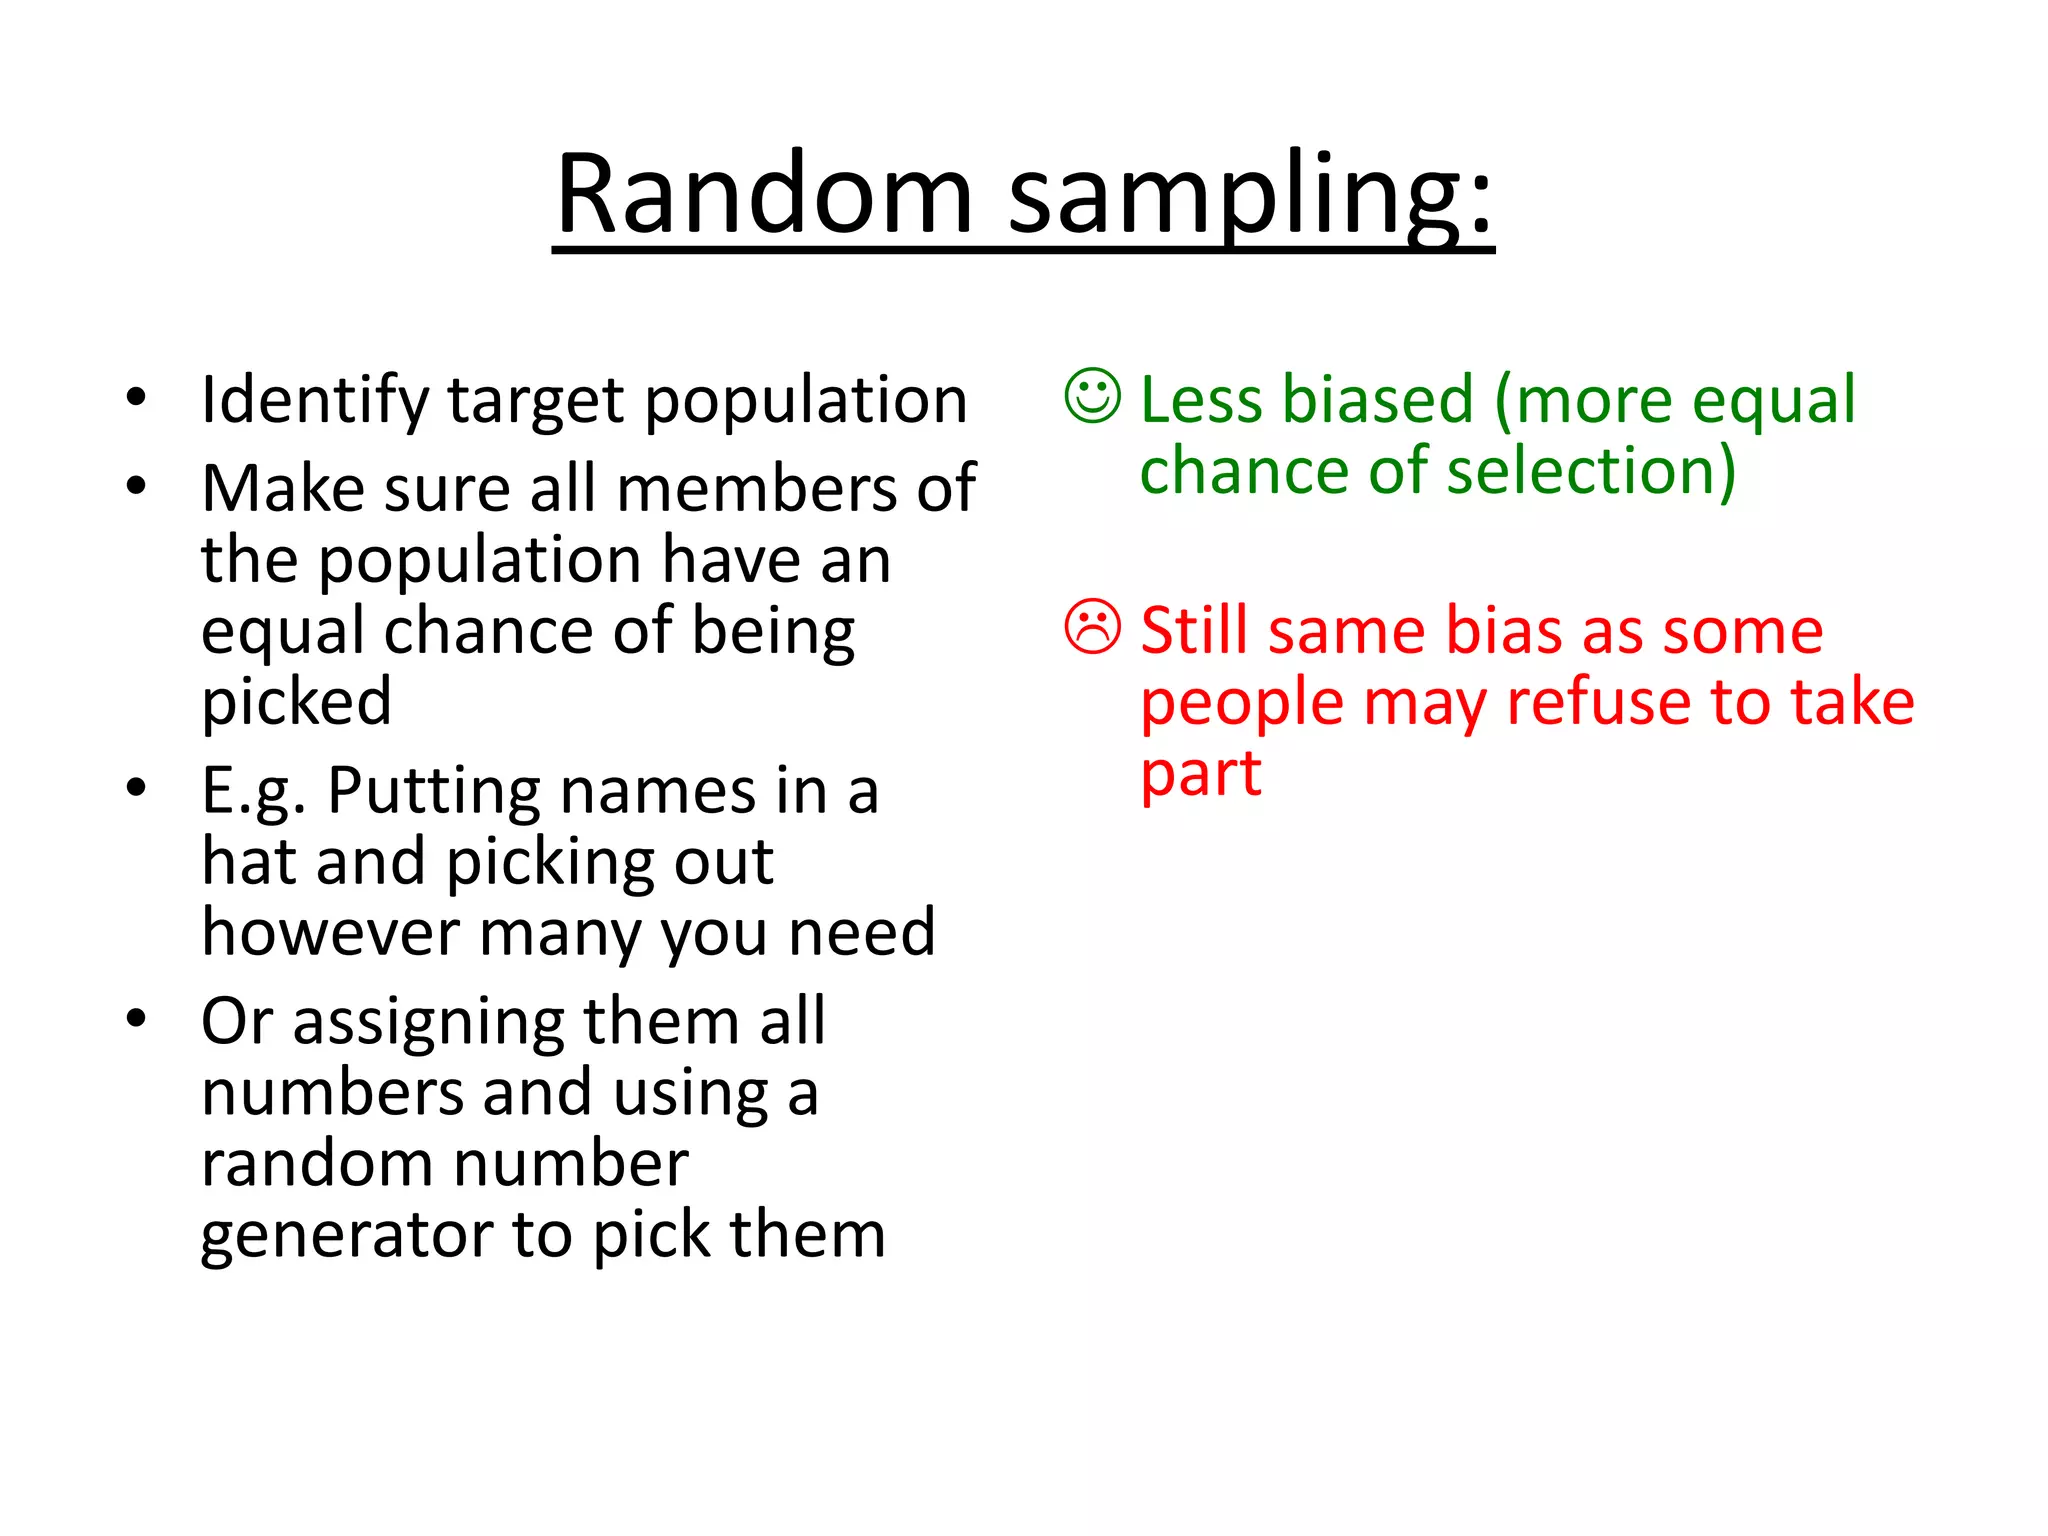
Overview of different sampling methods including opportunity, volunteer, and random sampling with their pros and cons.
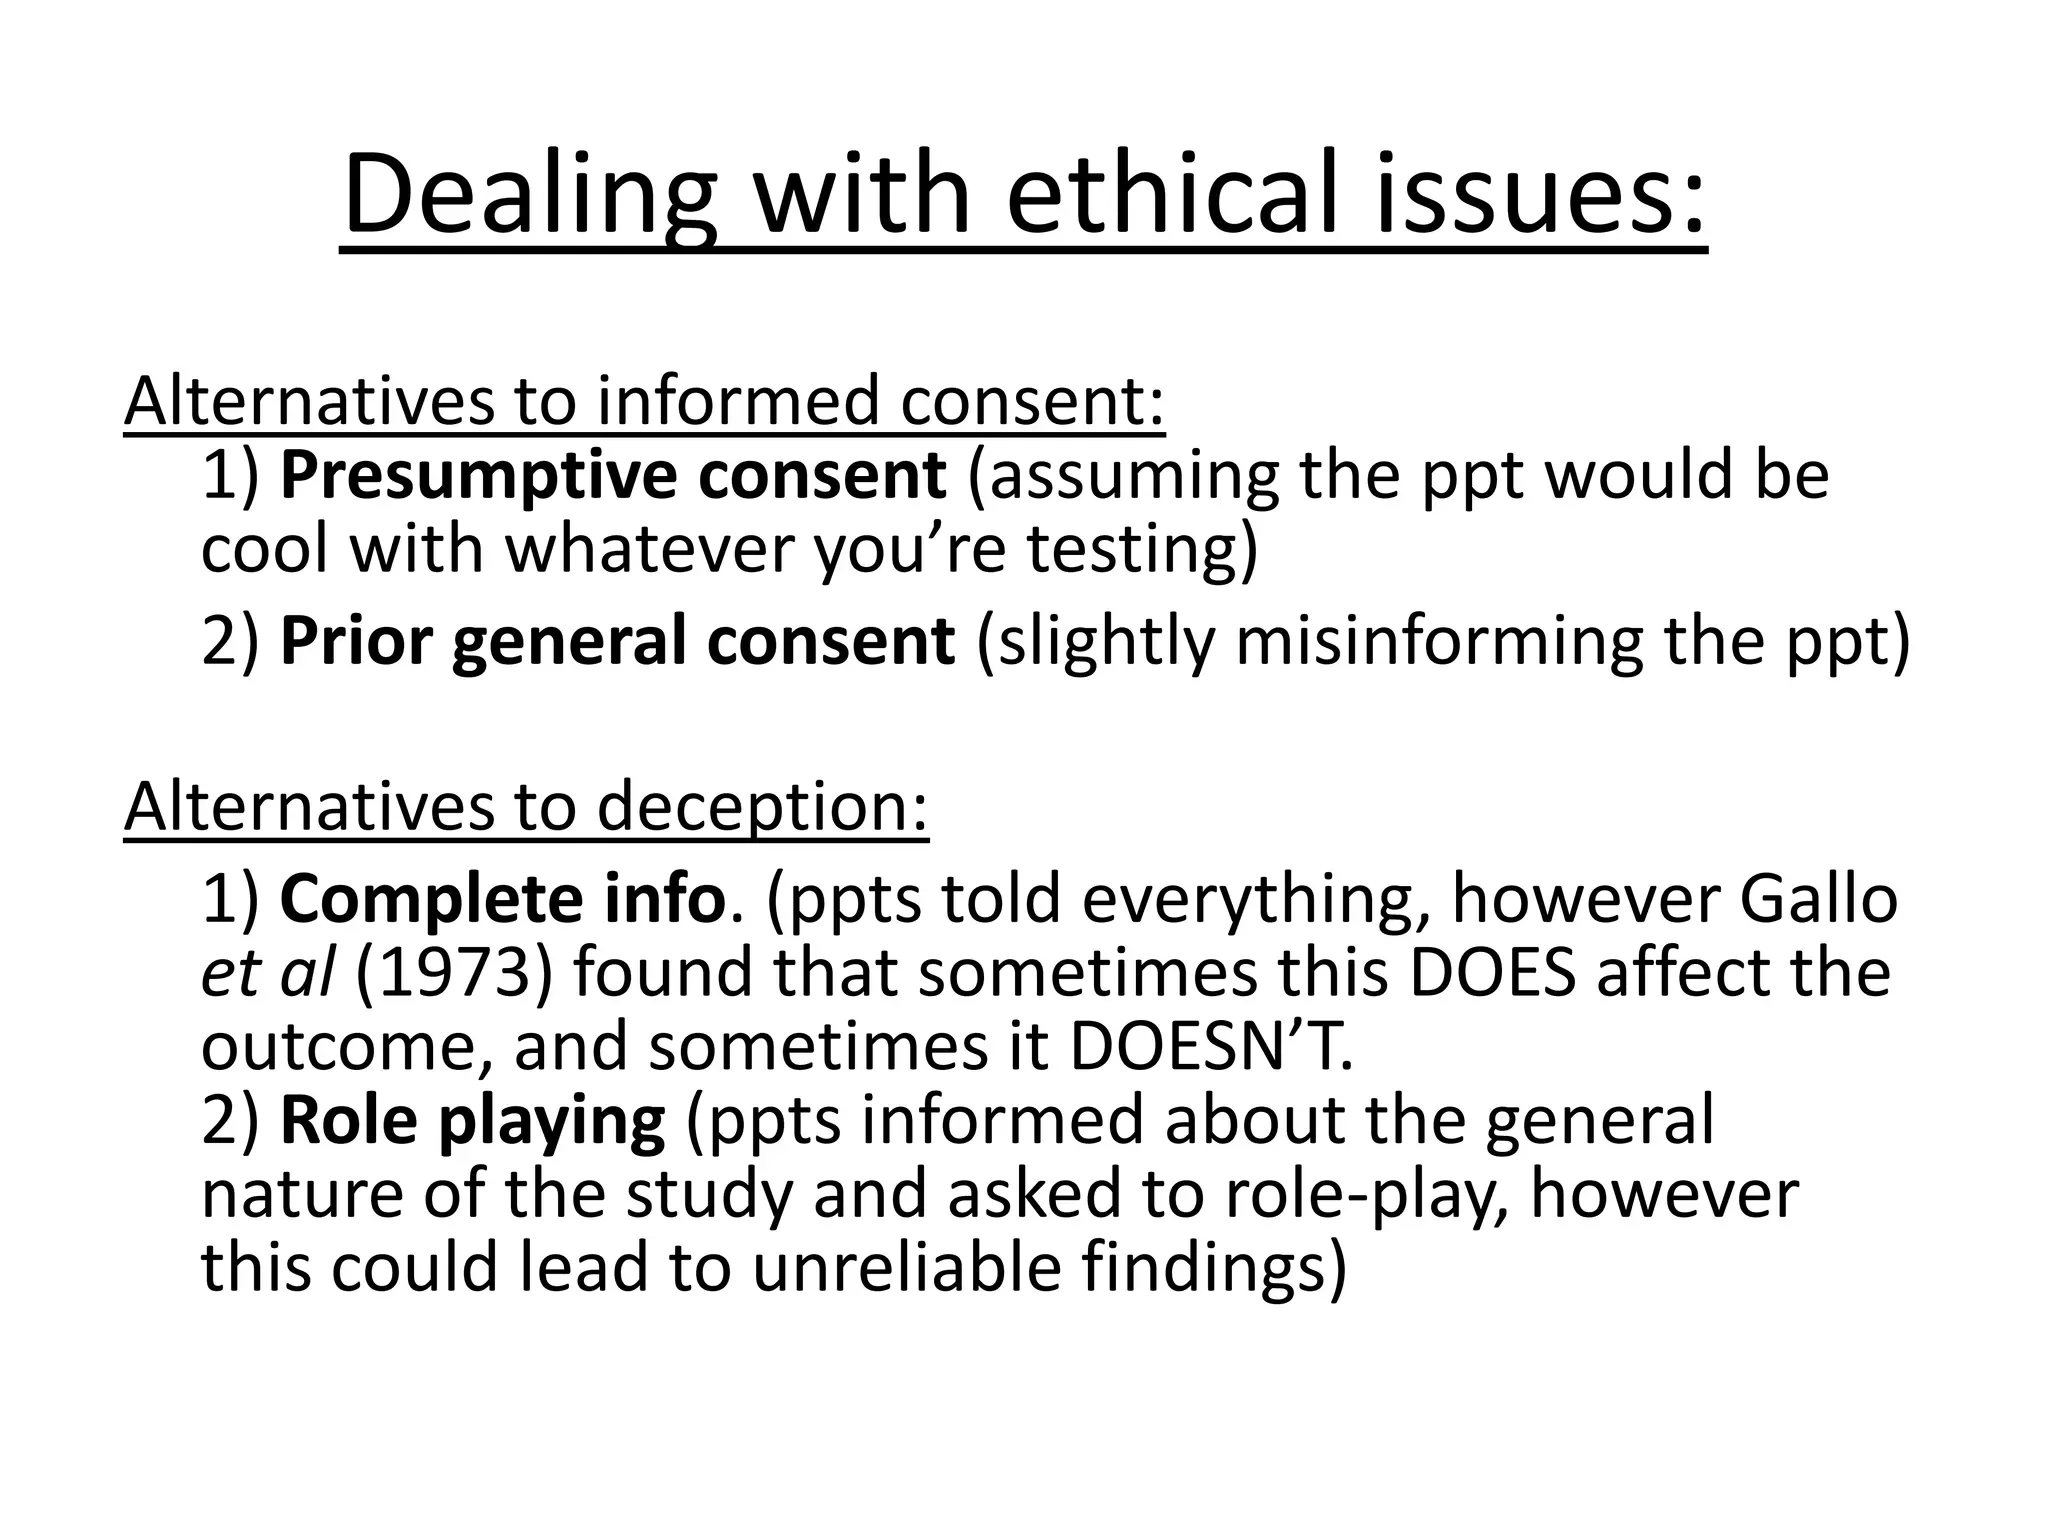
Key ethical issues in research, informed consent, and handling deception.
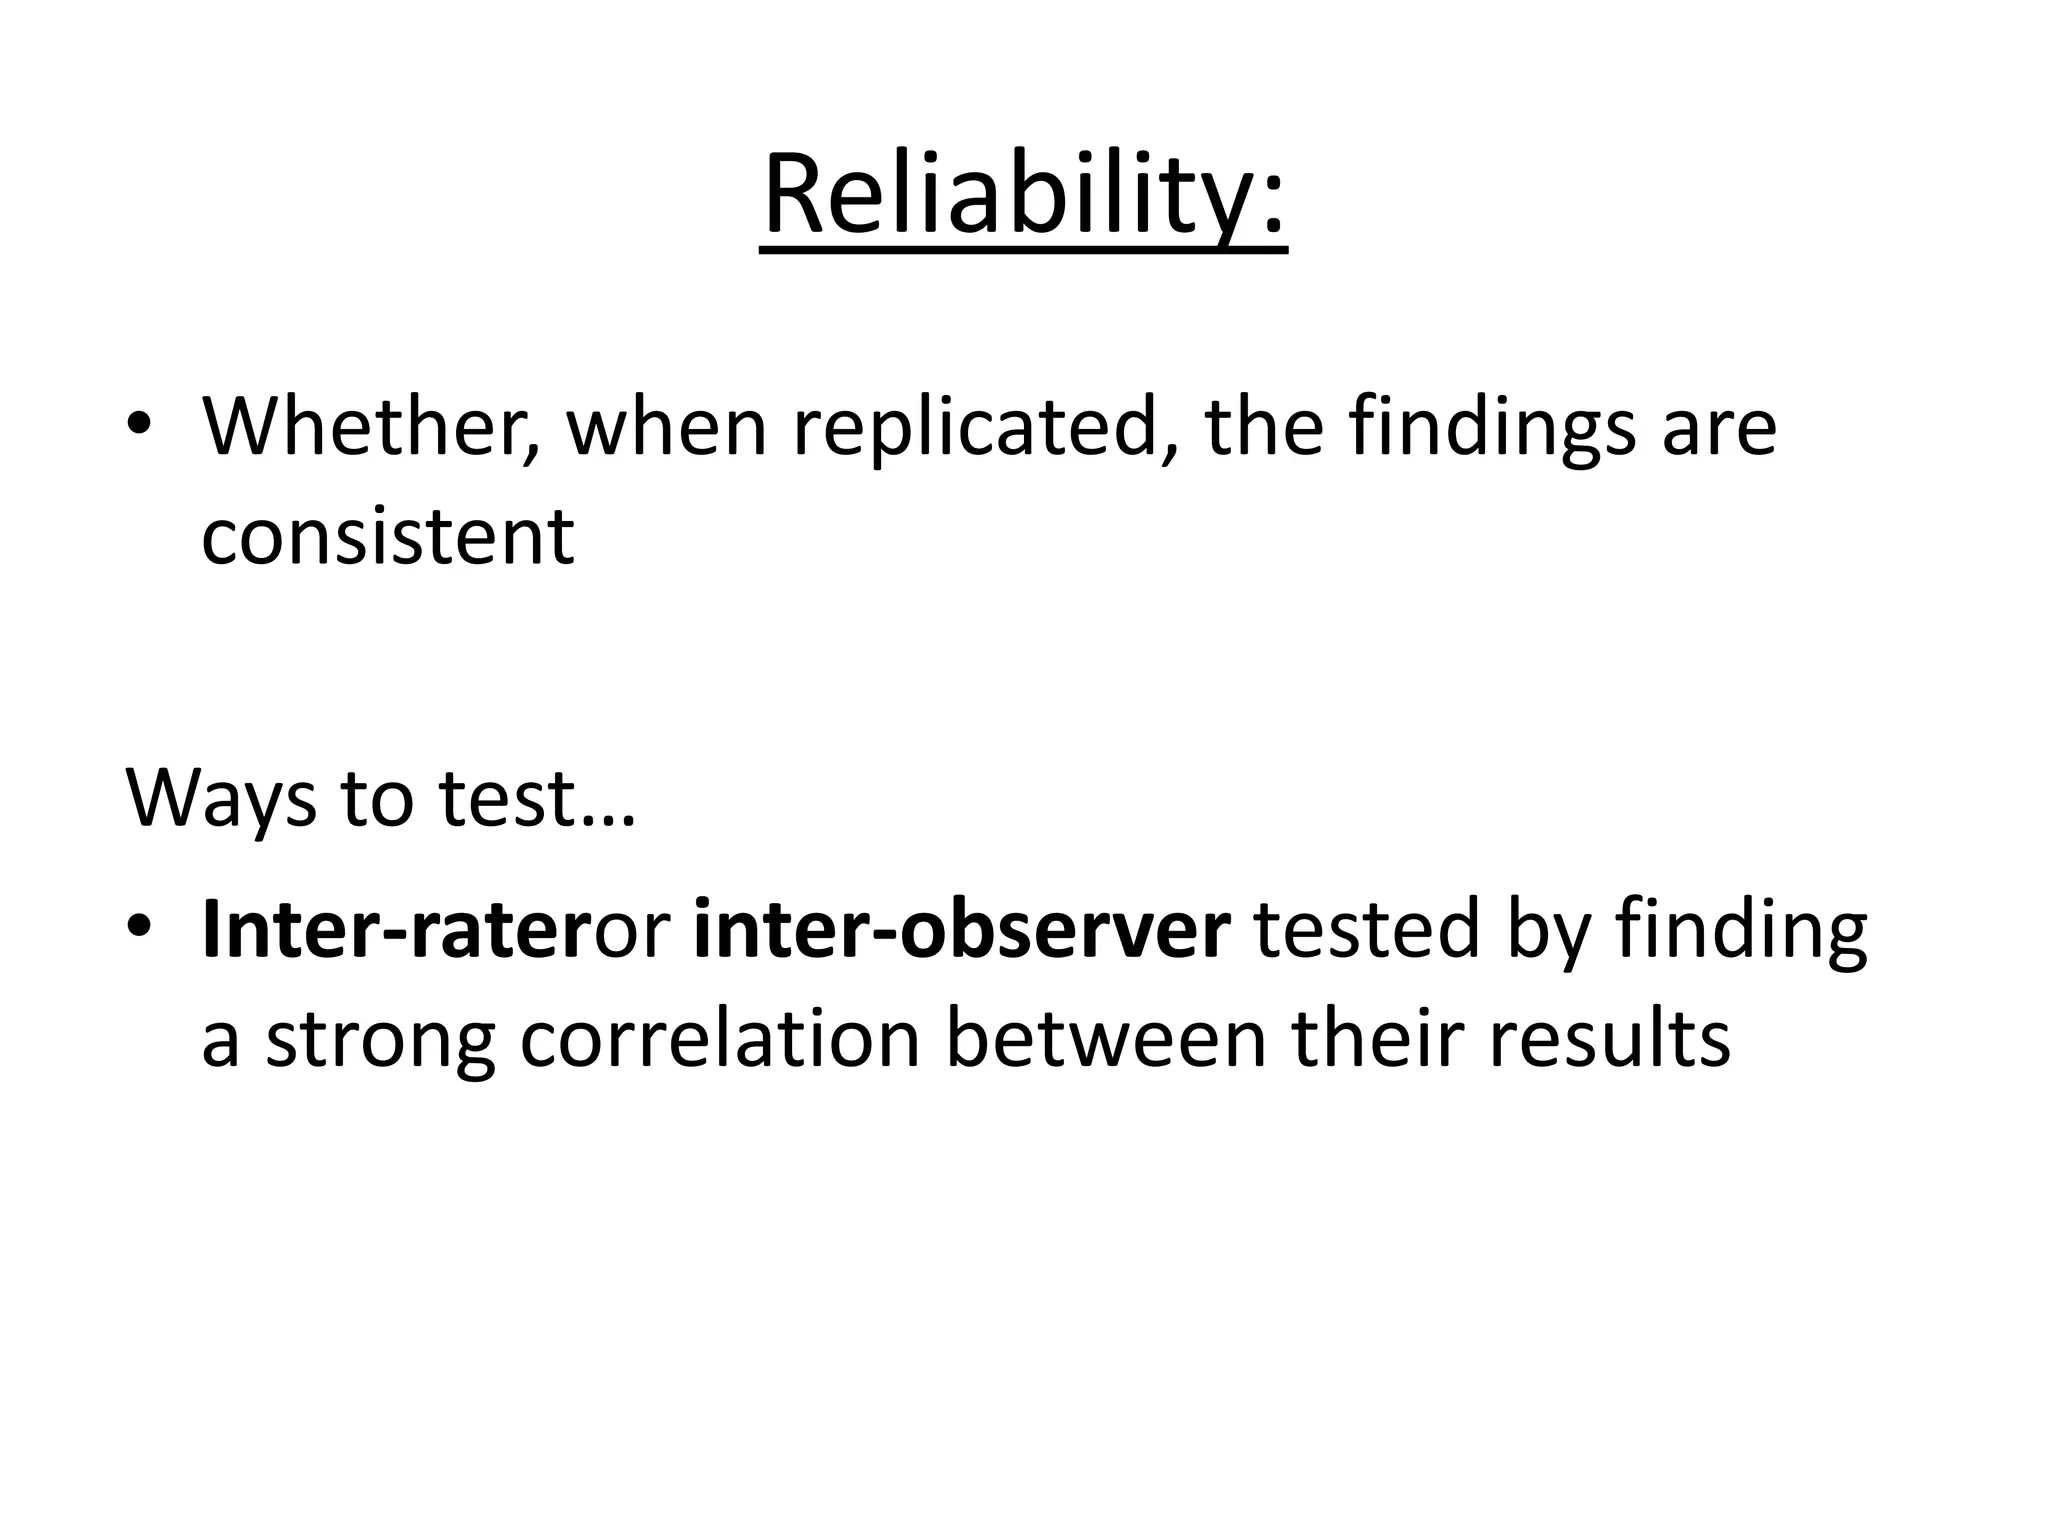
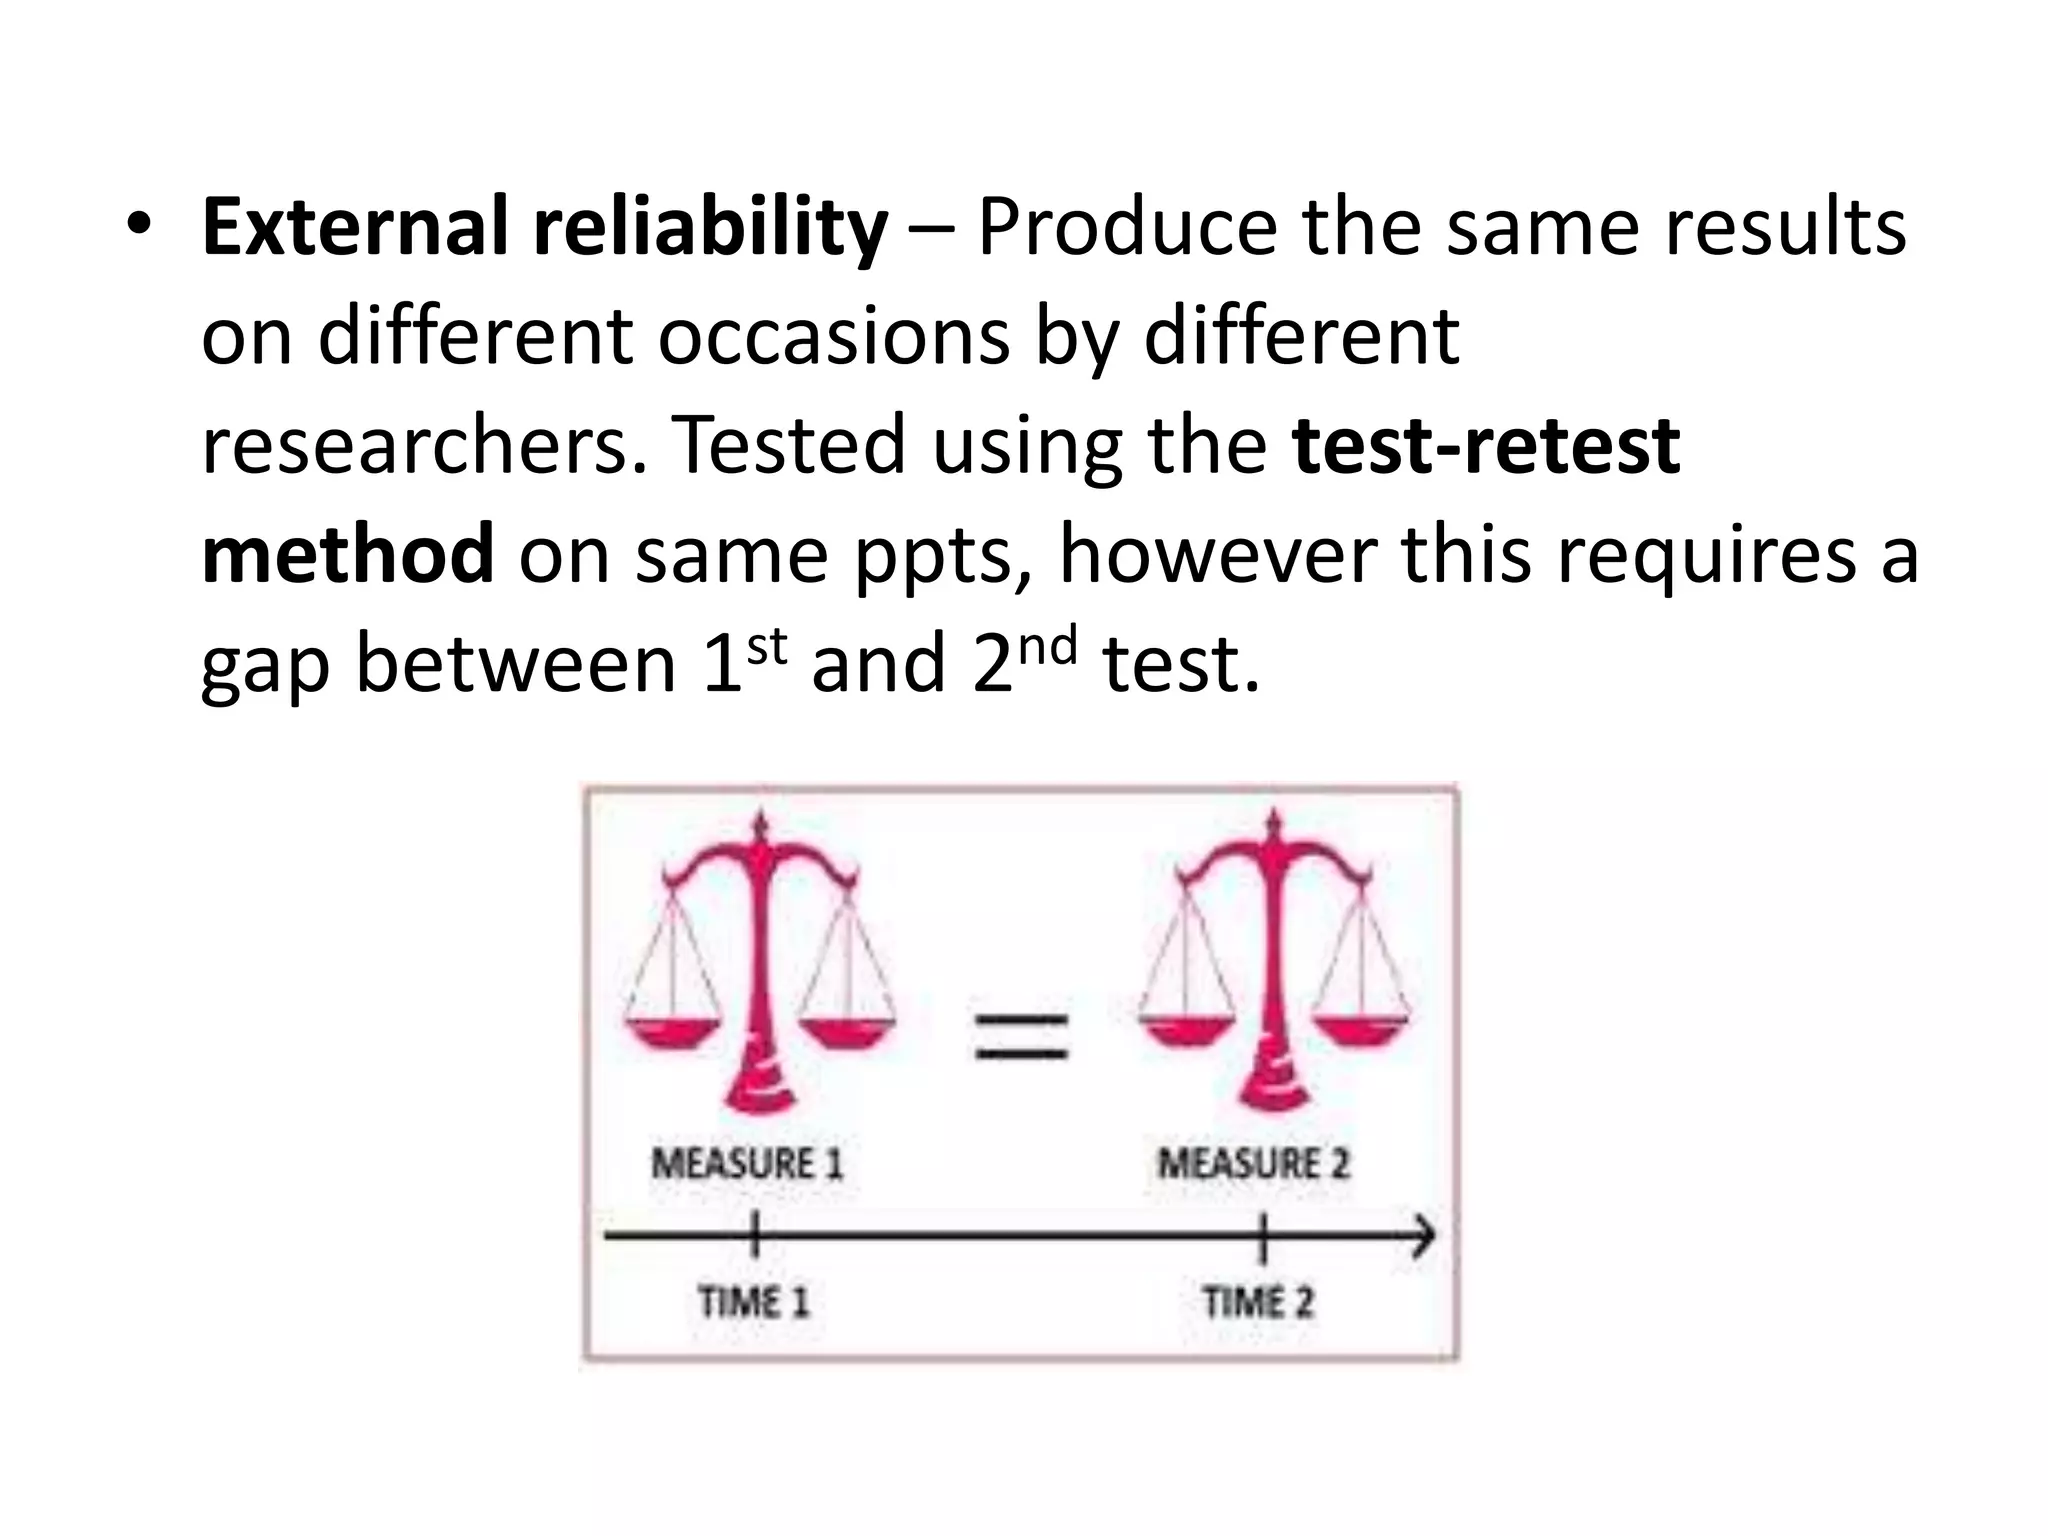
Different forms of reliability: inter-rater, internal, and external reliability testing methods.
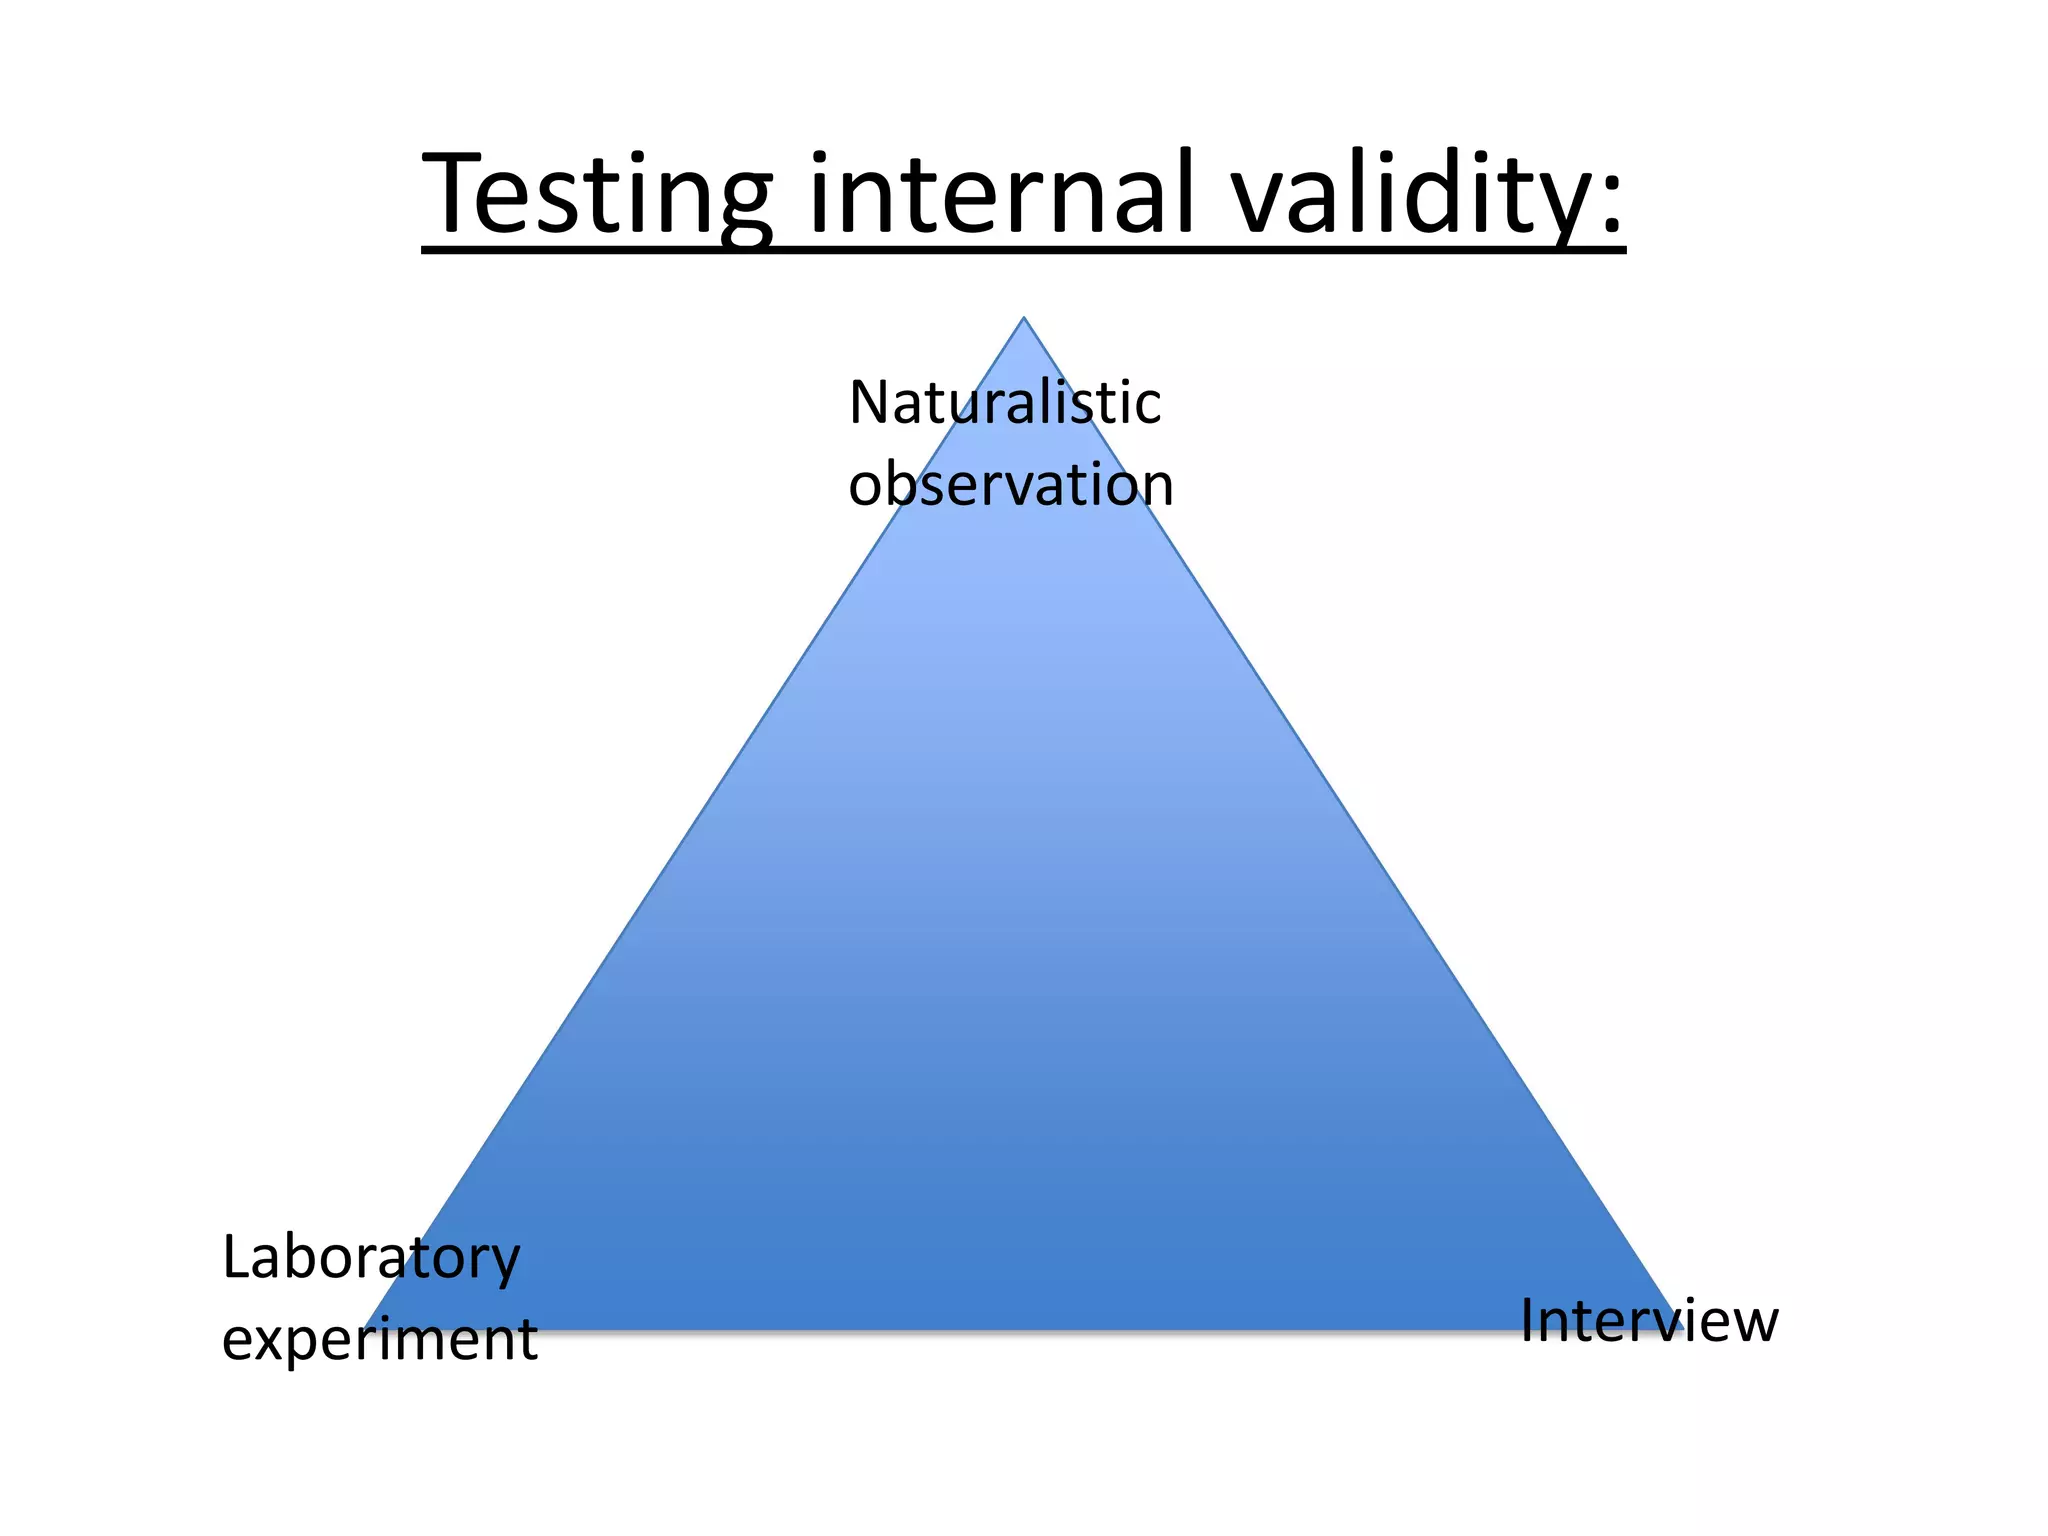
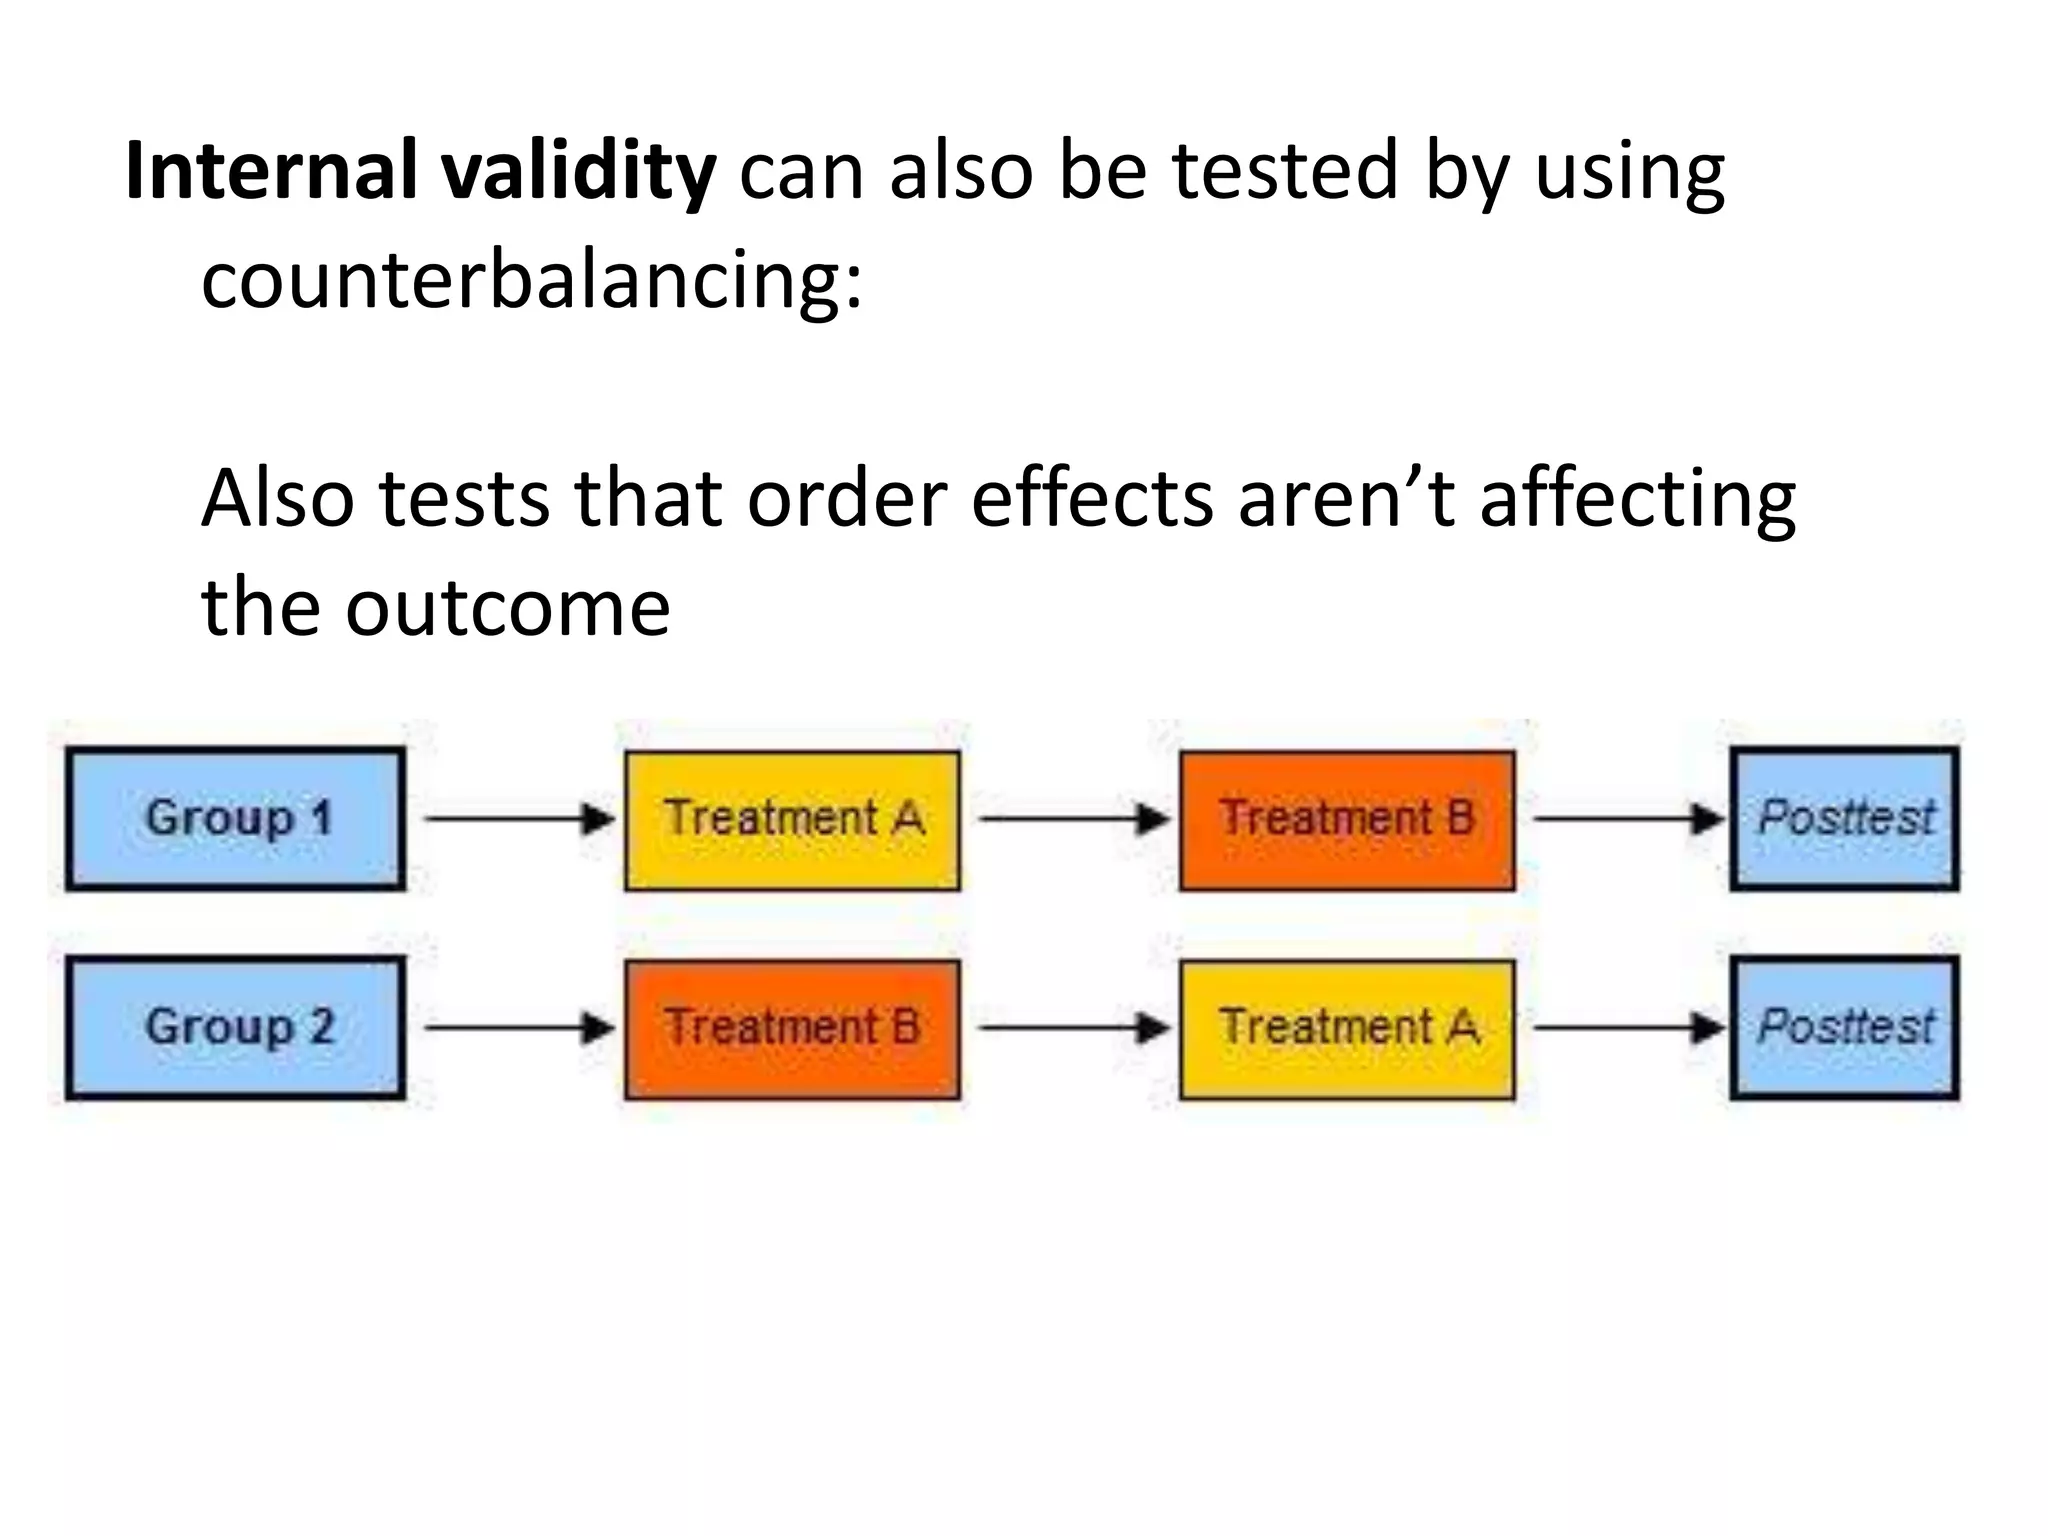
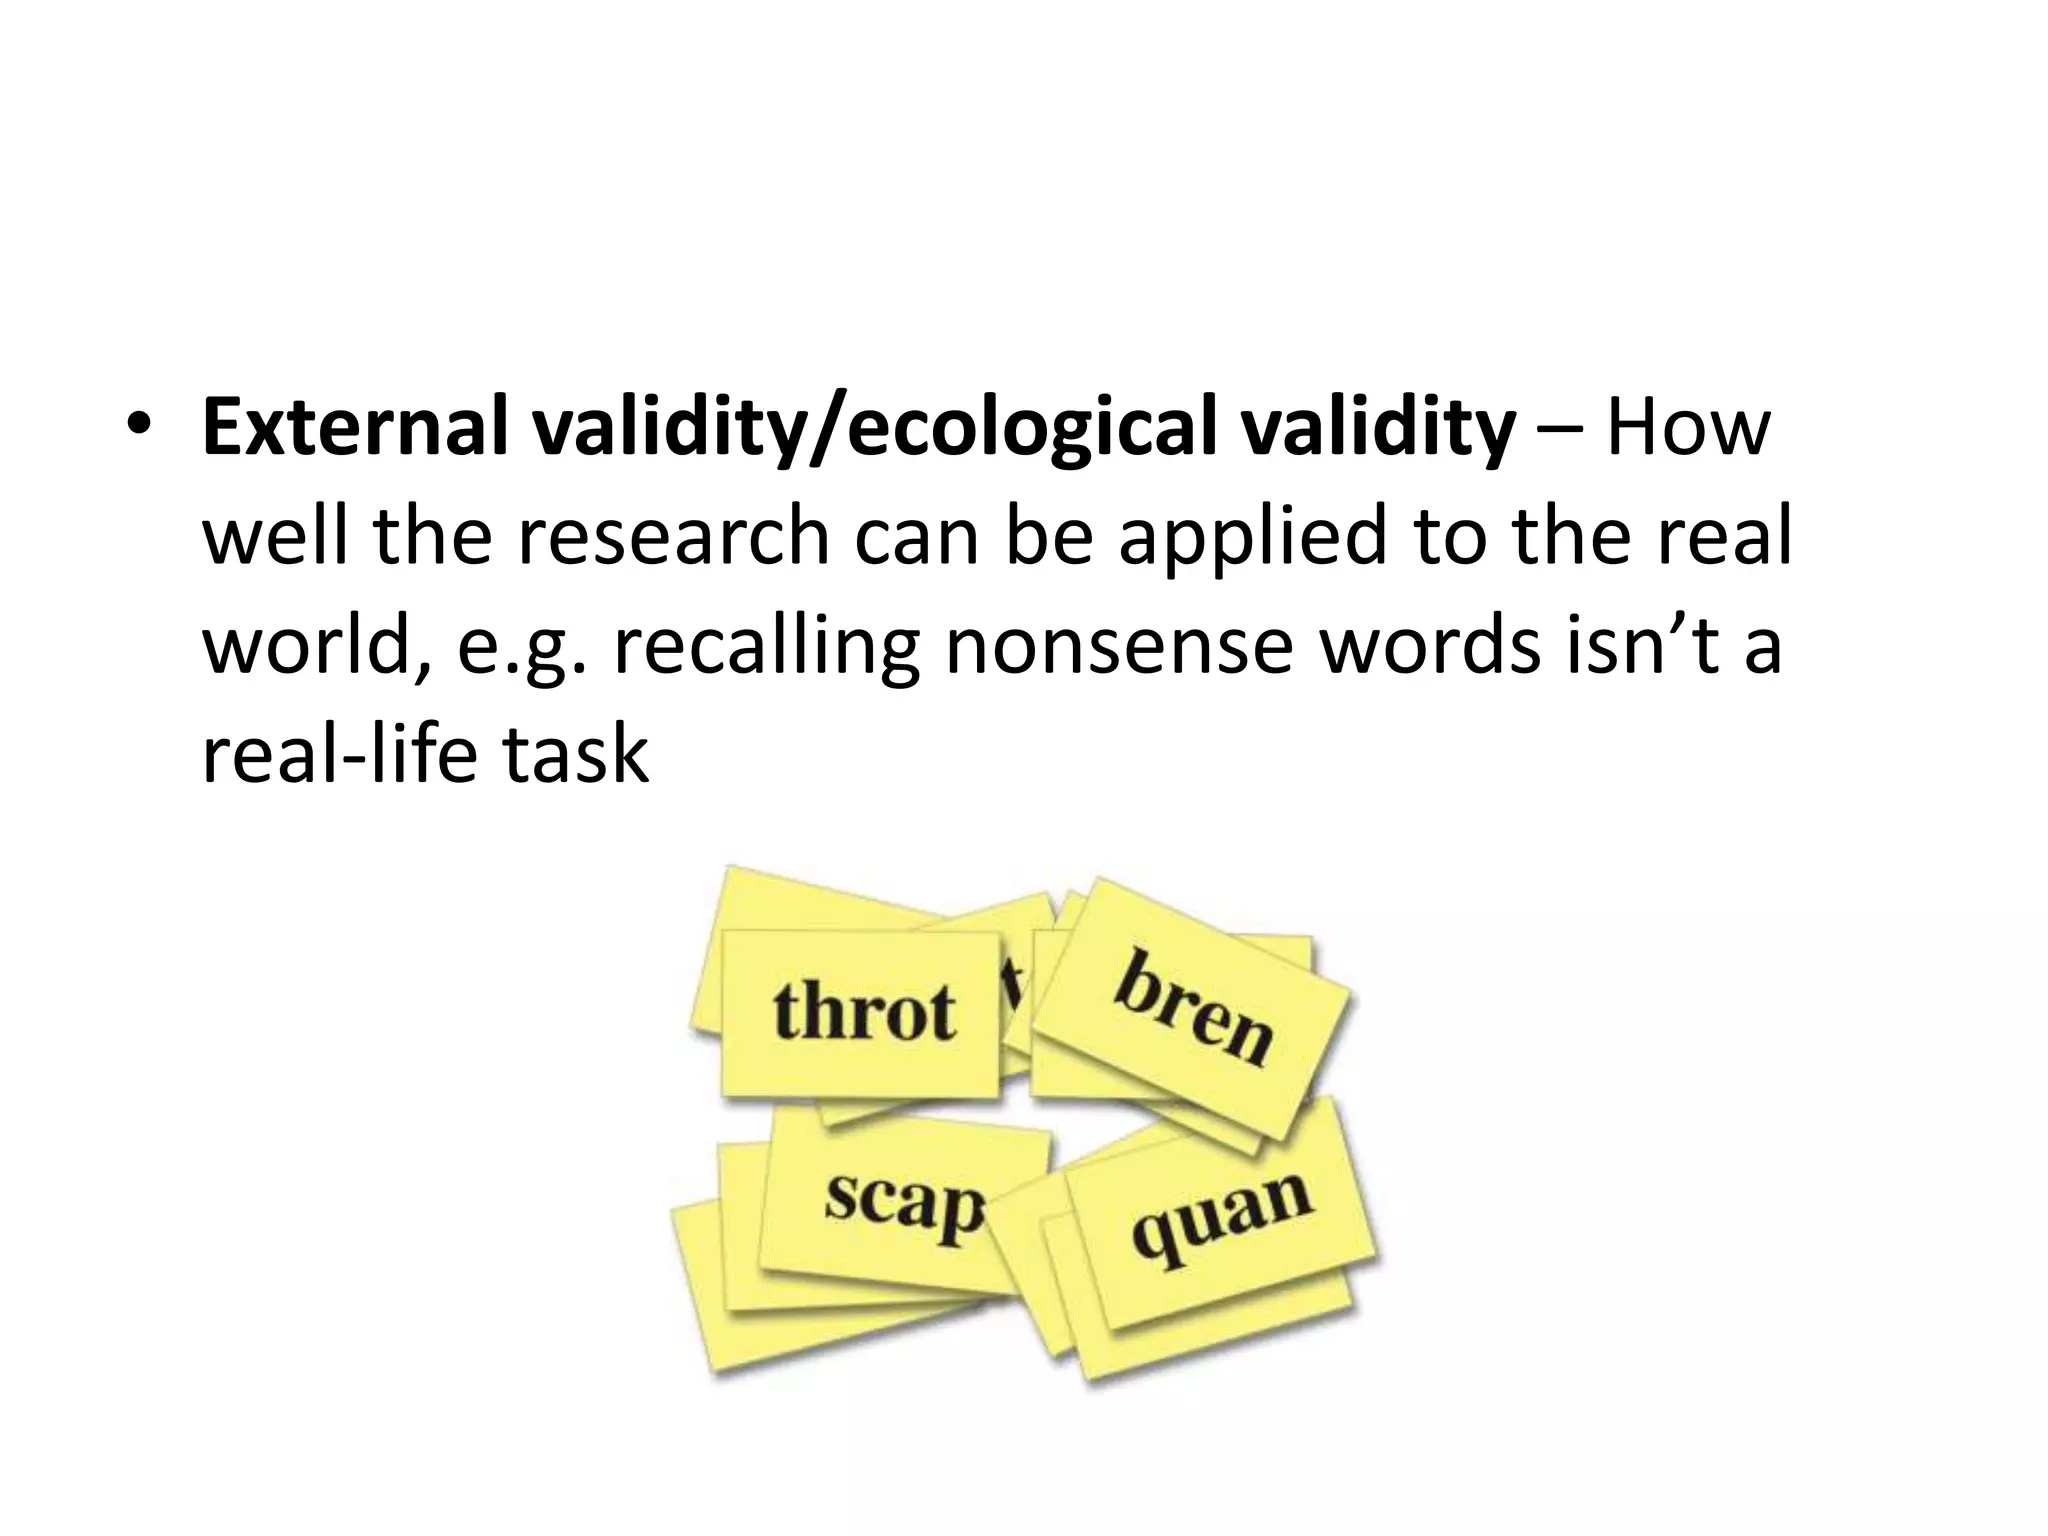
Explains internal and external validity, including methods to test validity in research.
Guidelines for designing a research question and template for methodological critique.


![PSYA3 Cognitive [in progress]](https://cdn.slidesharecdn.com/ss_thumbnails/psya3cognitiveupdated2-130528174445-phpapp01-thumbnail.jpg?width=640&height=640&fit=bounds)


