Download as PDF, PPTX
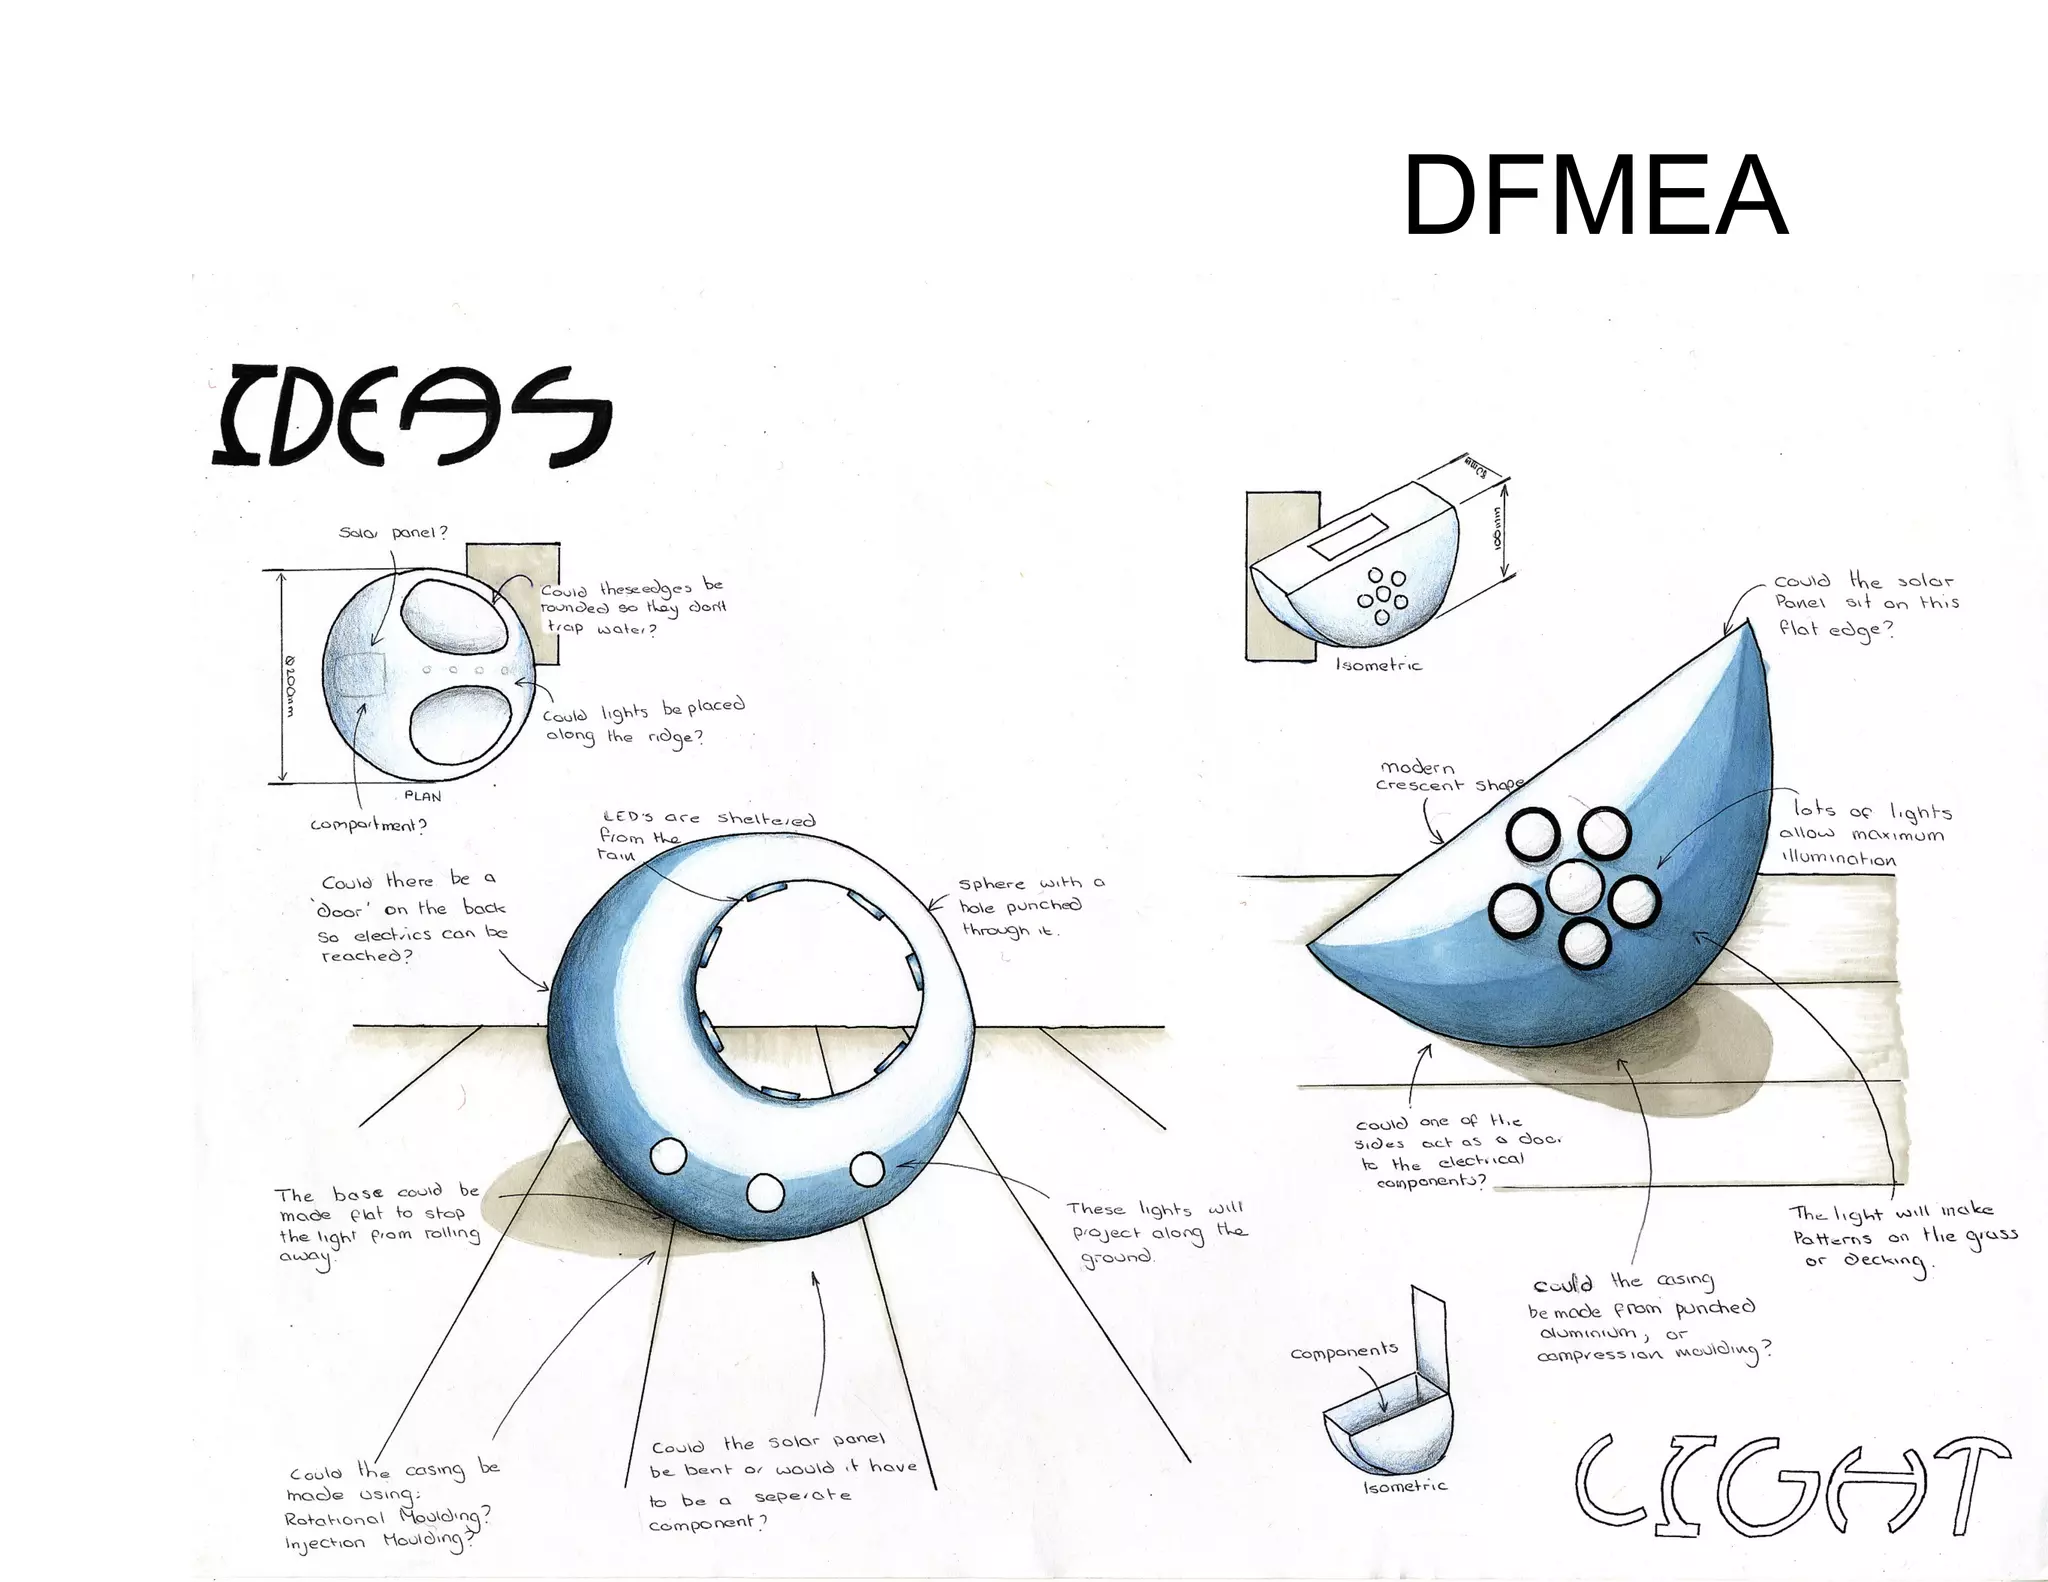
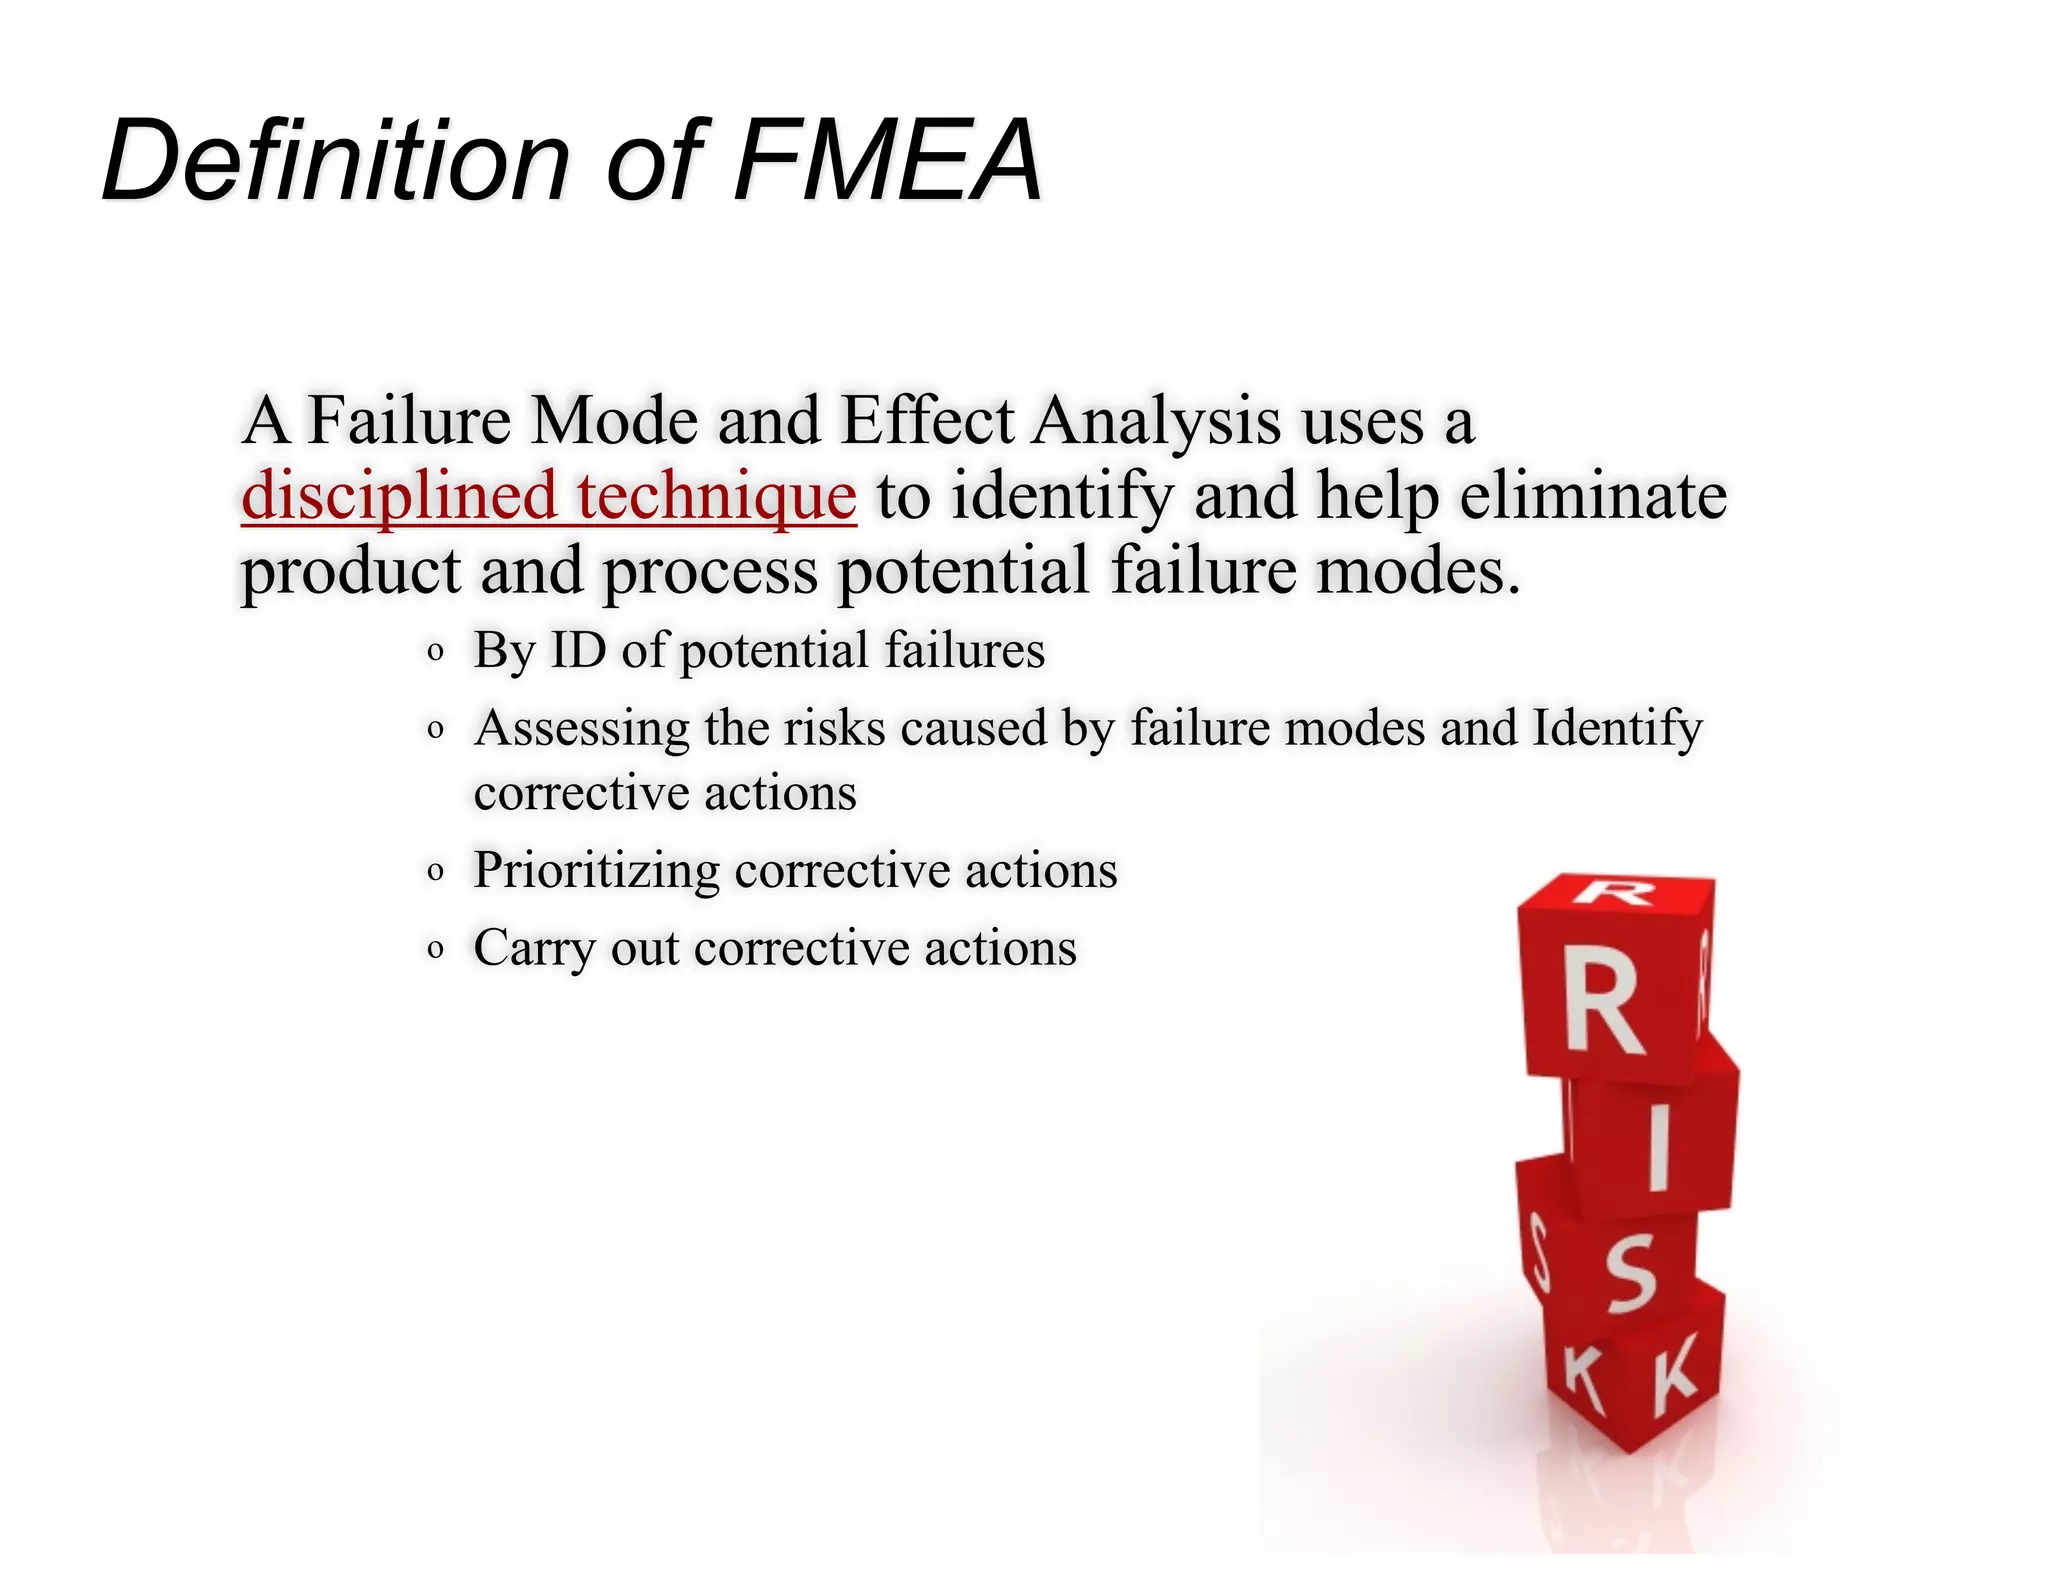
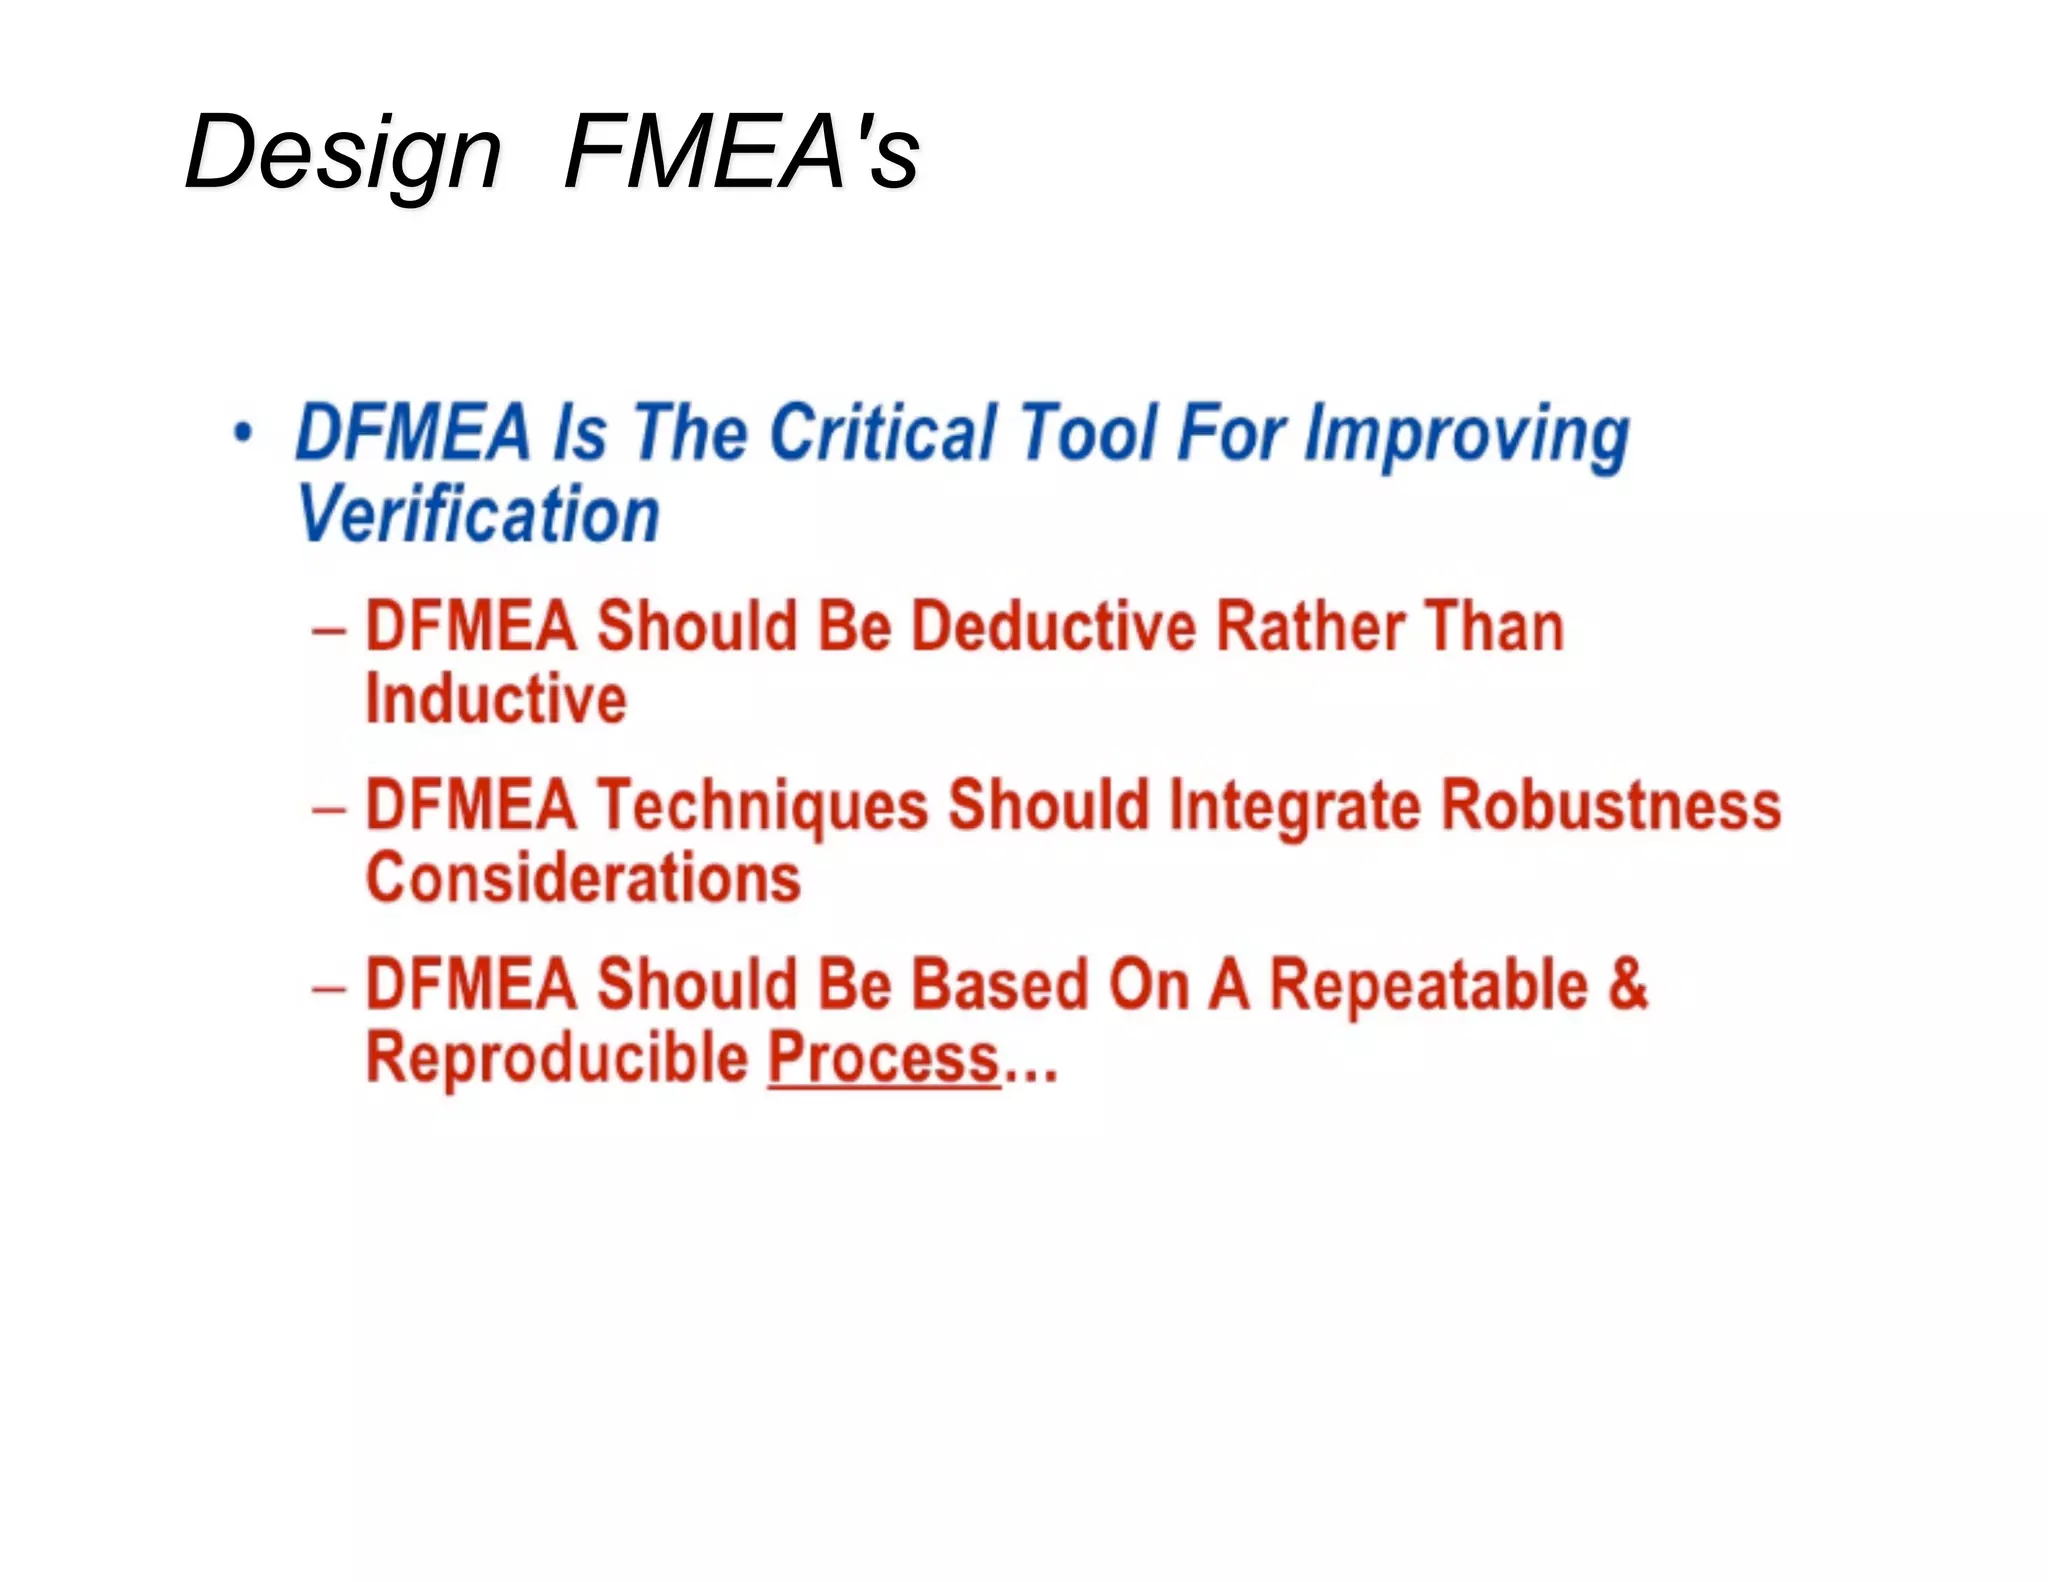

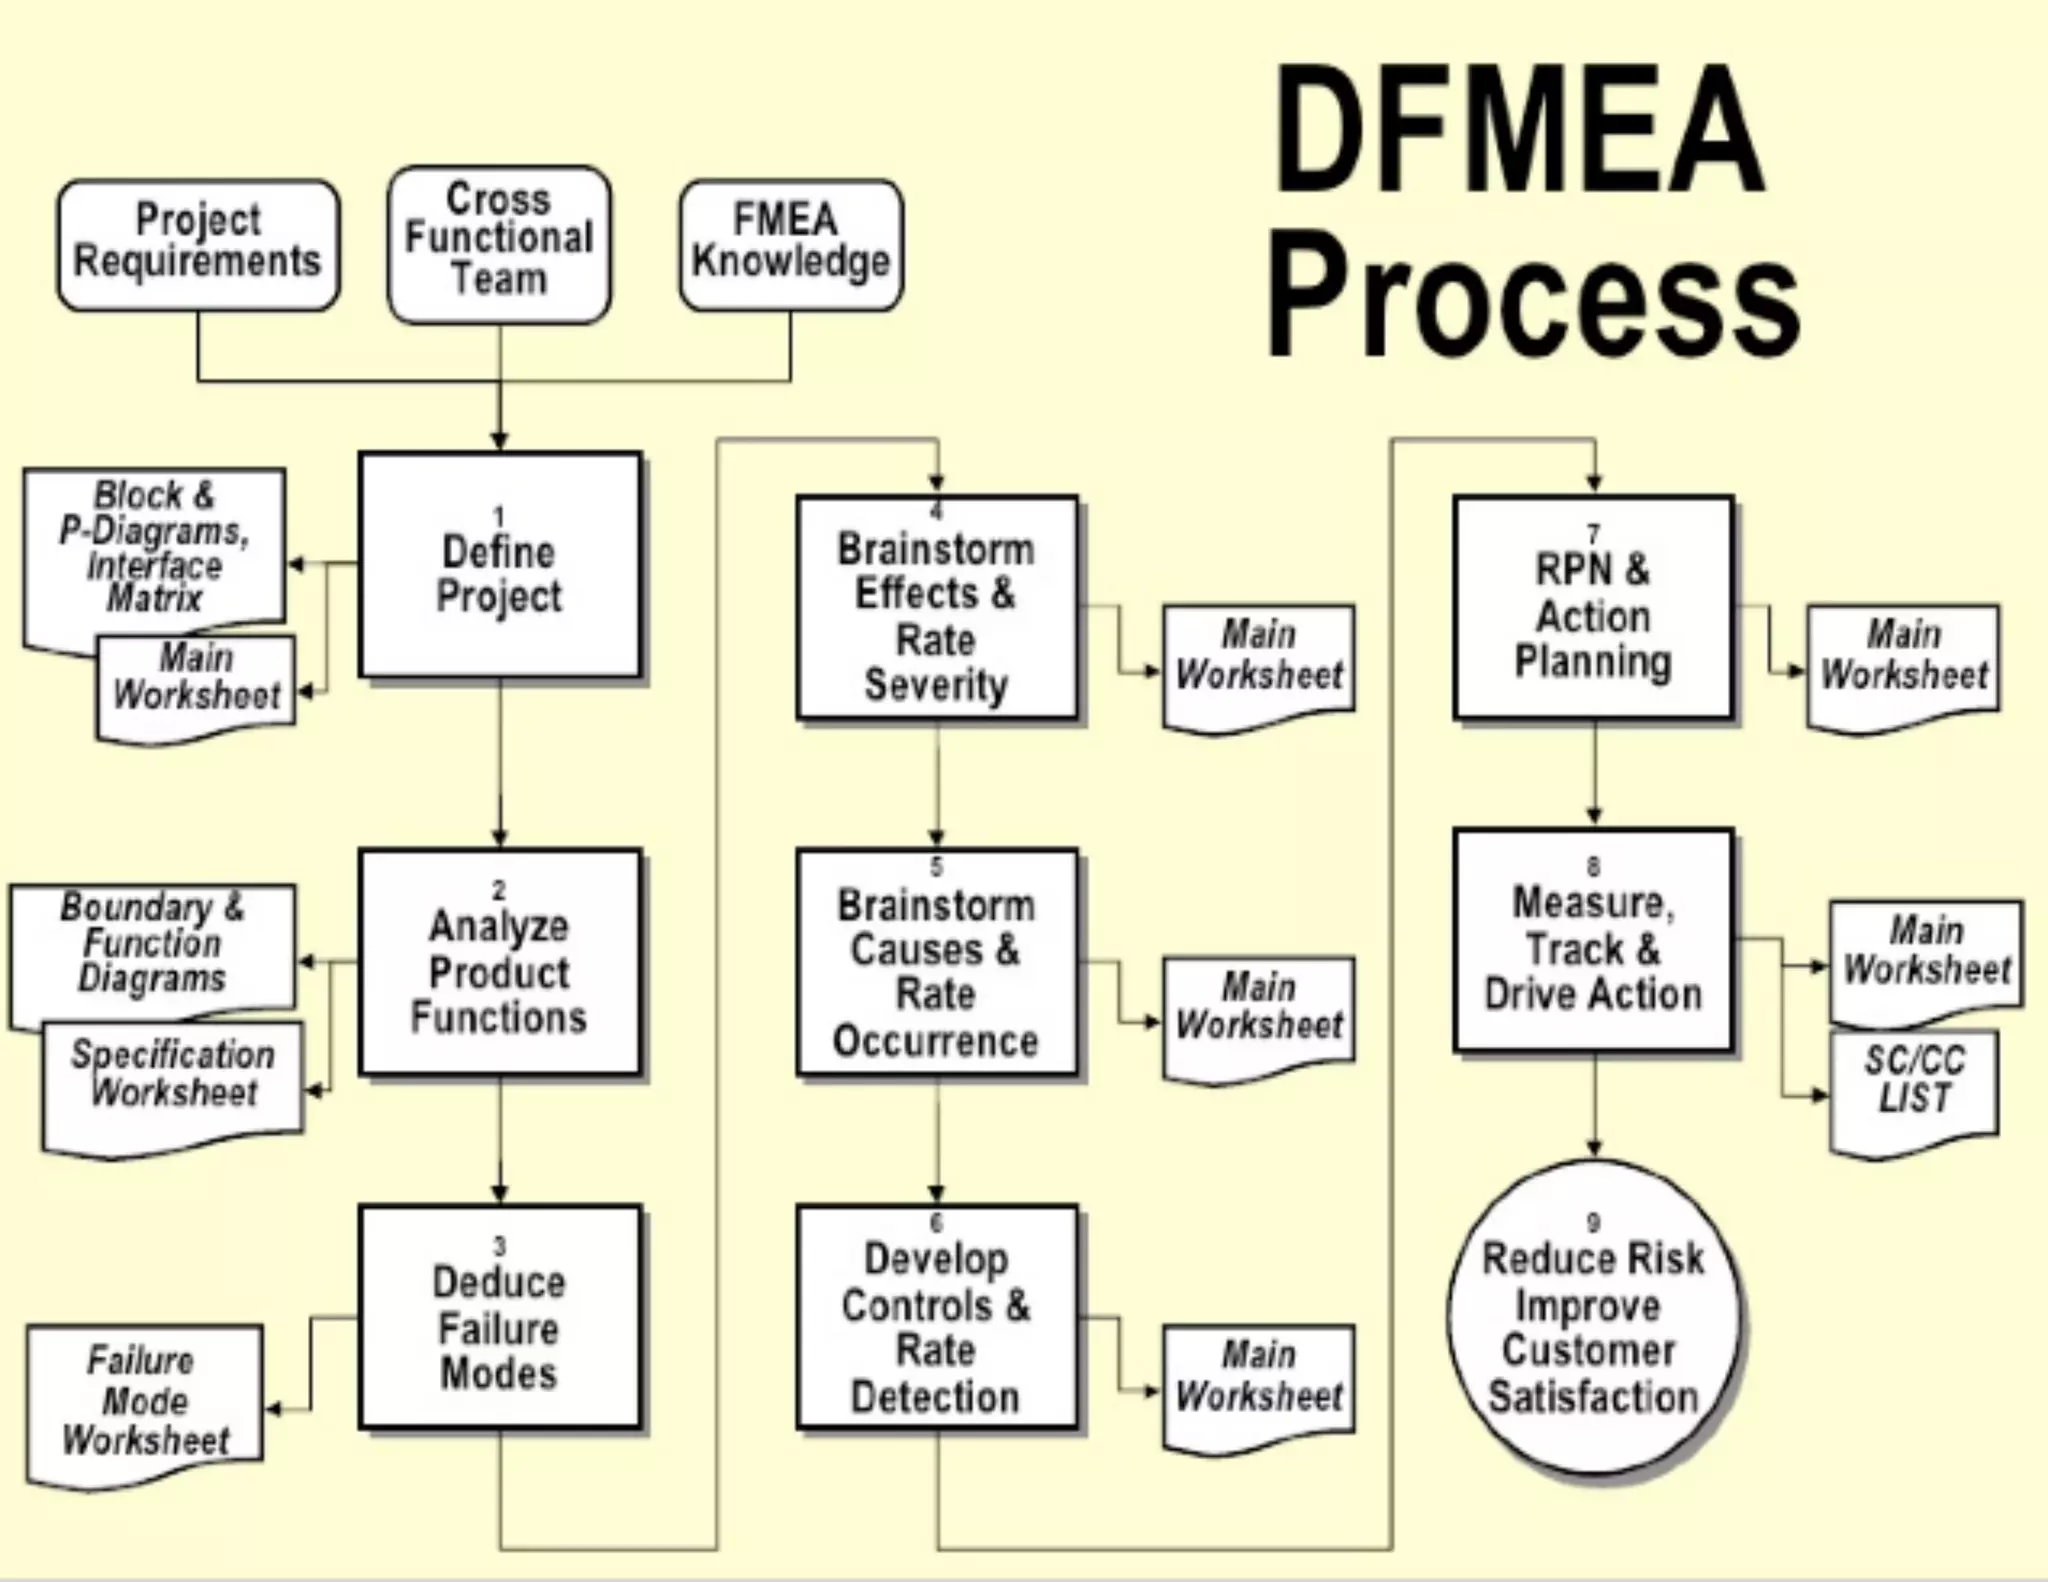
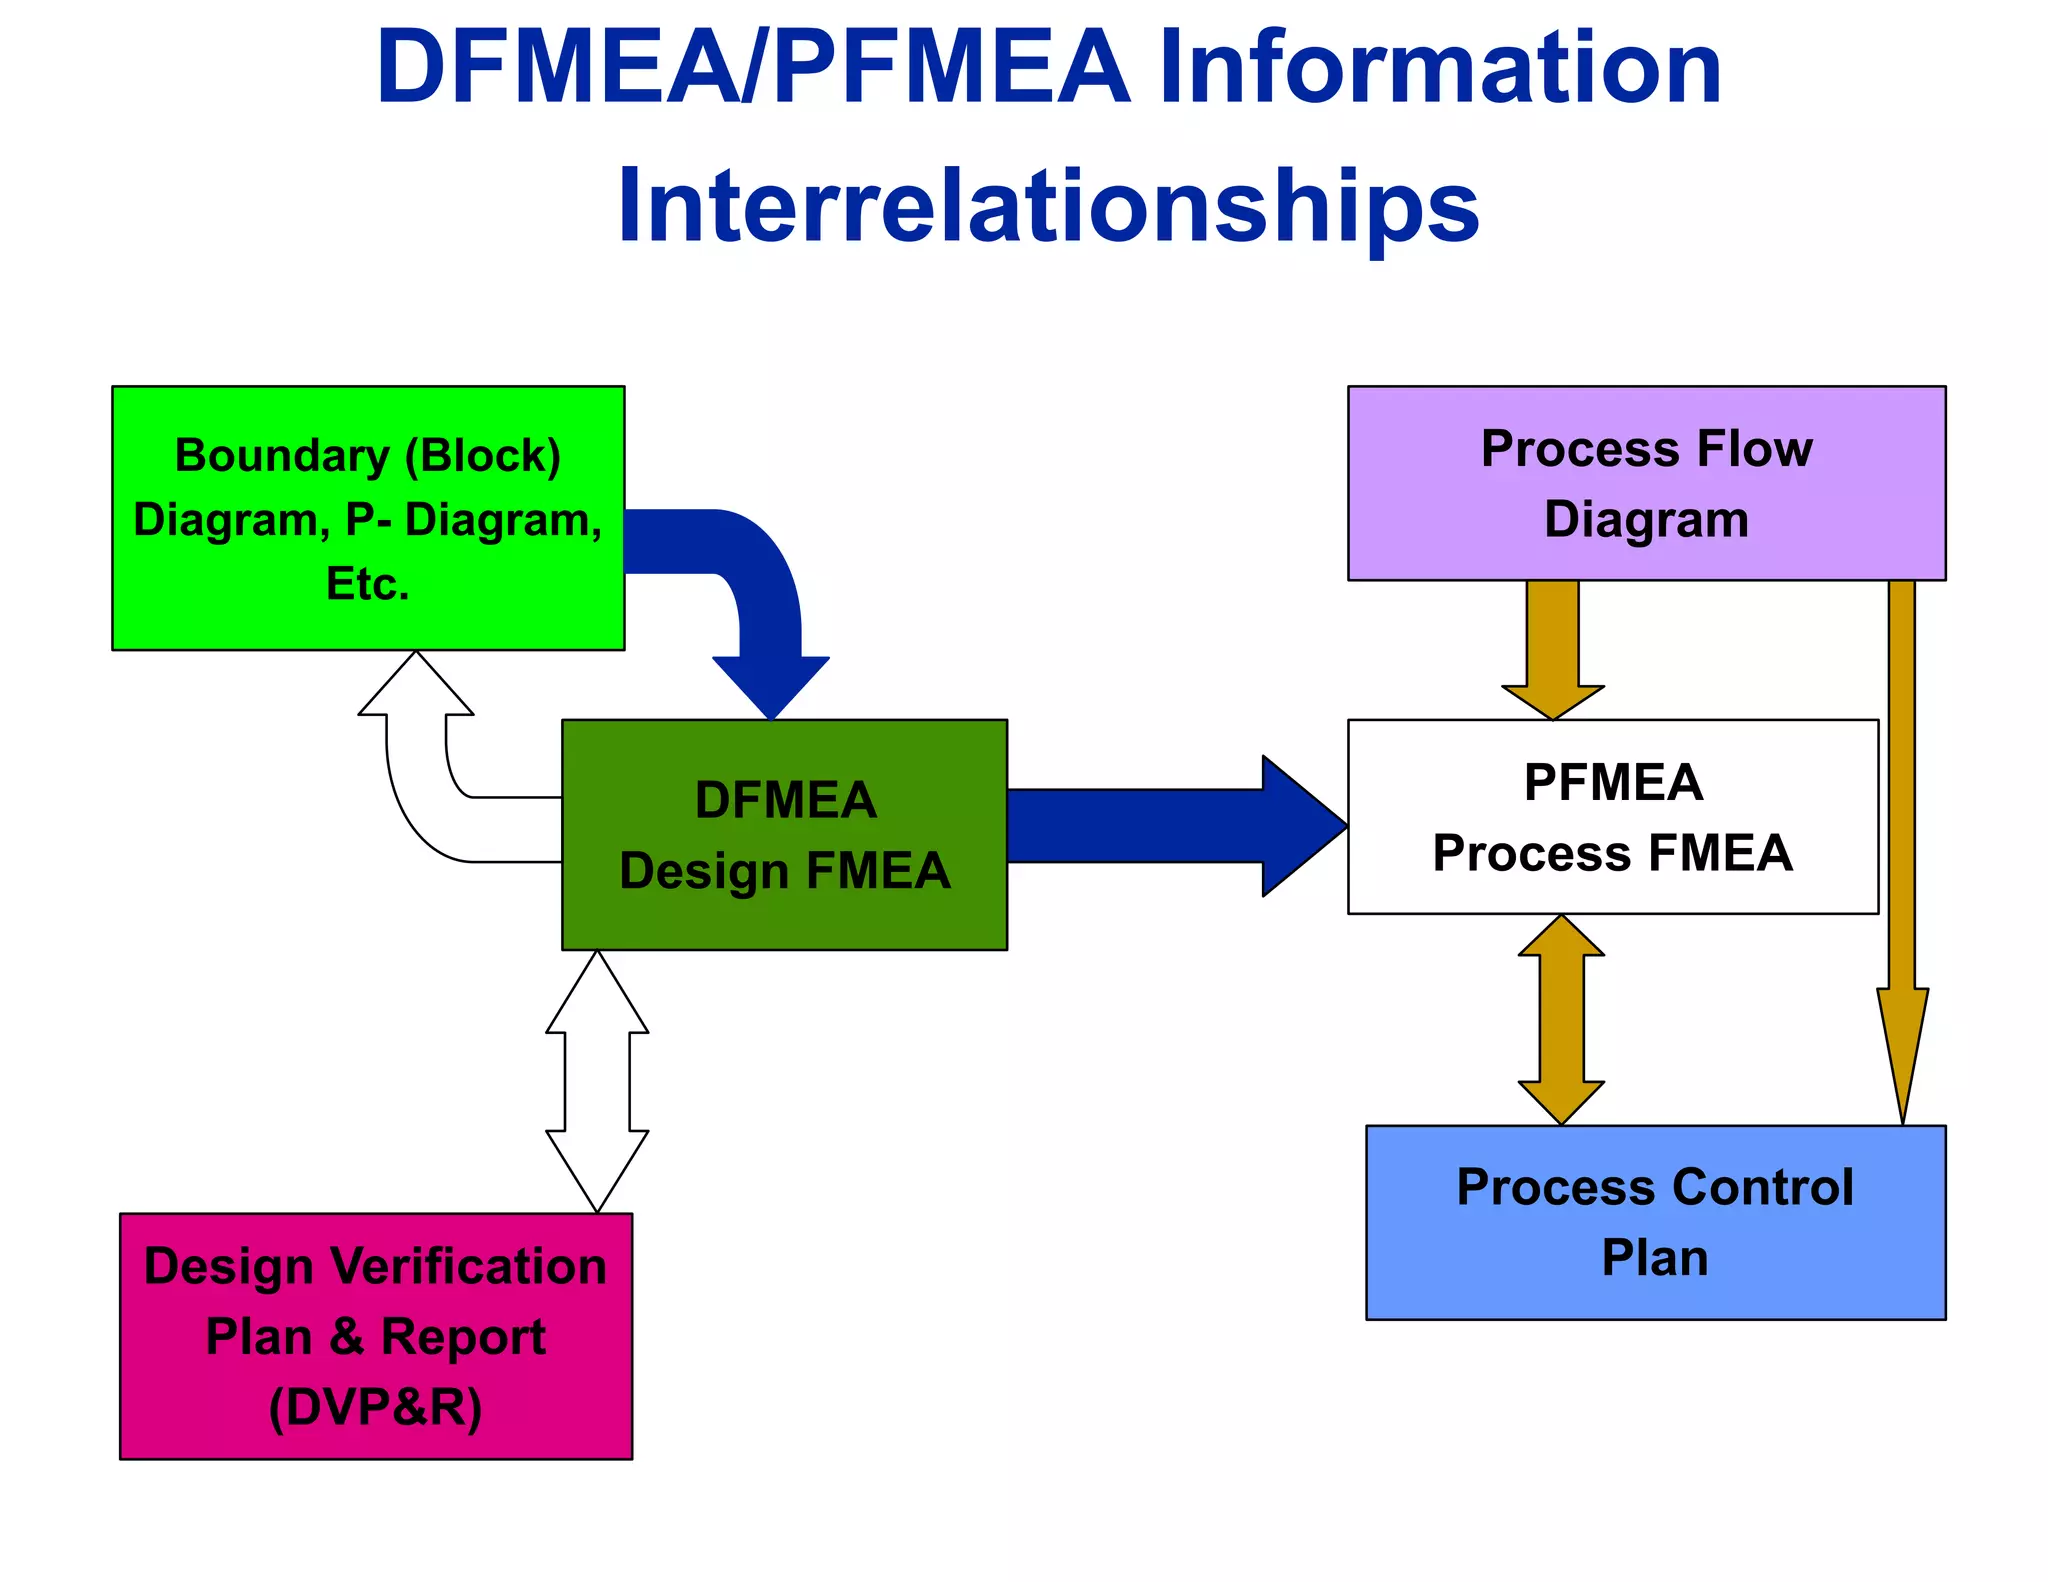
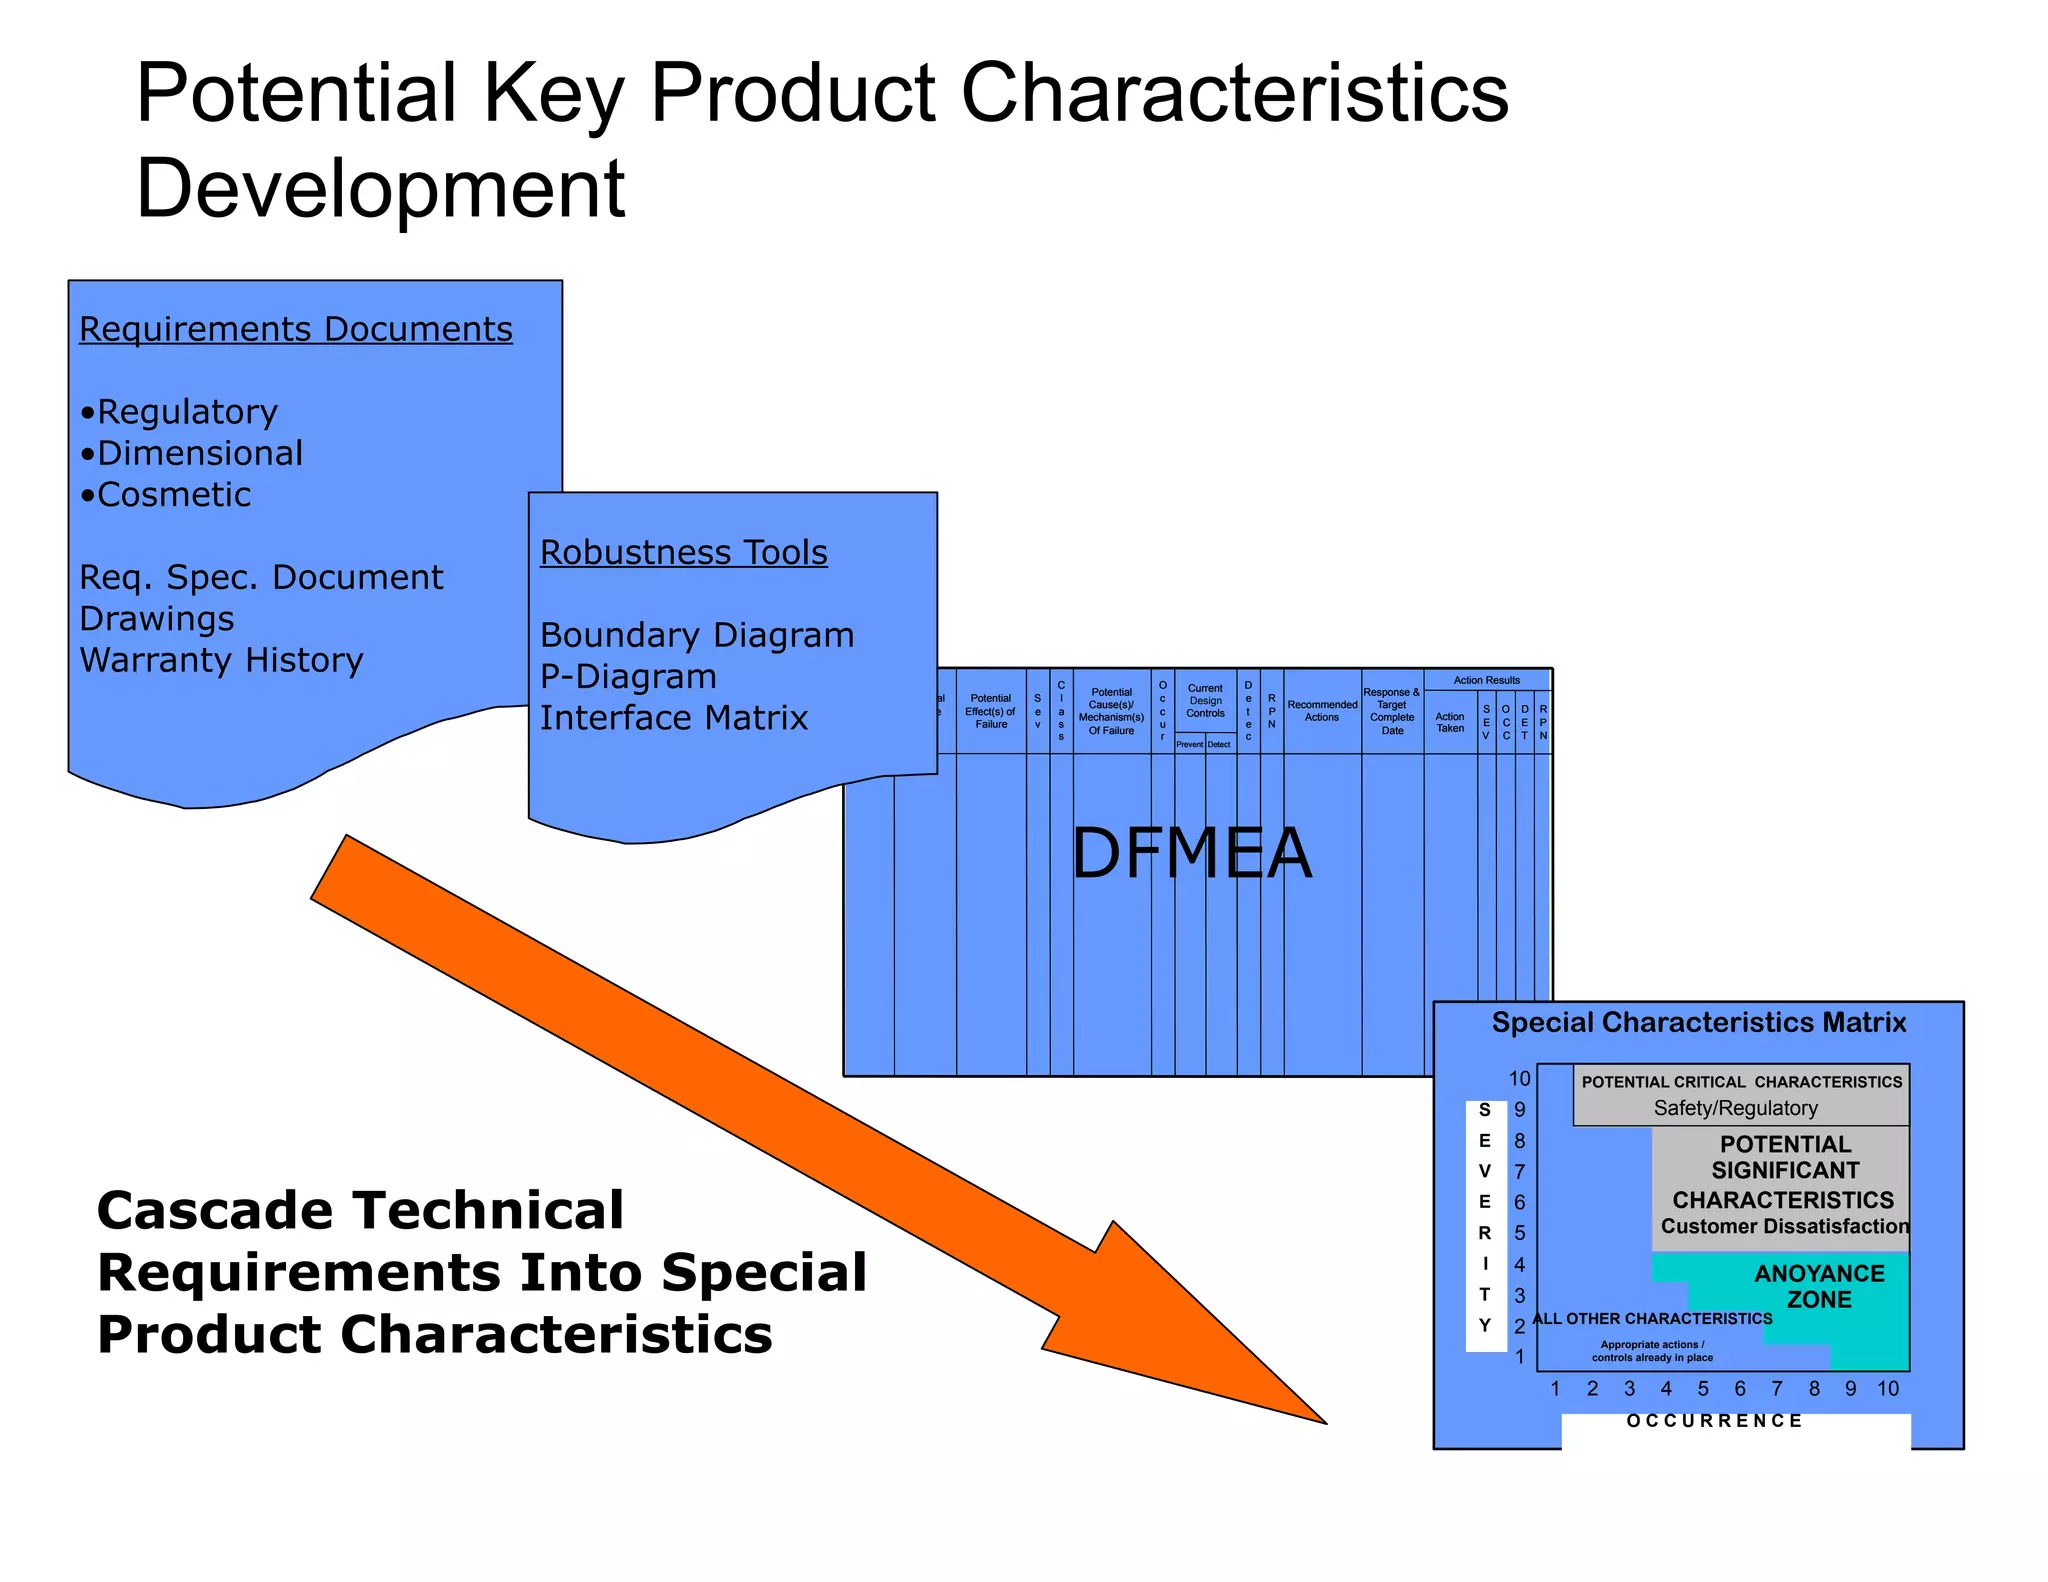
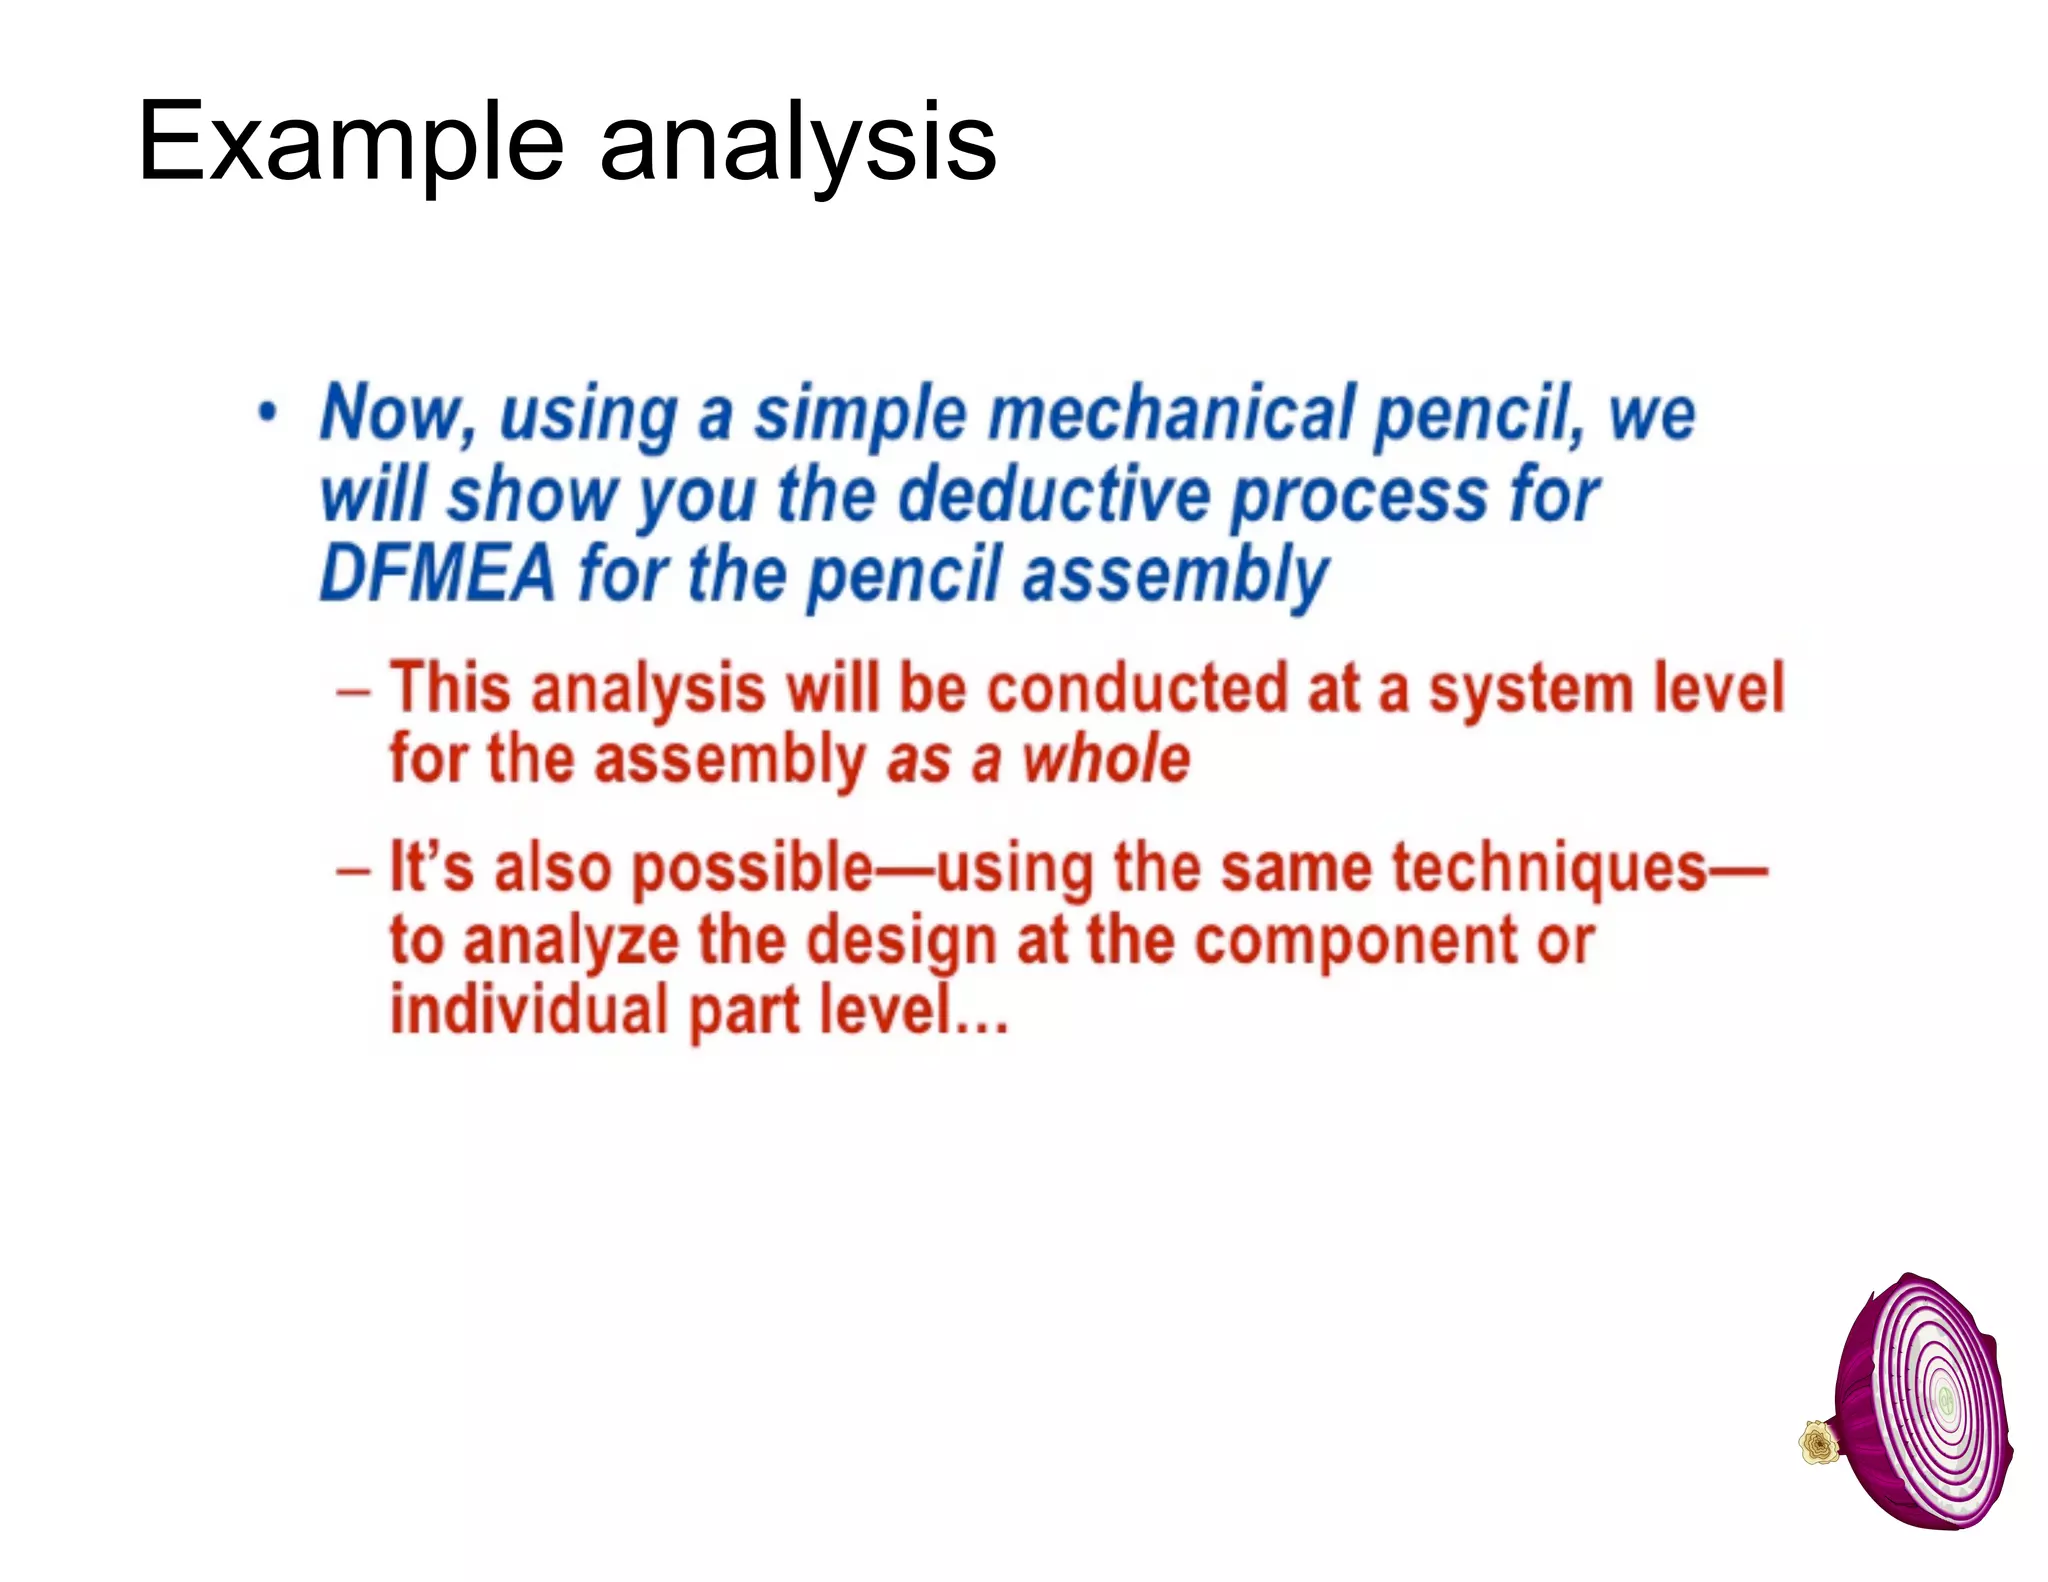
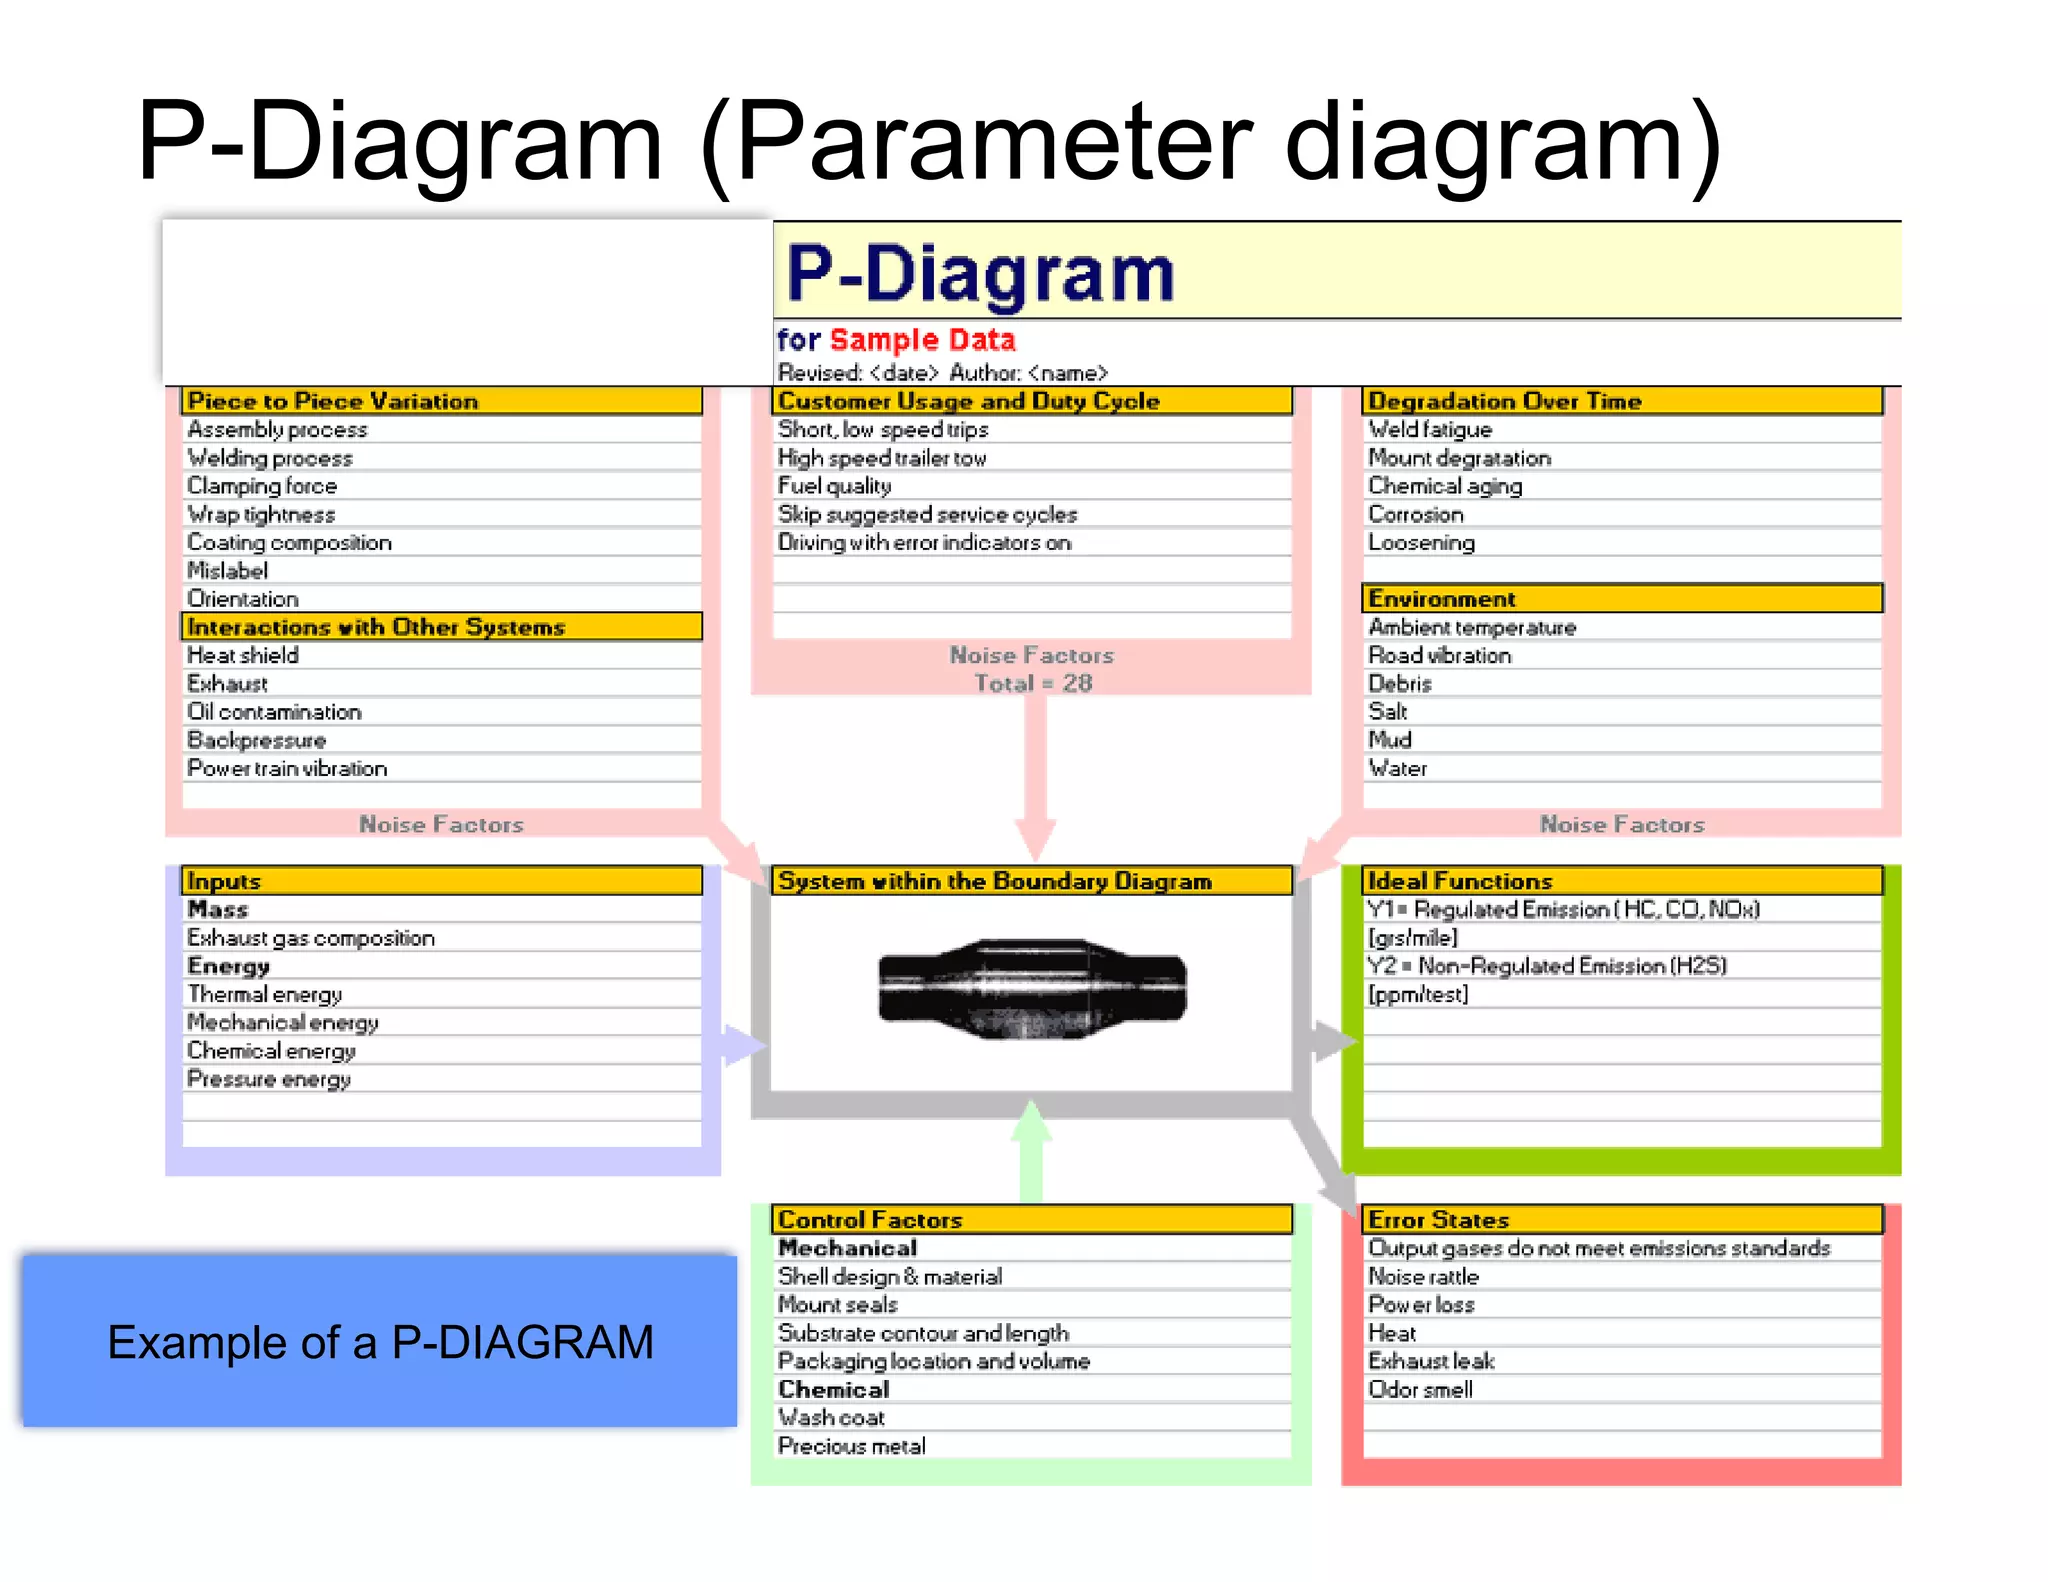
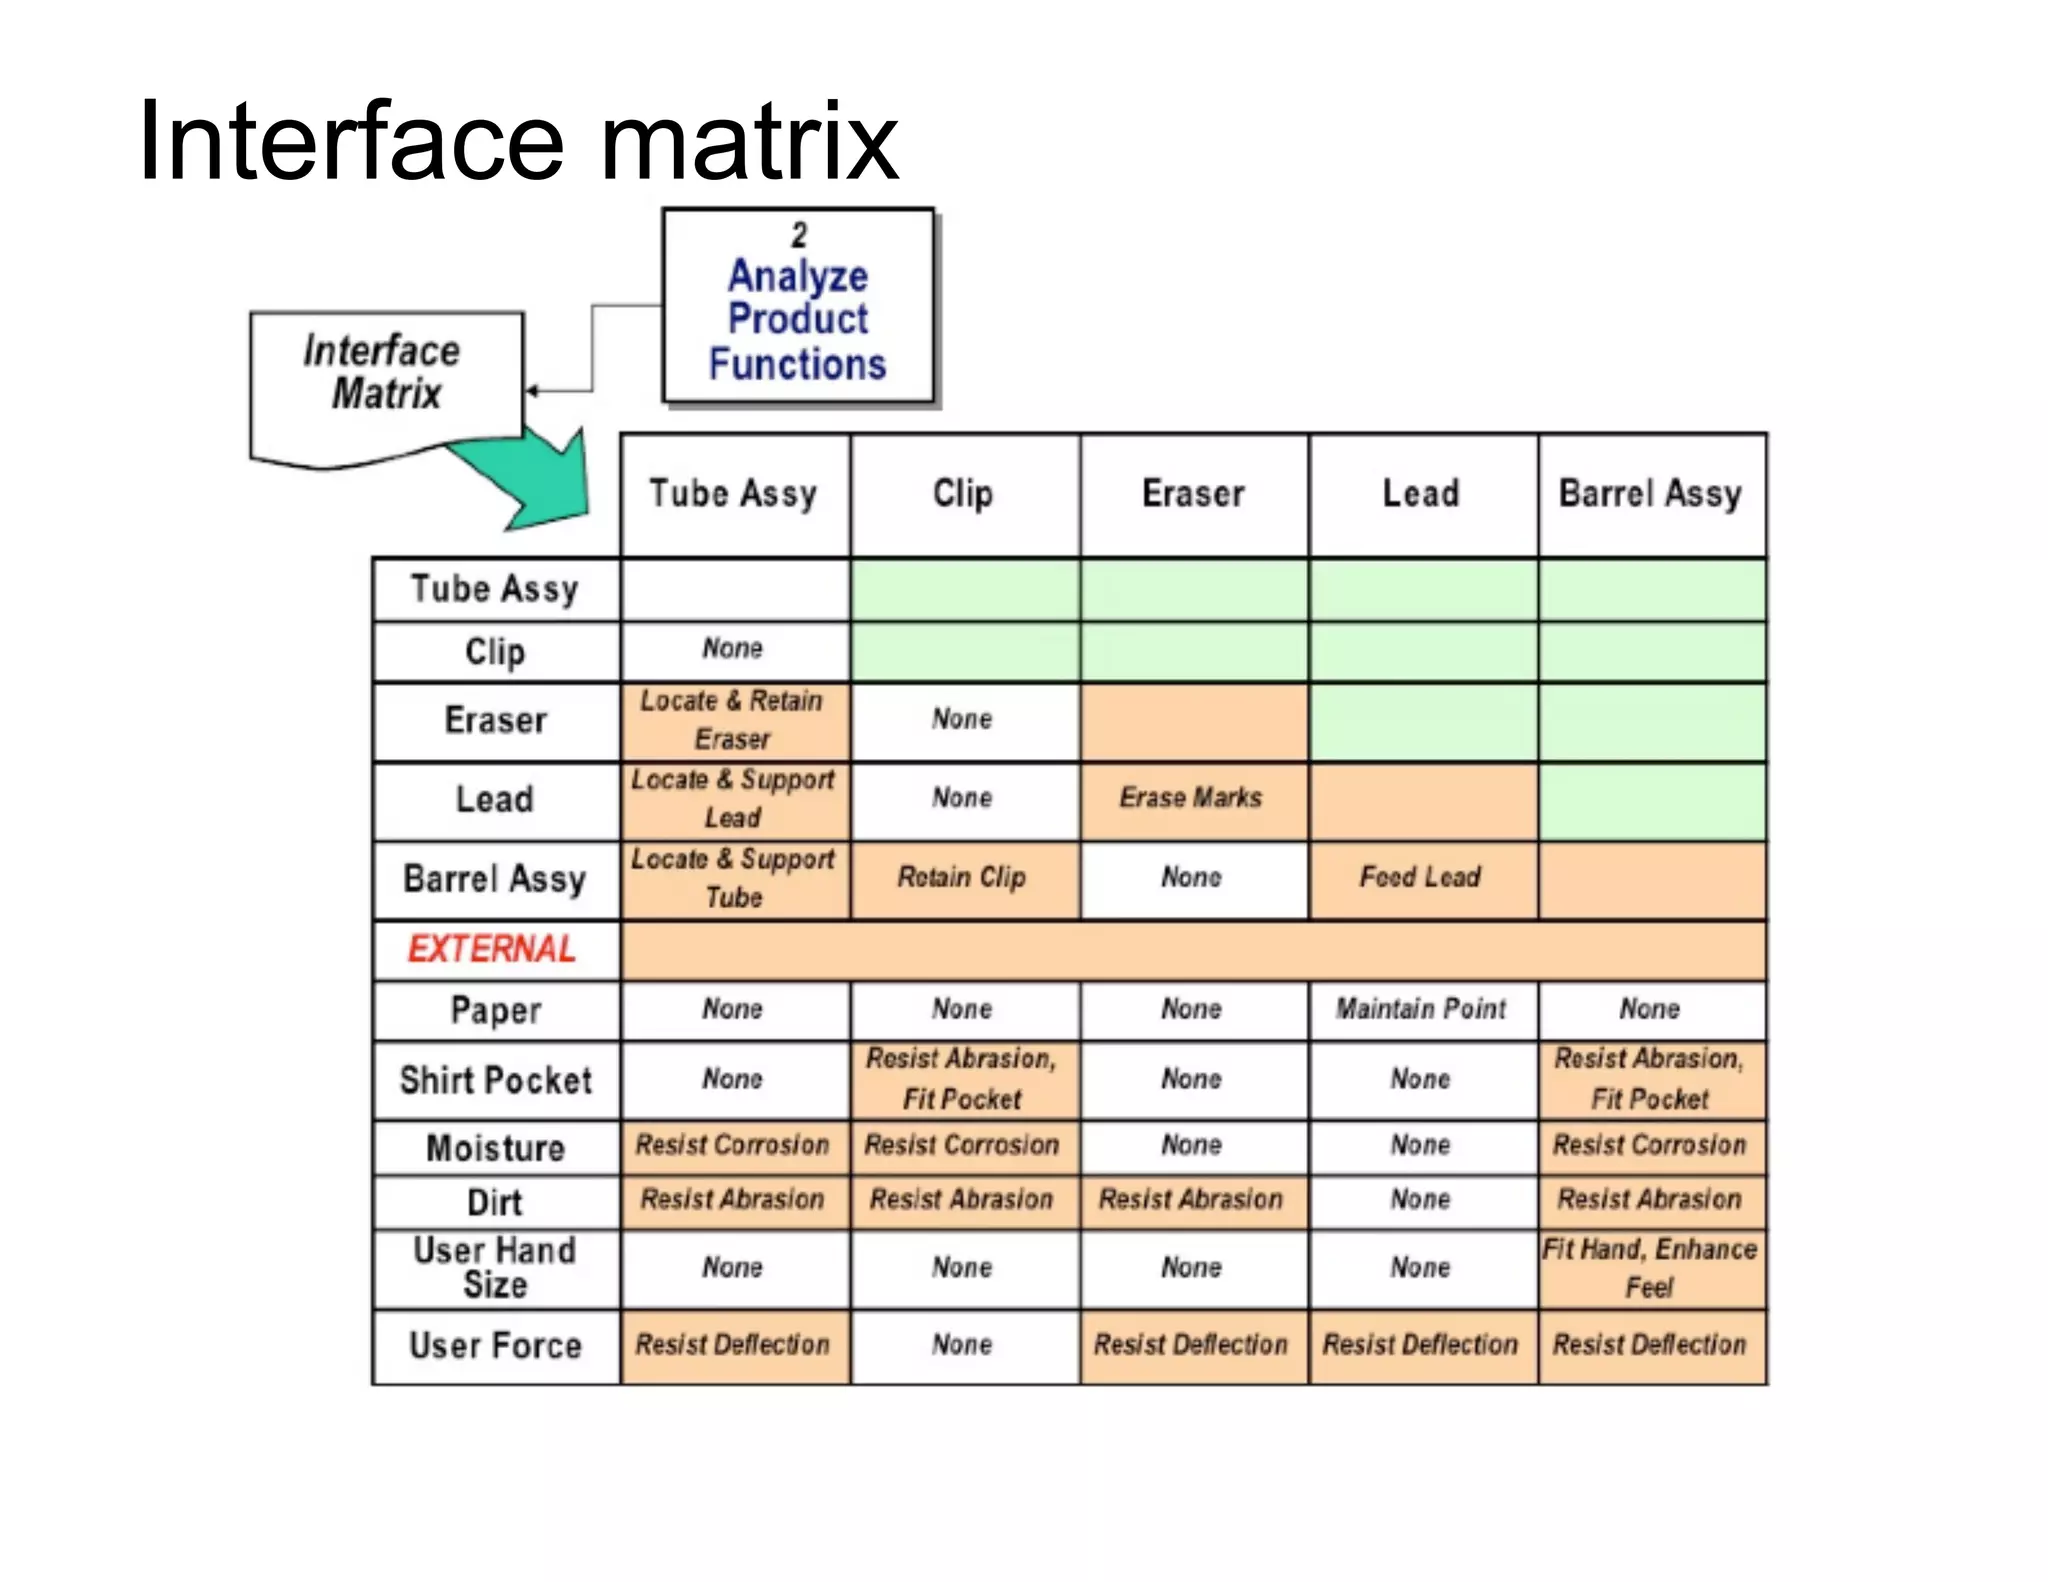
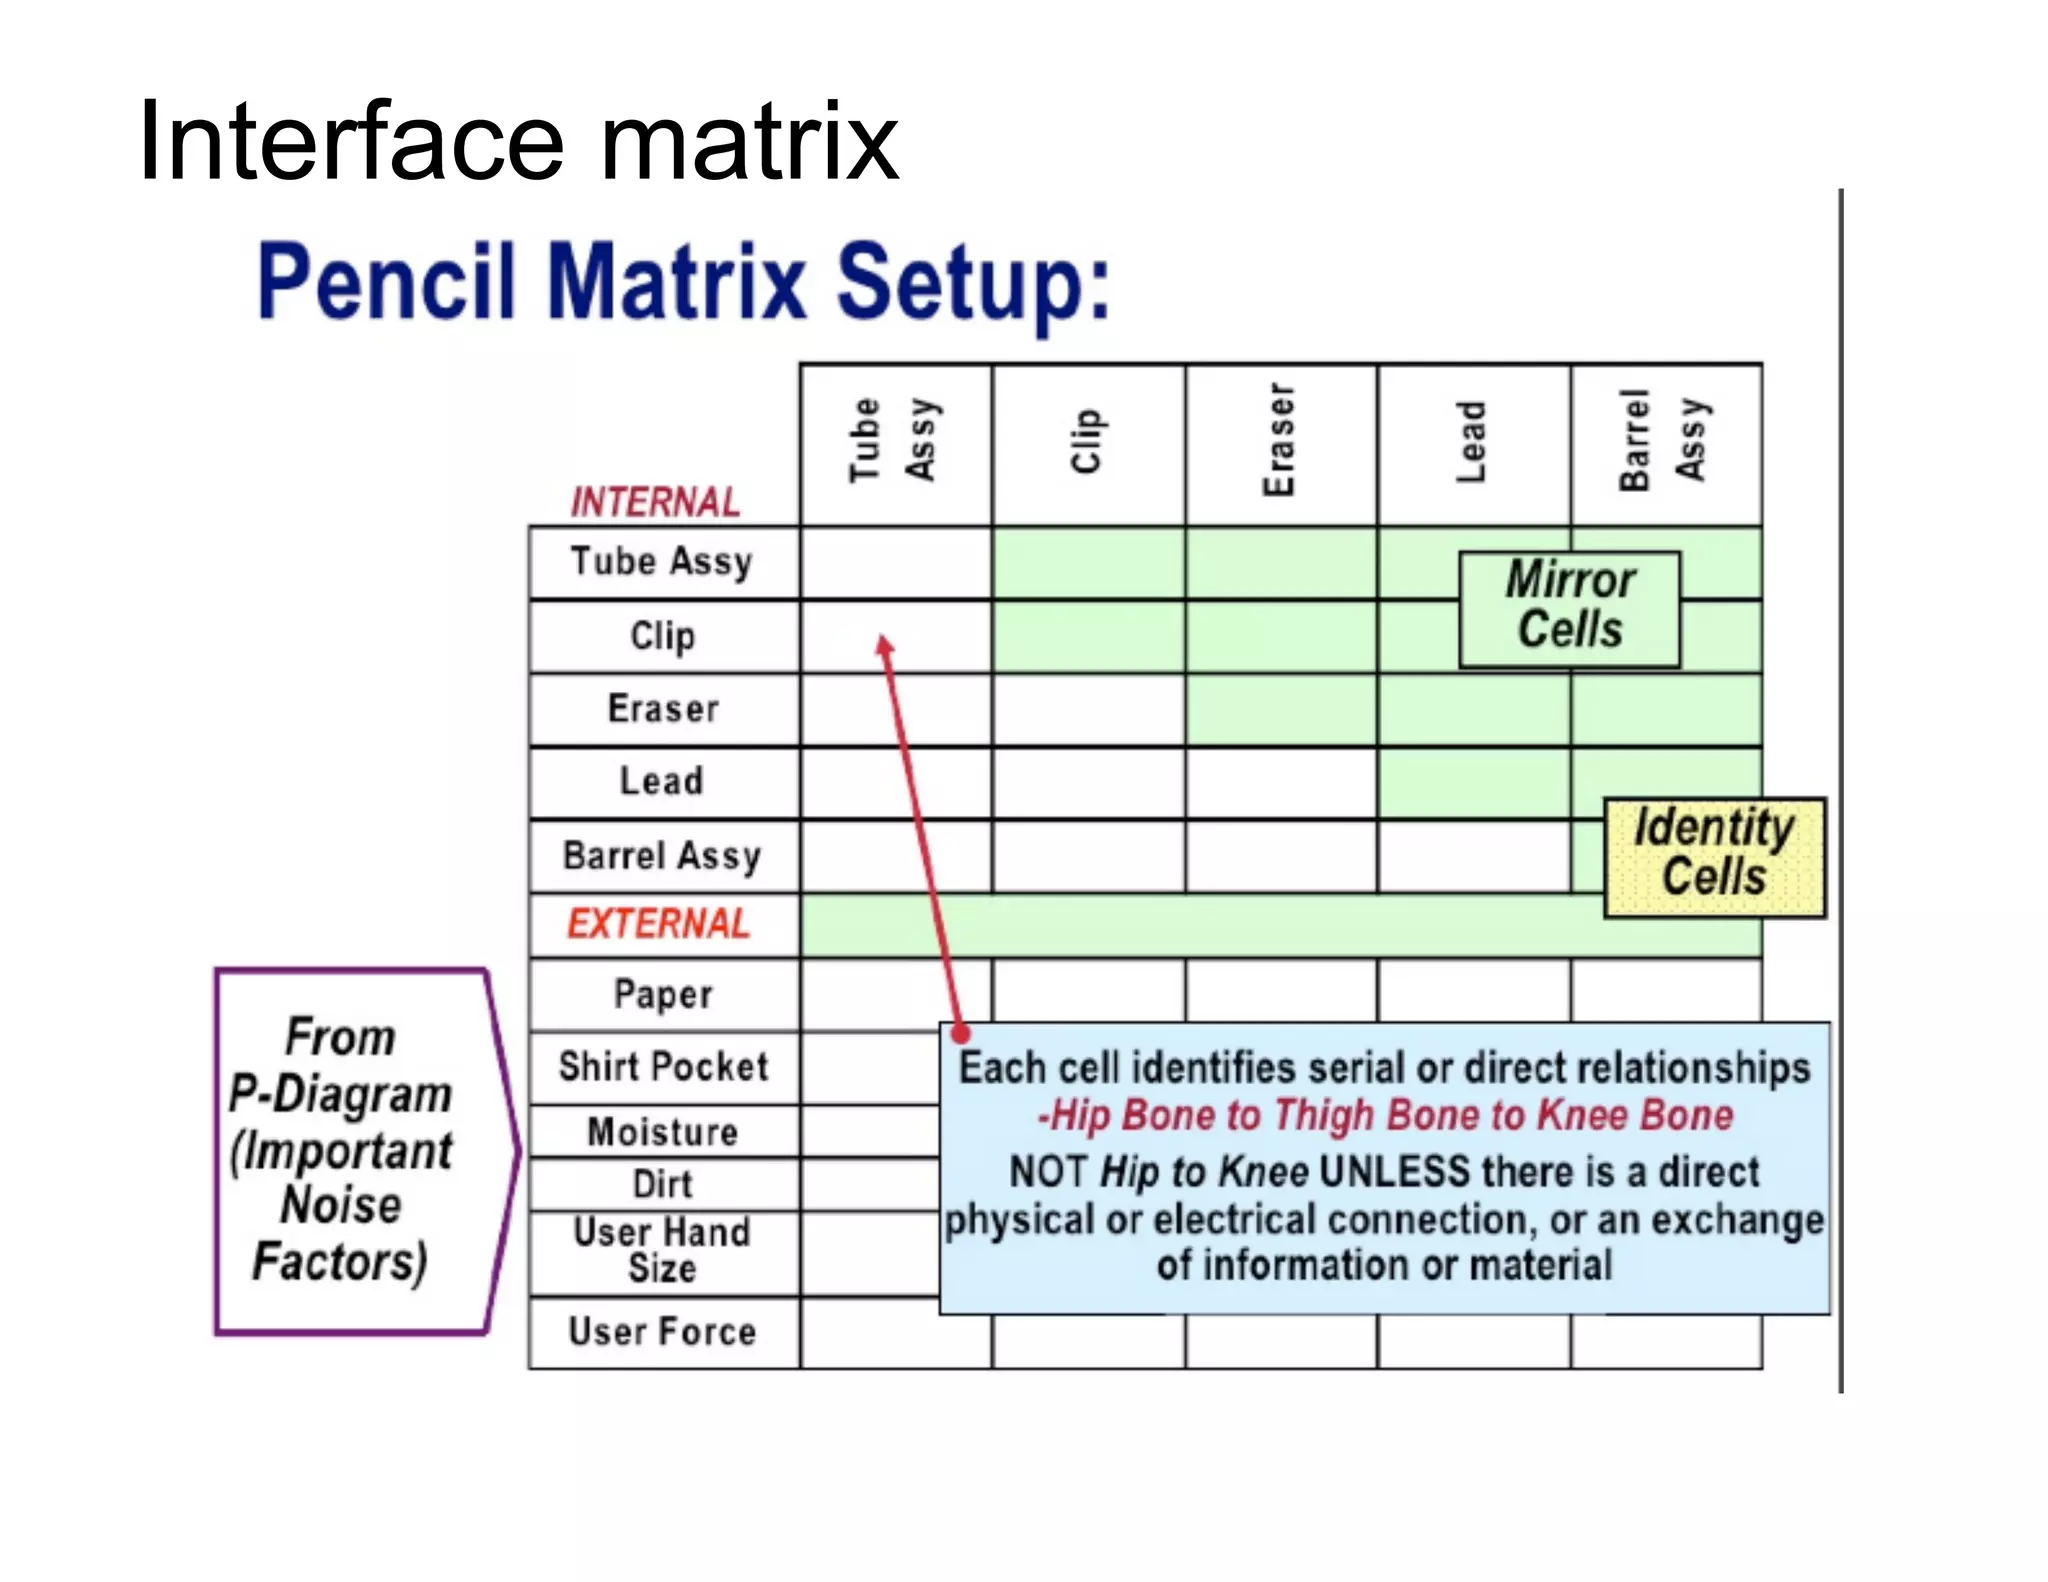
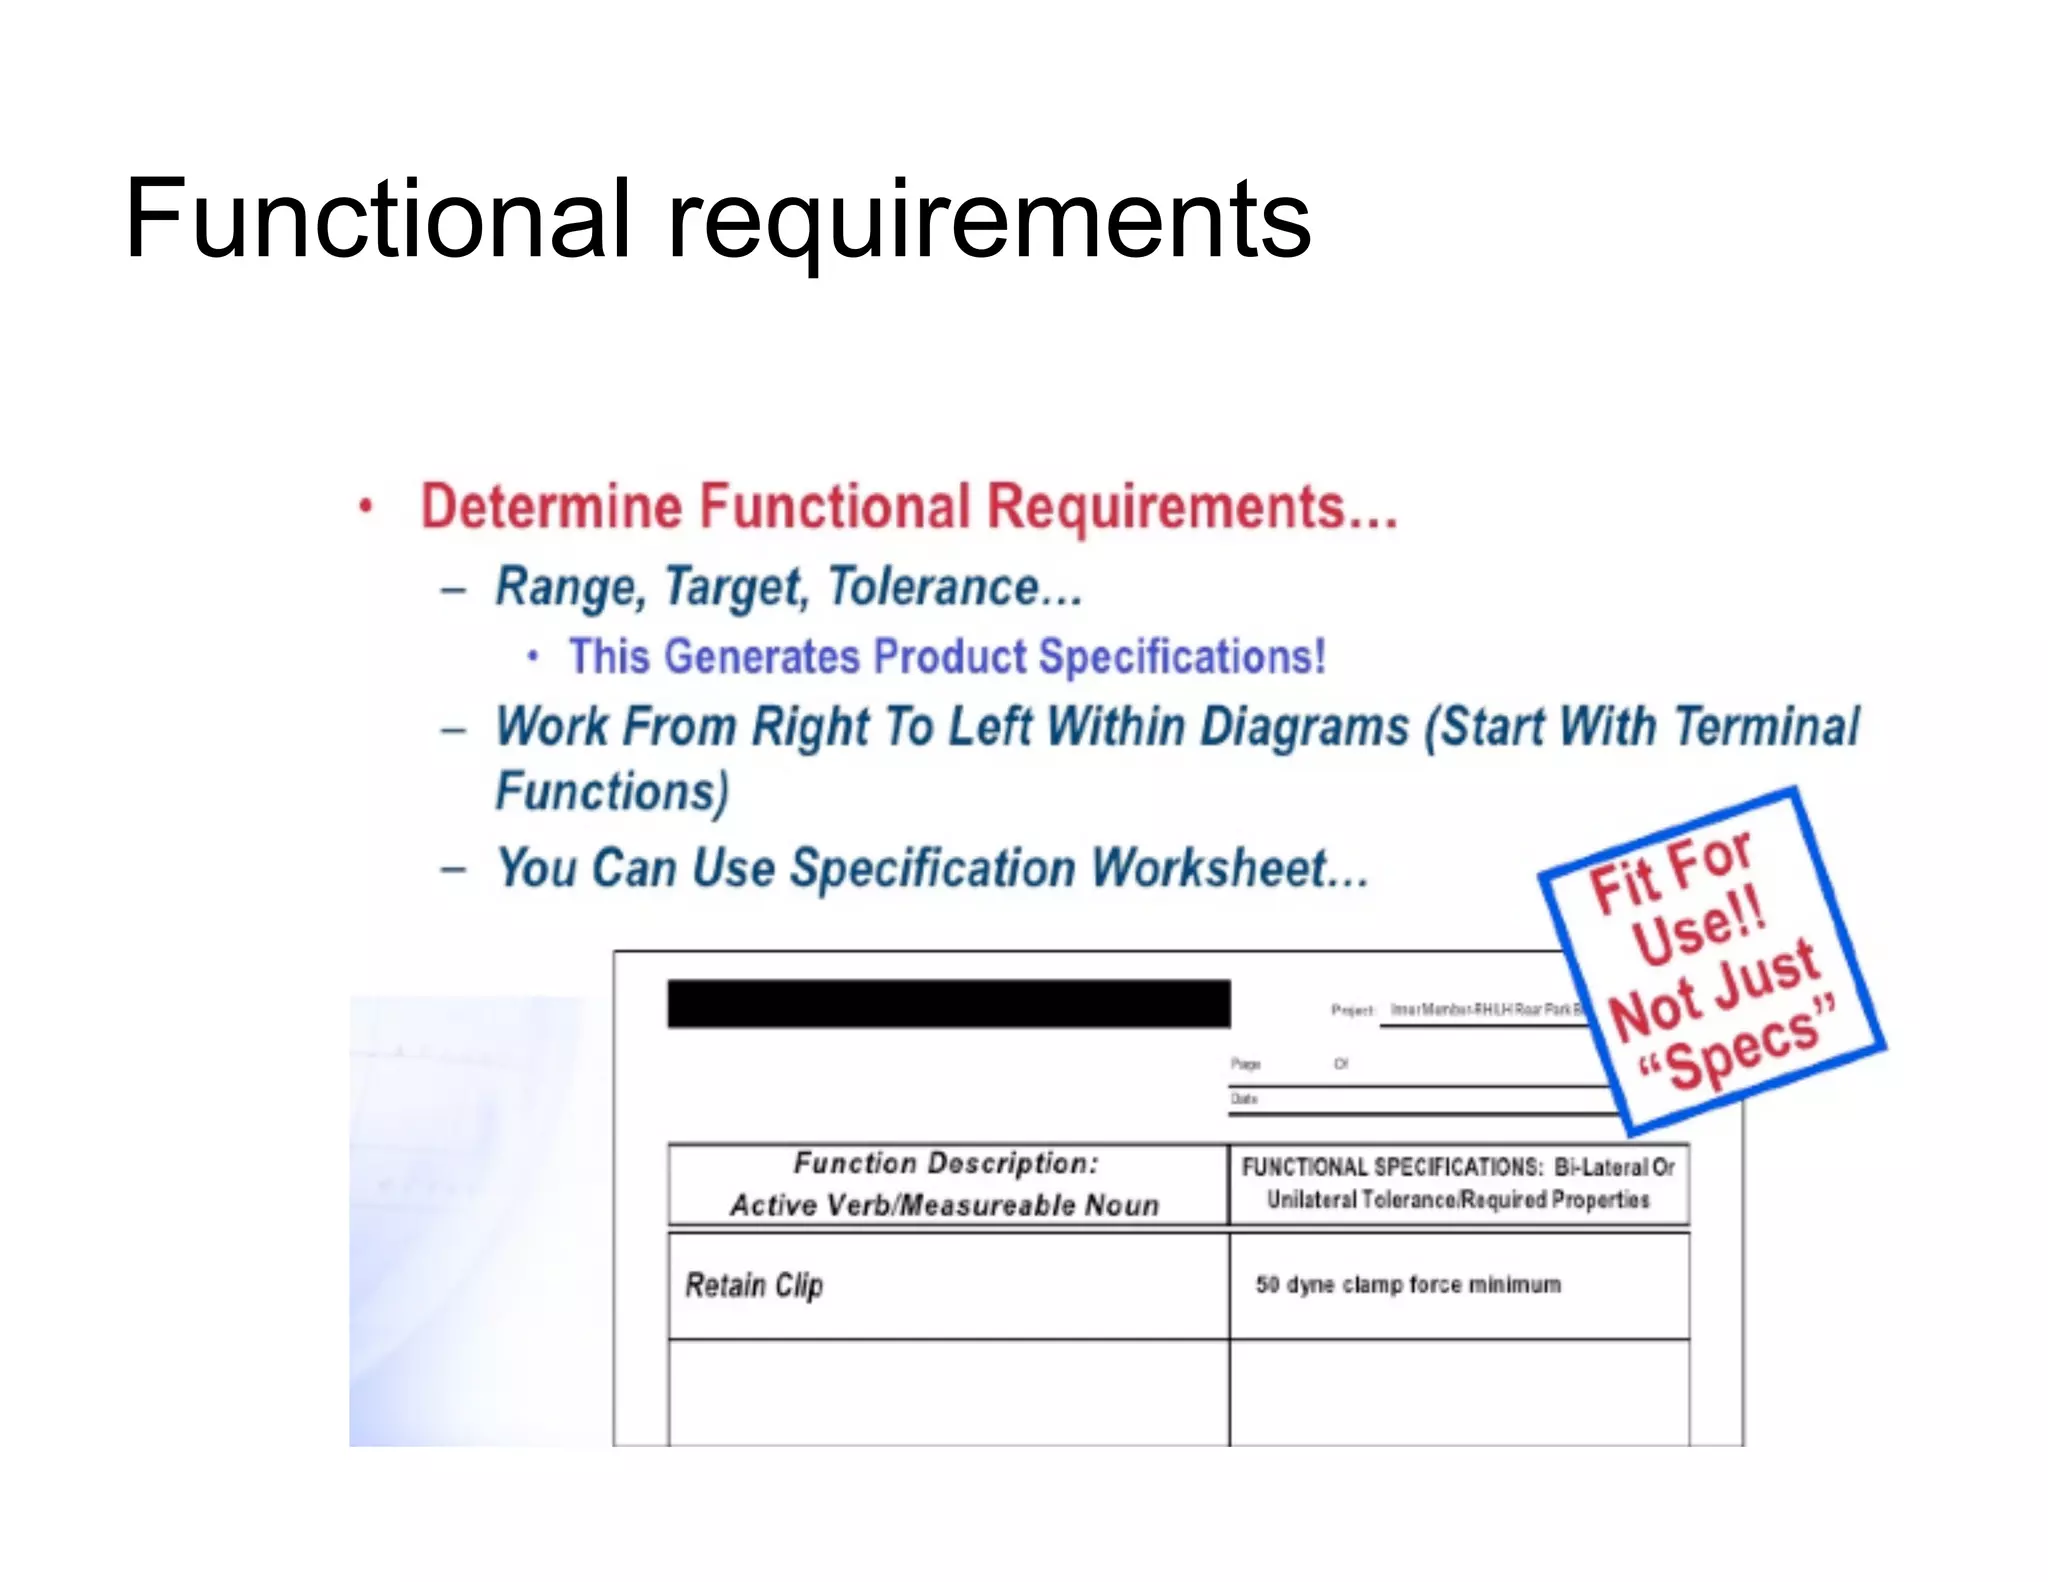
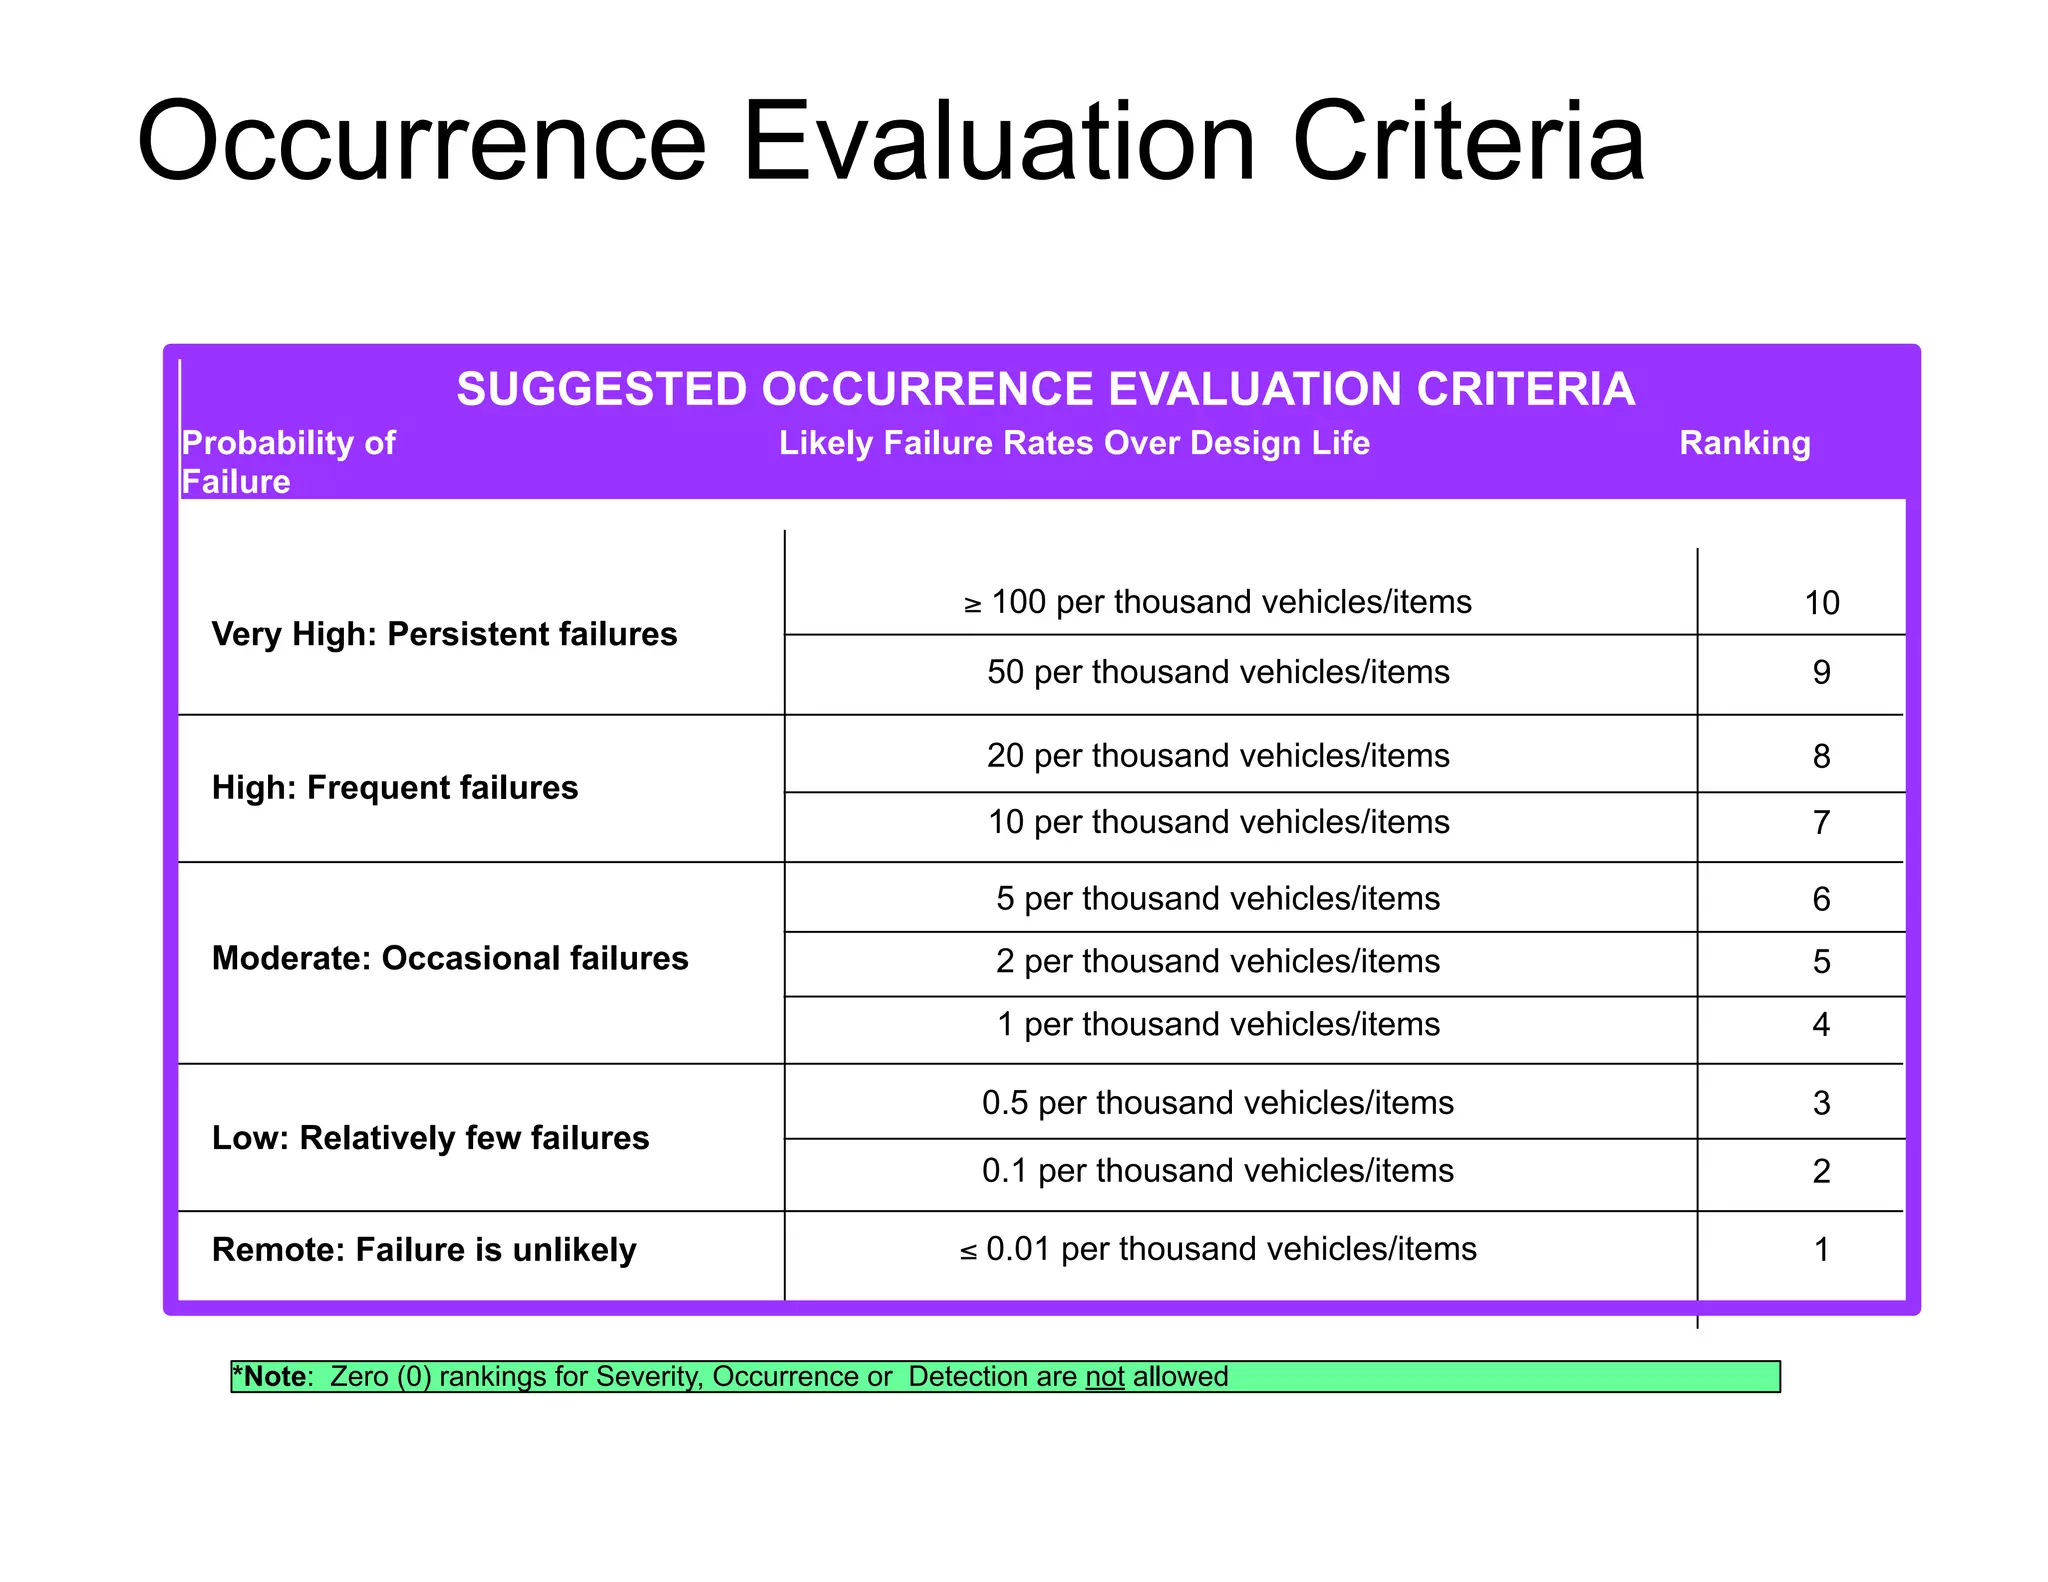
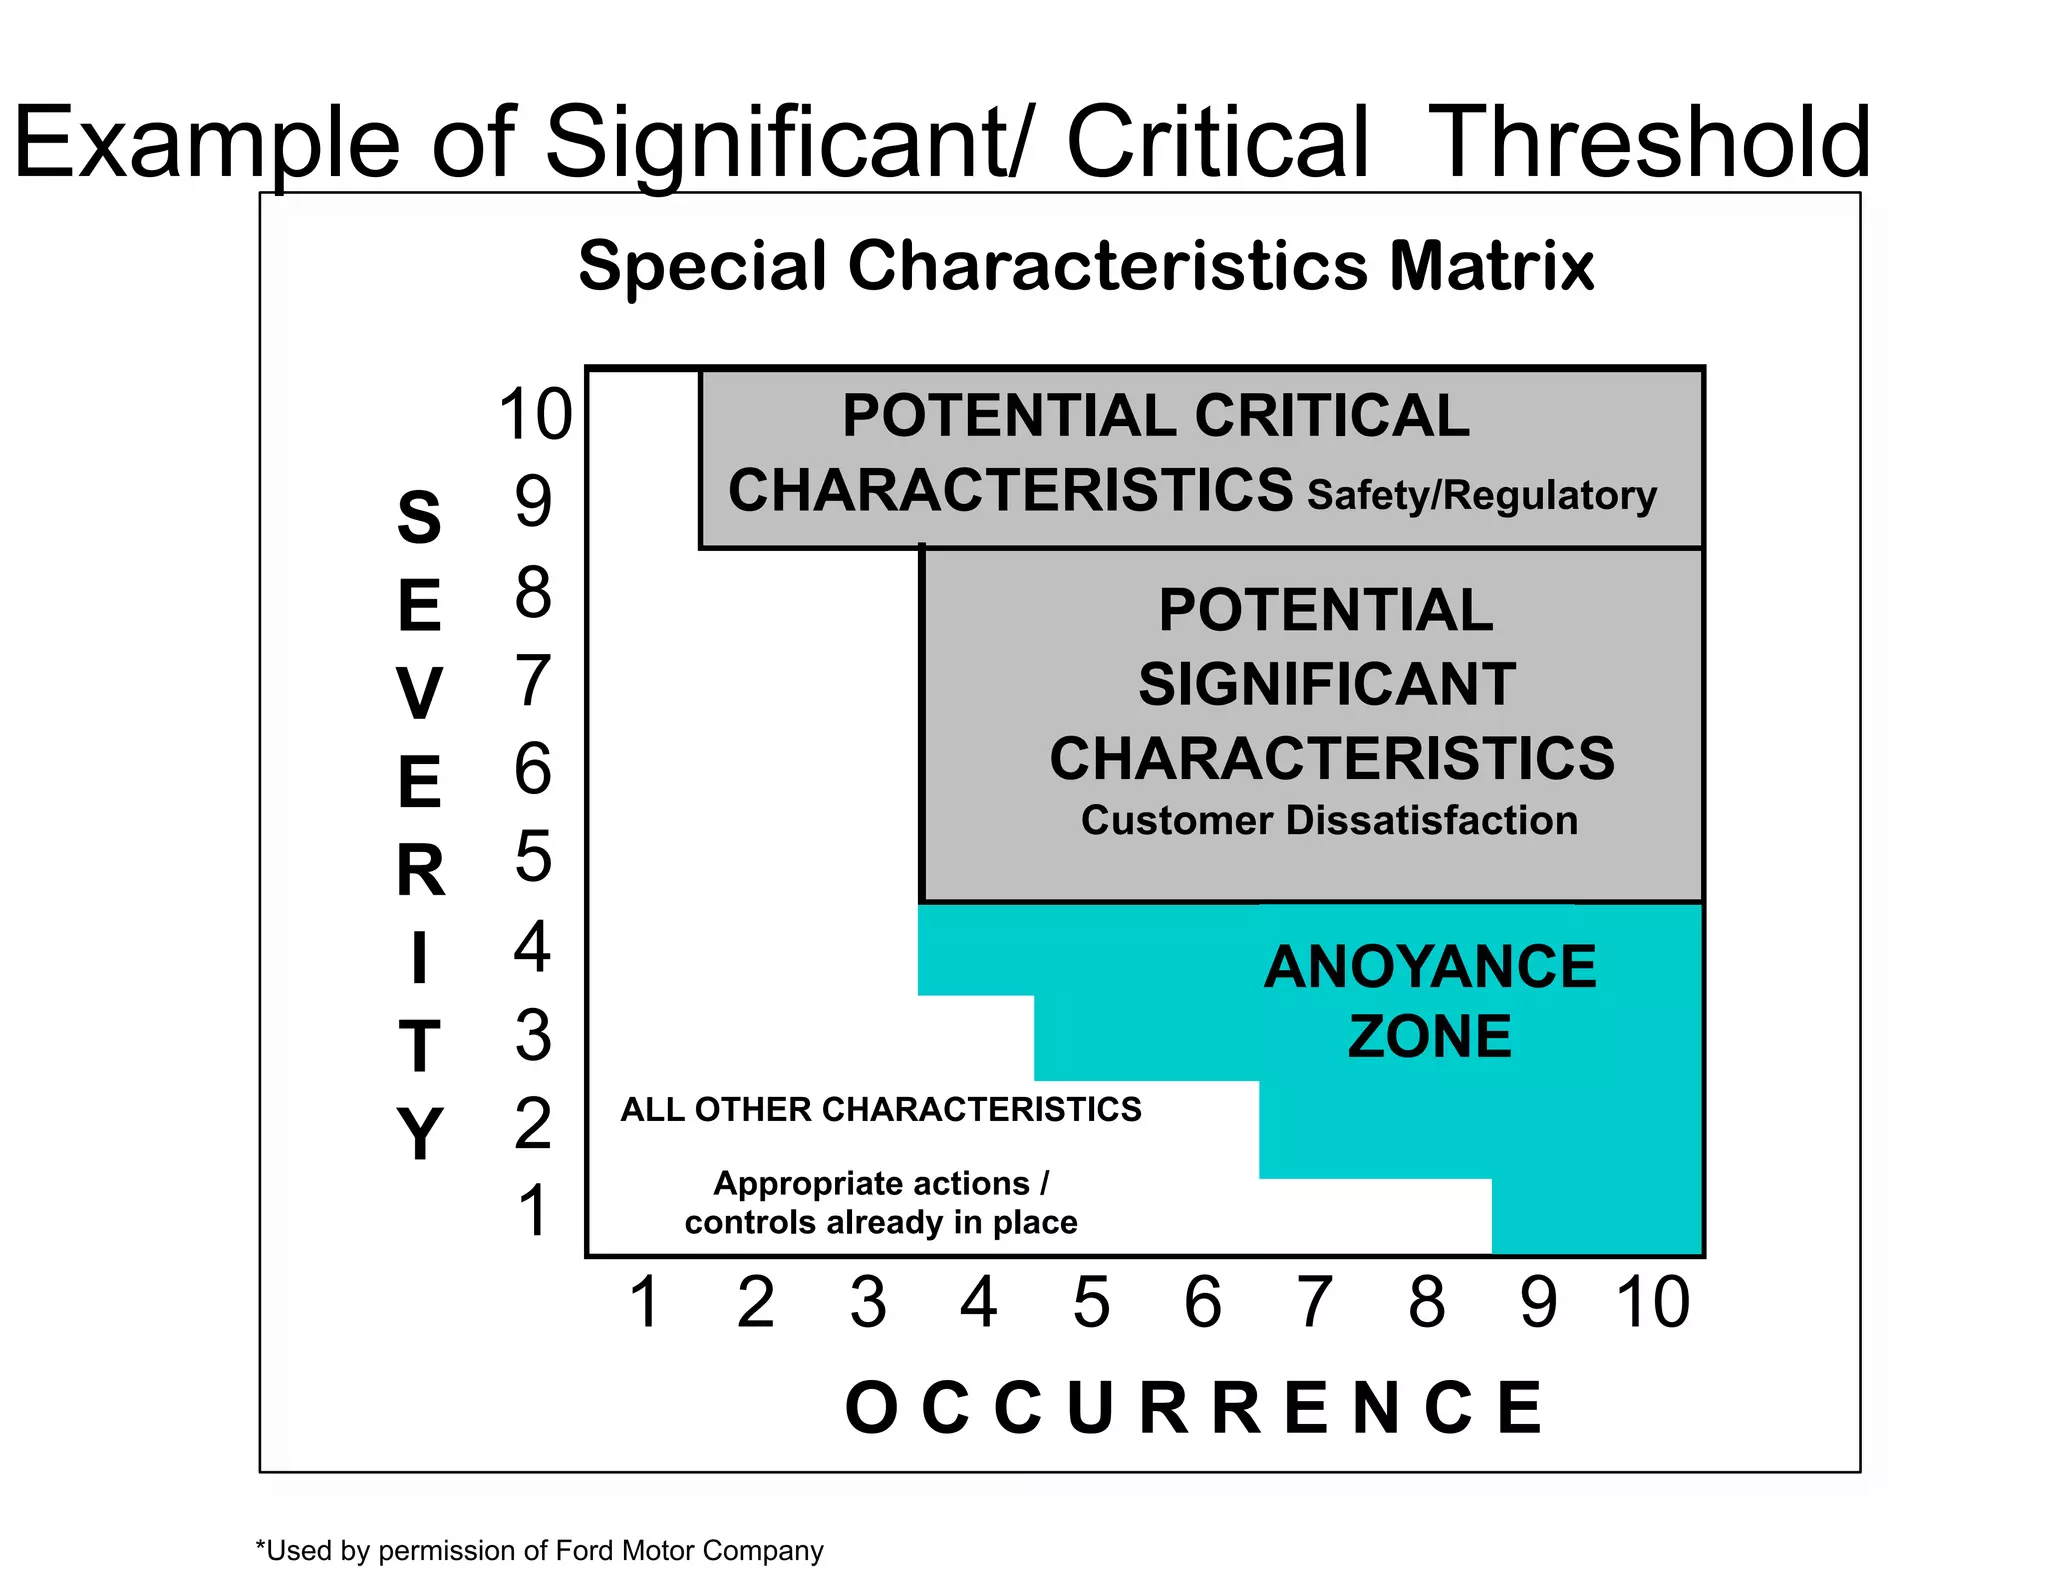
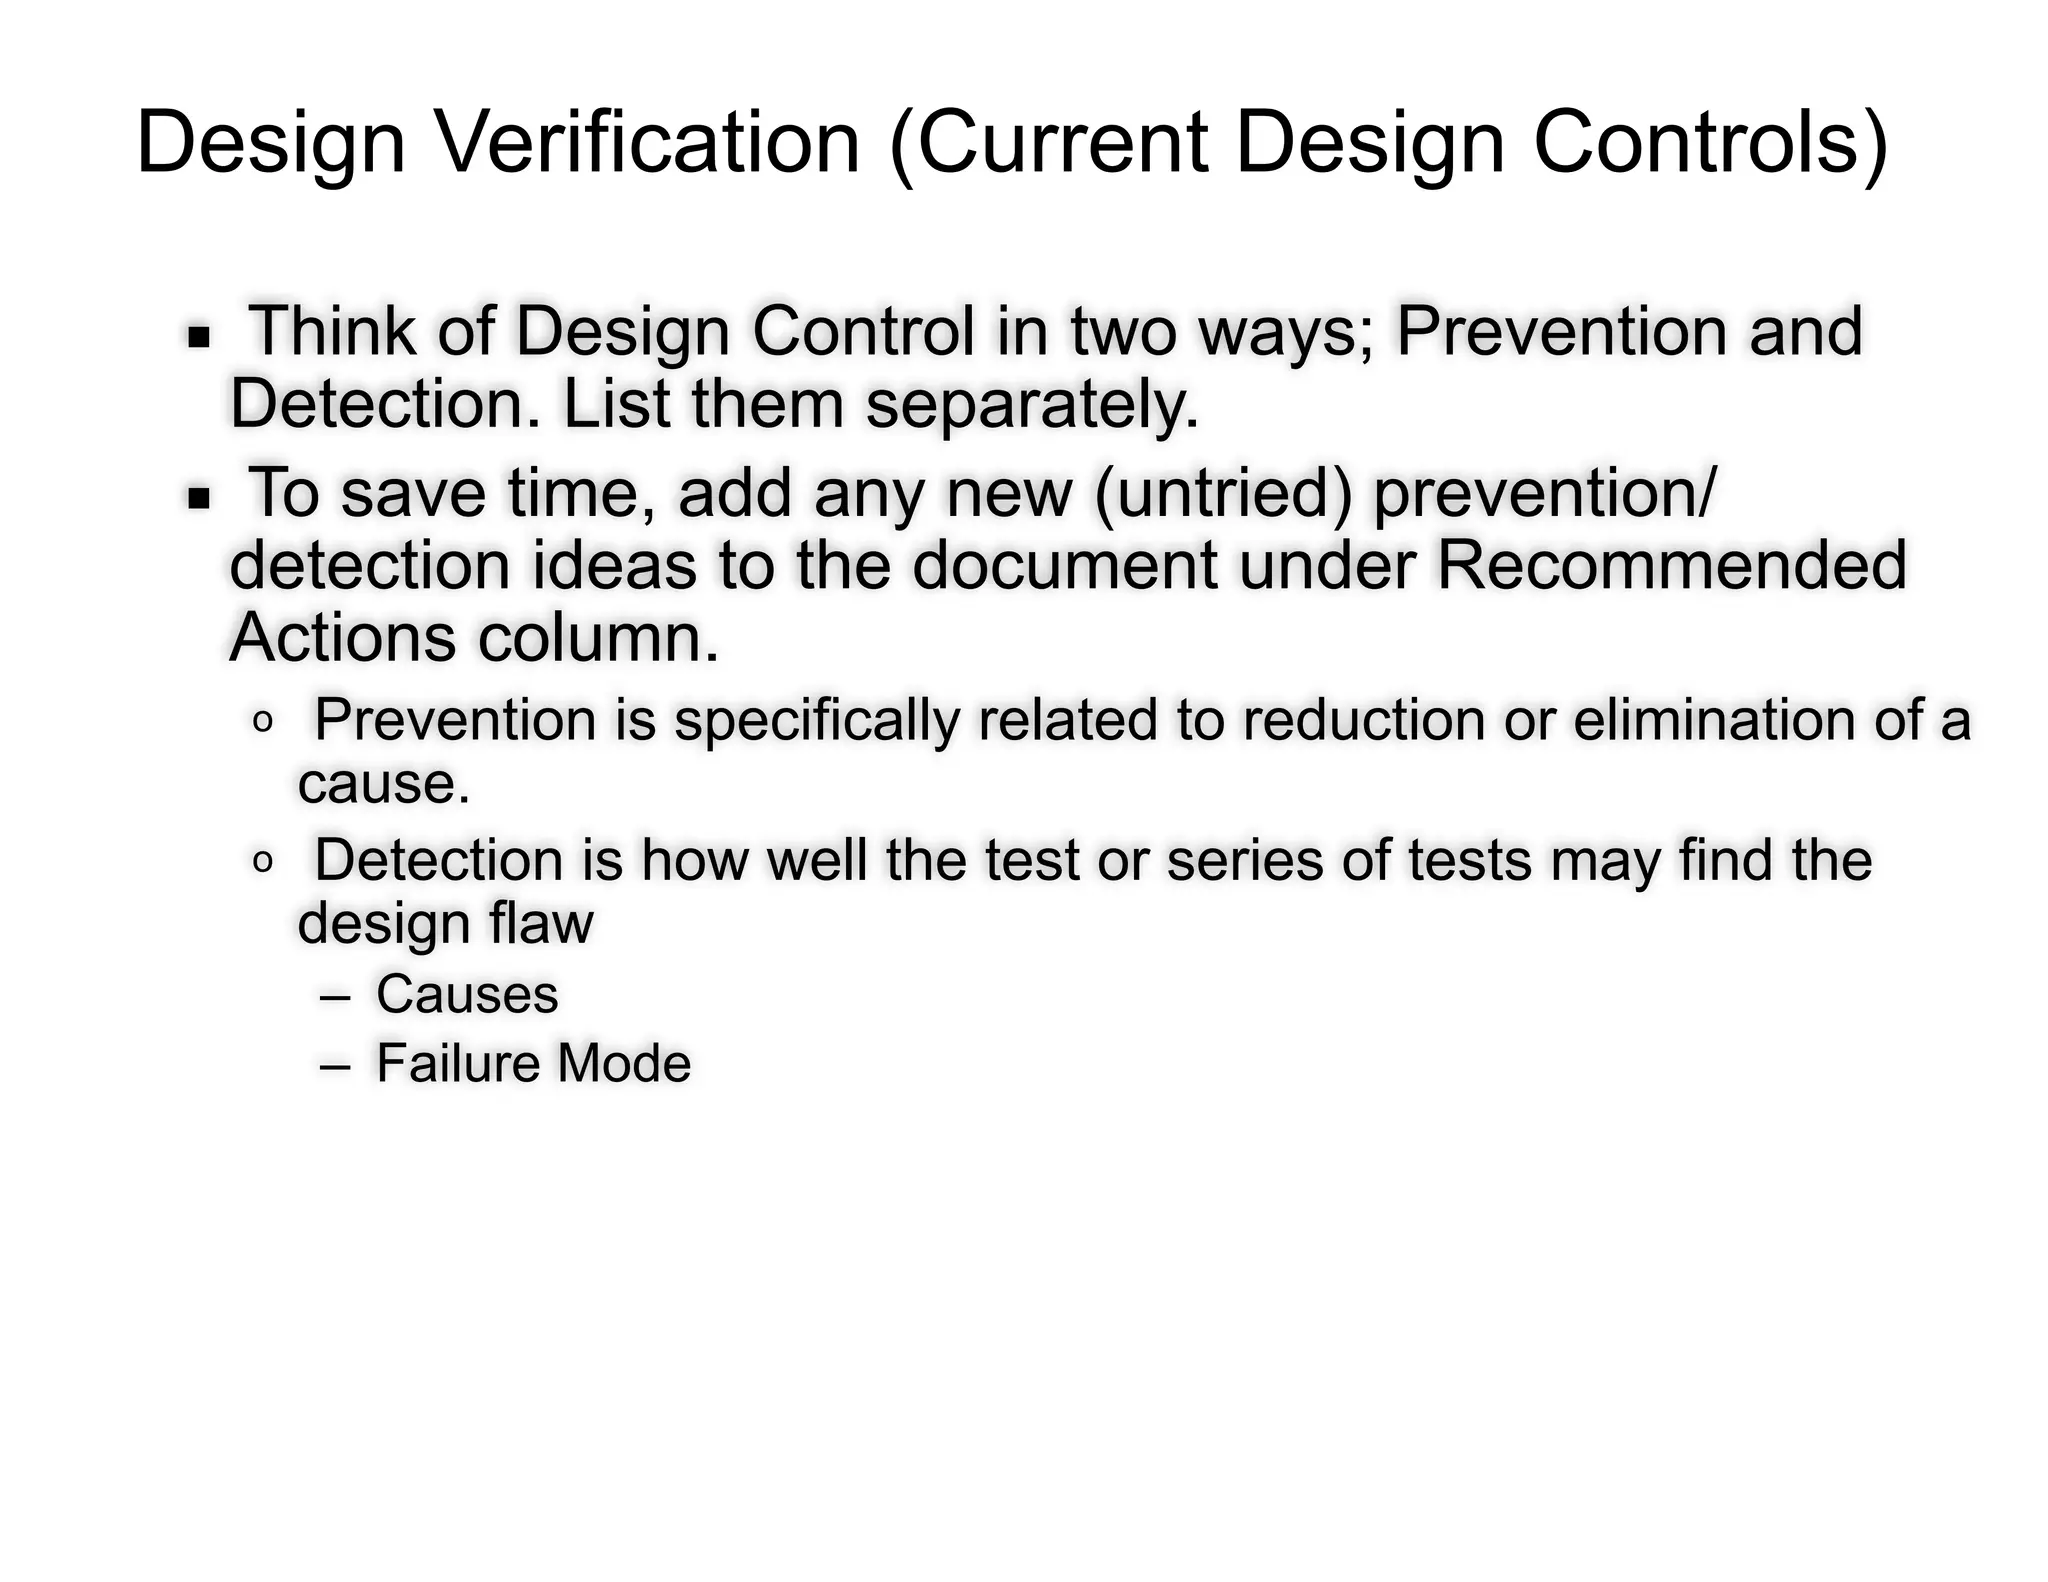
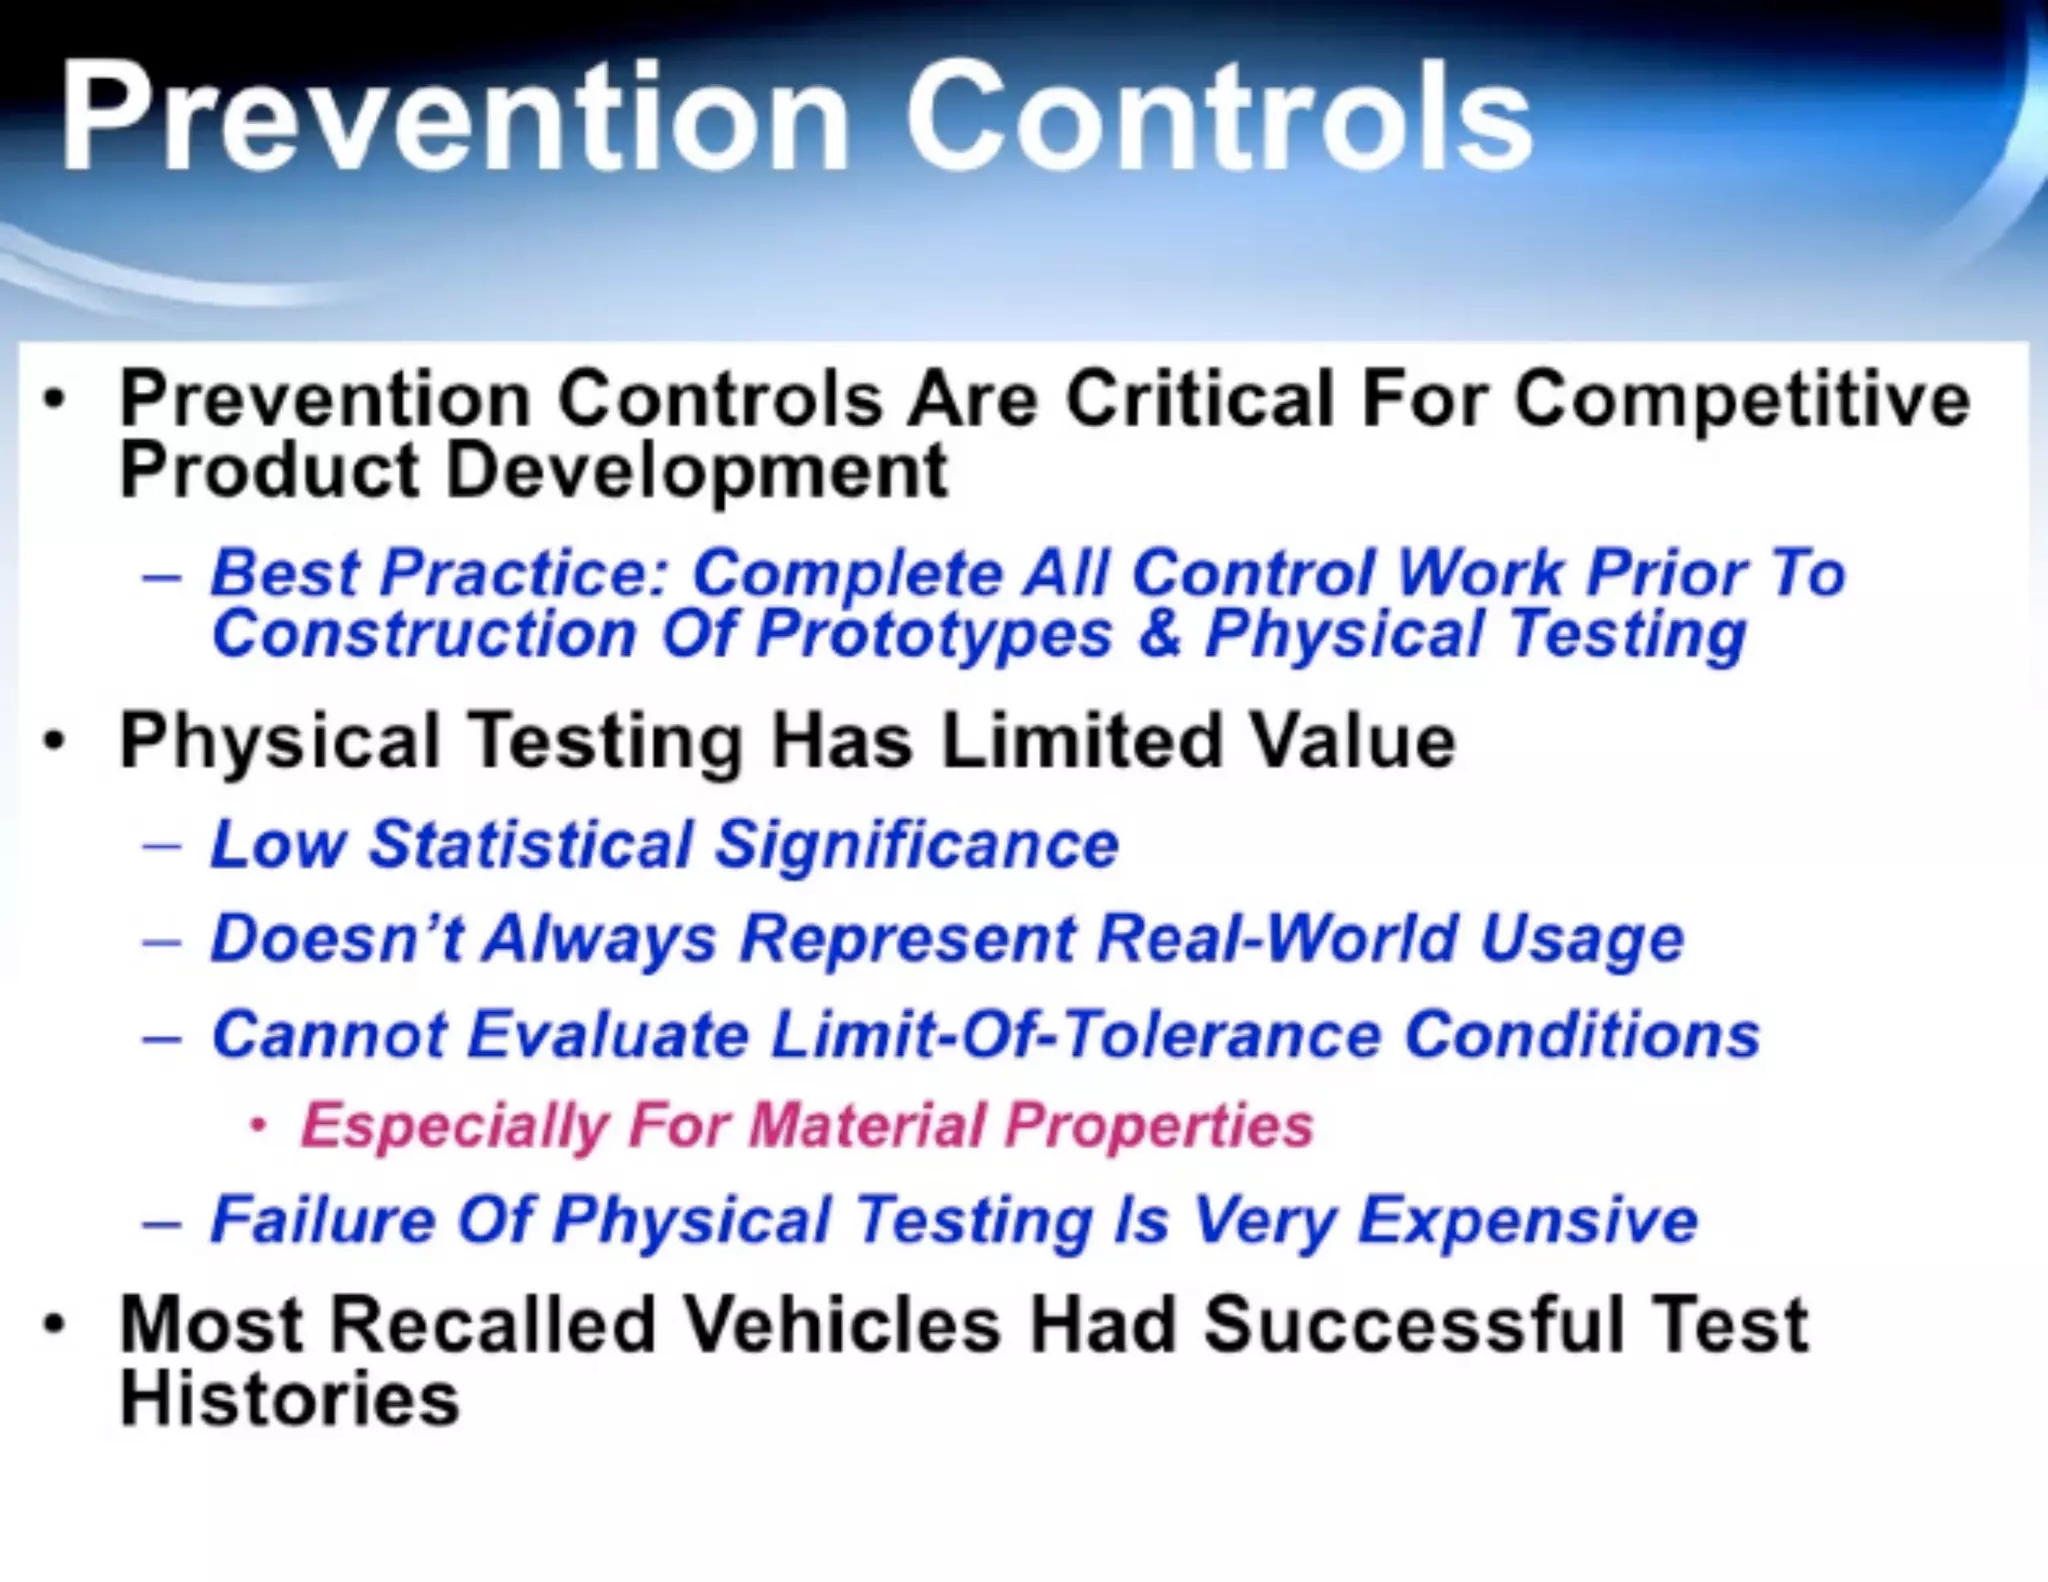
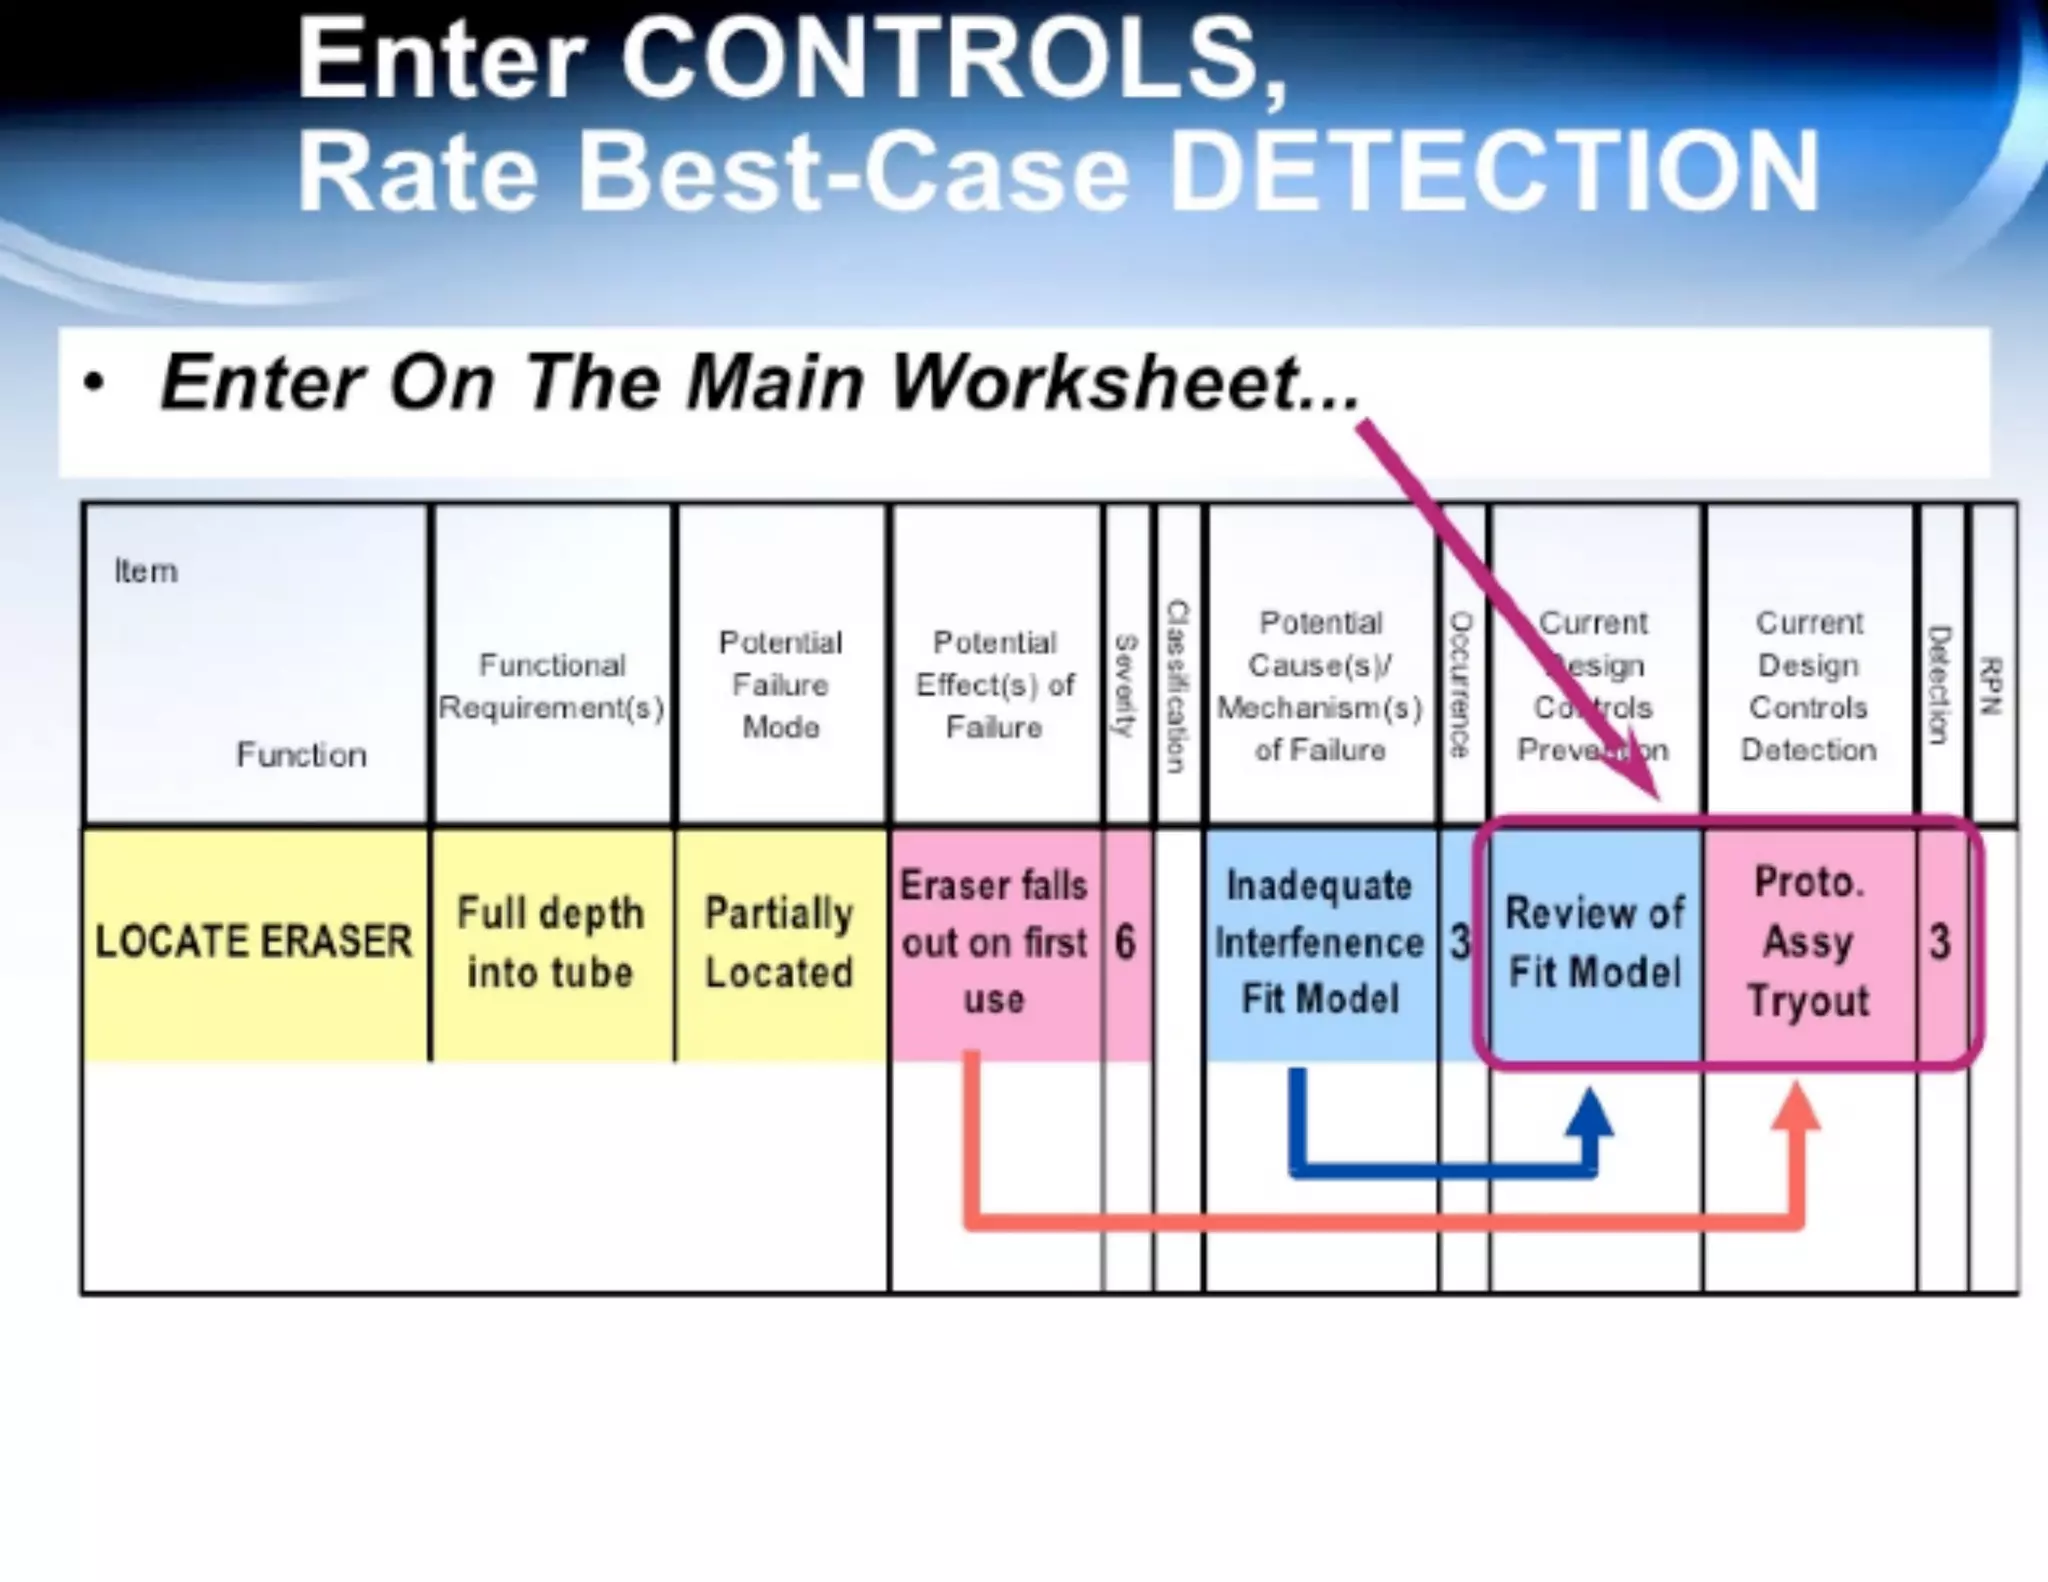
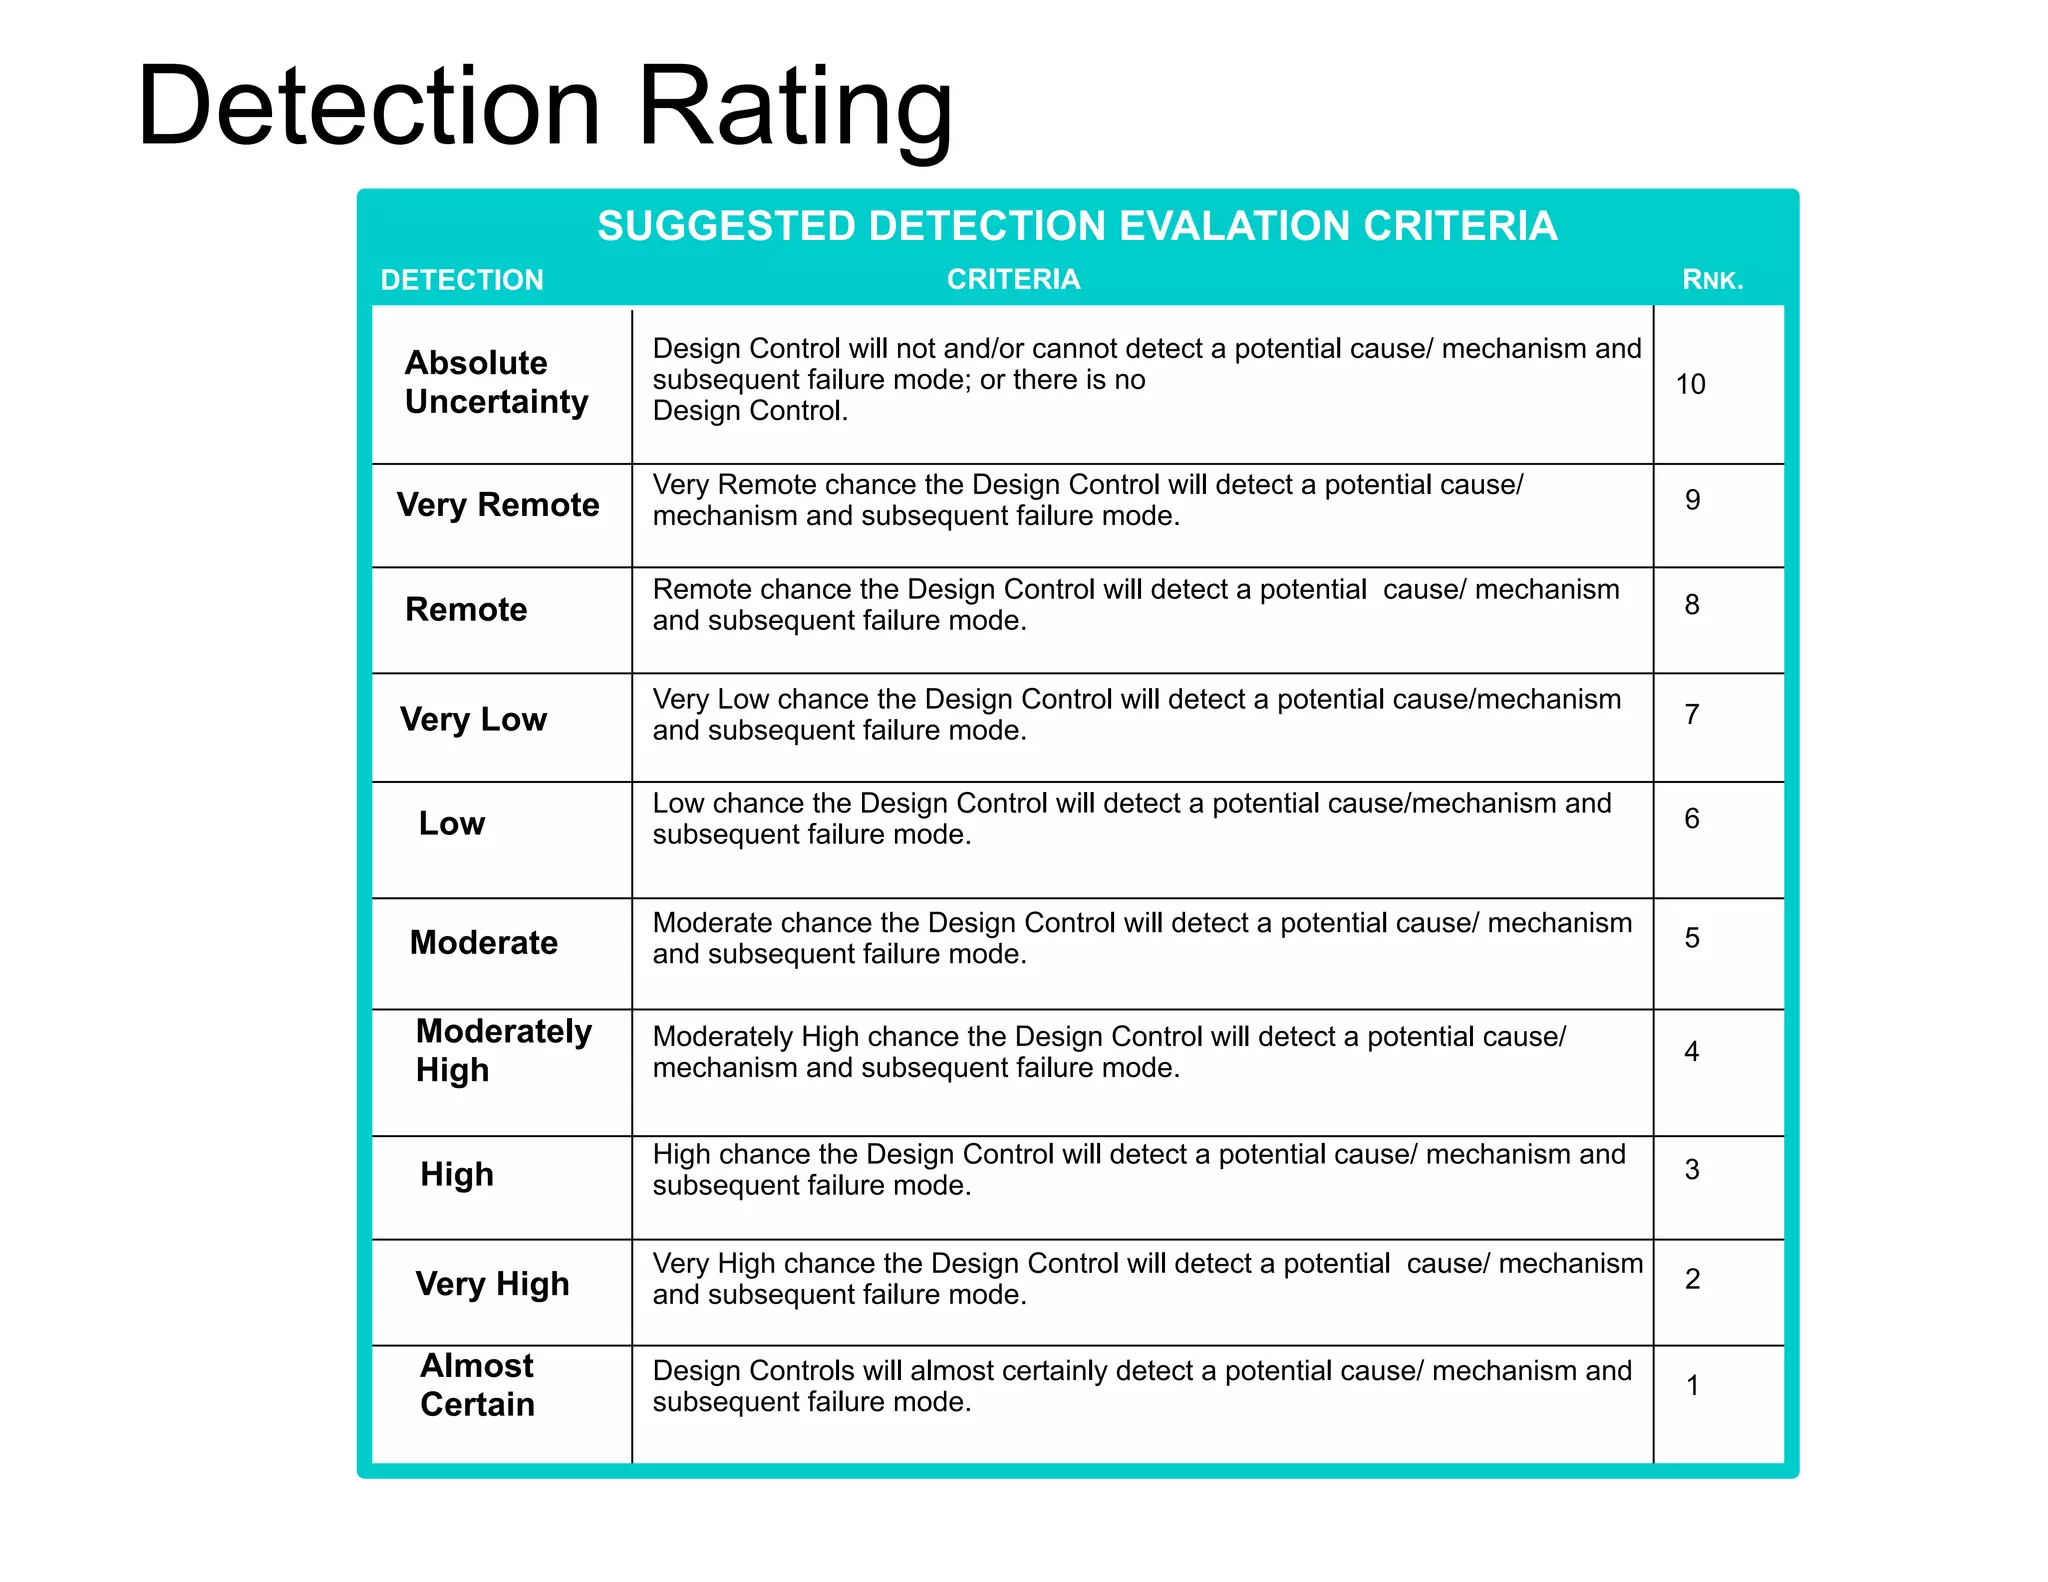
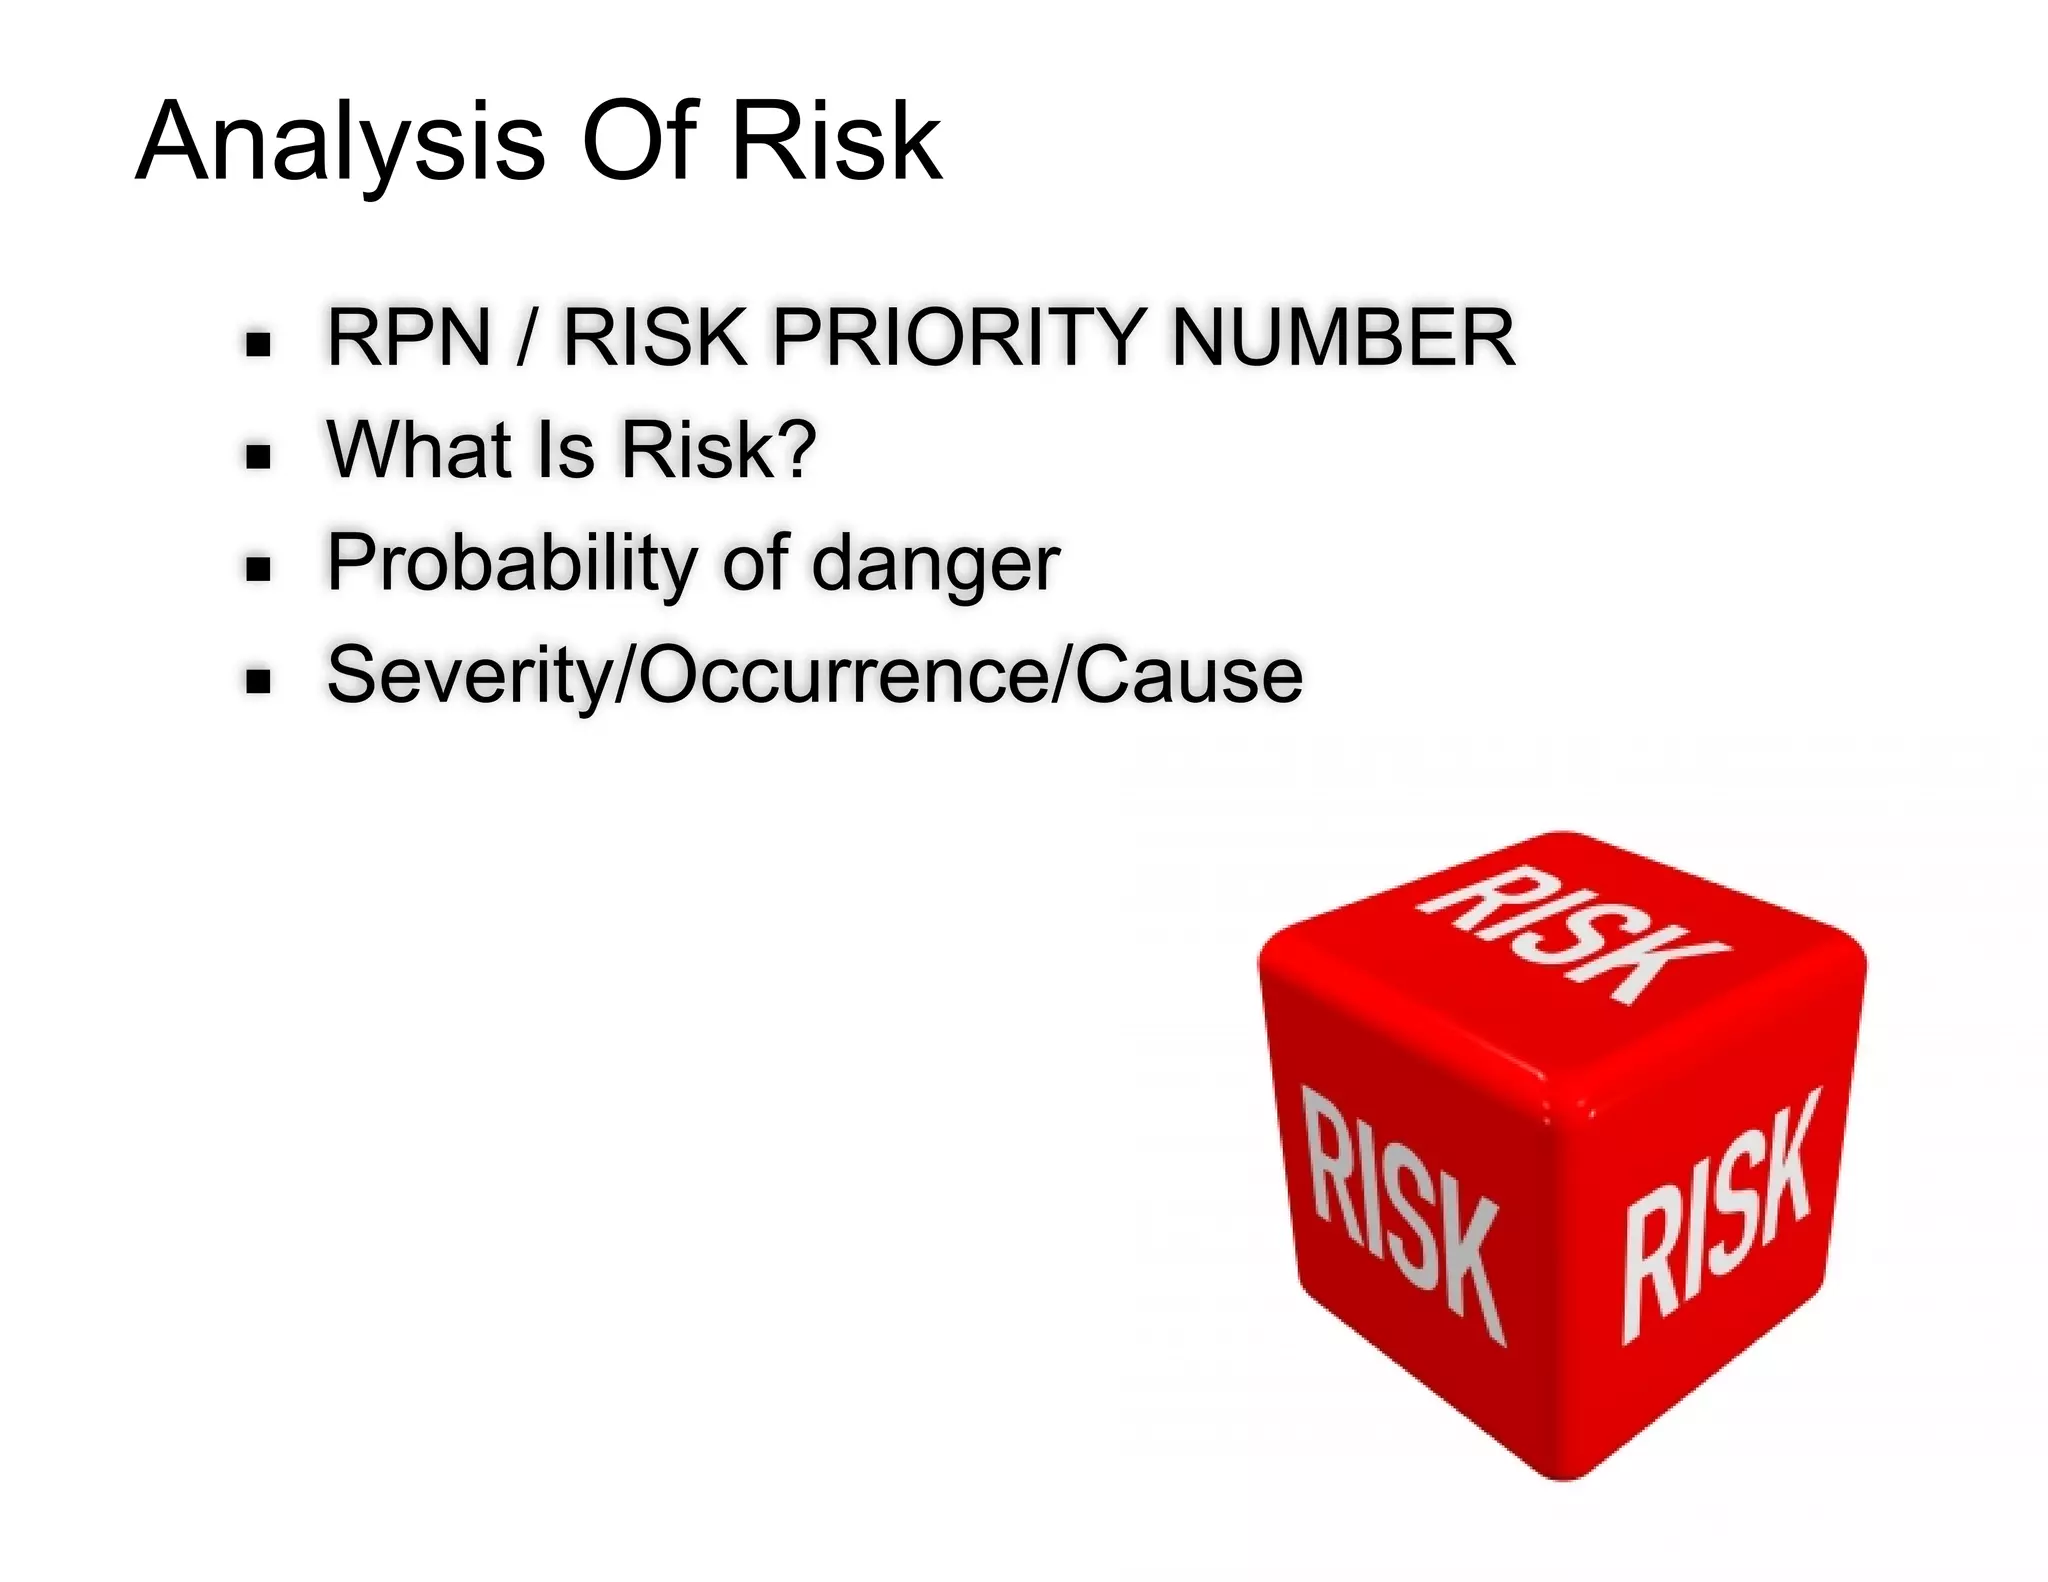
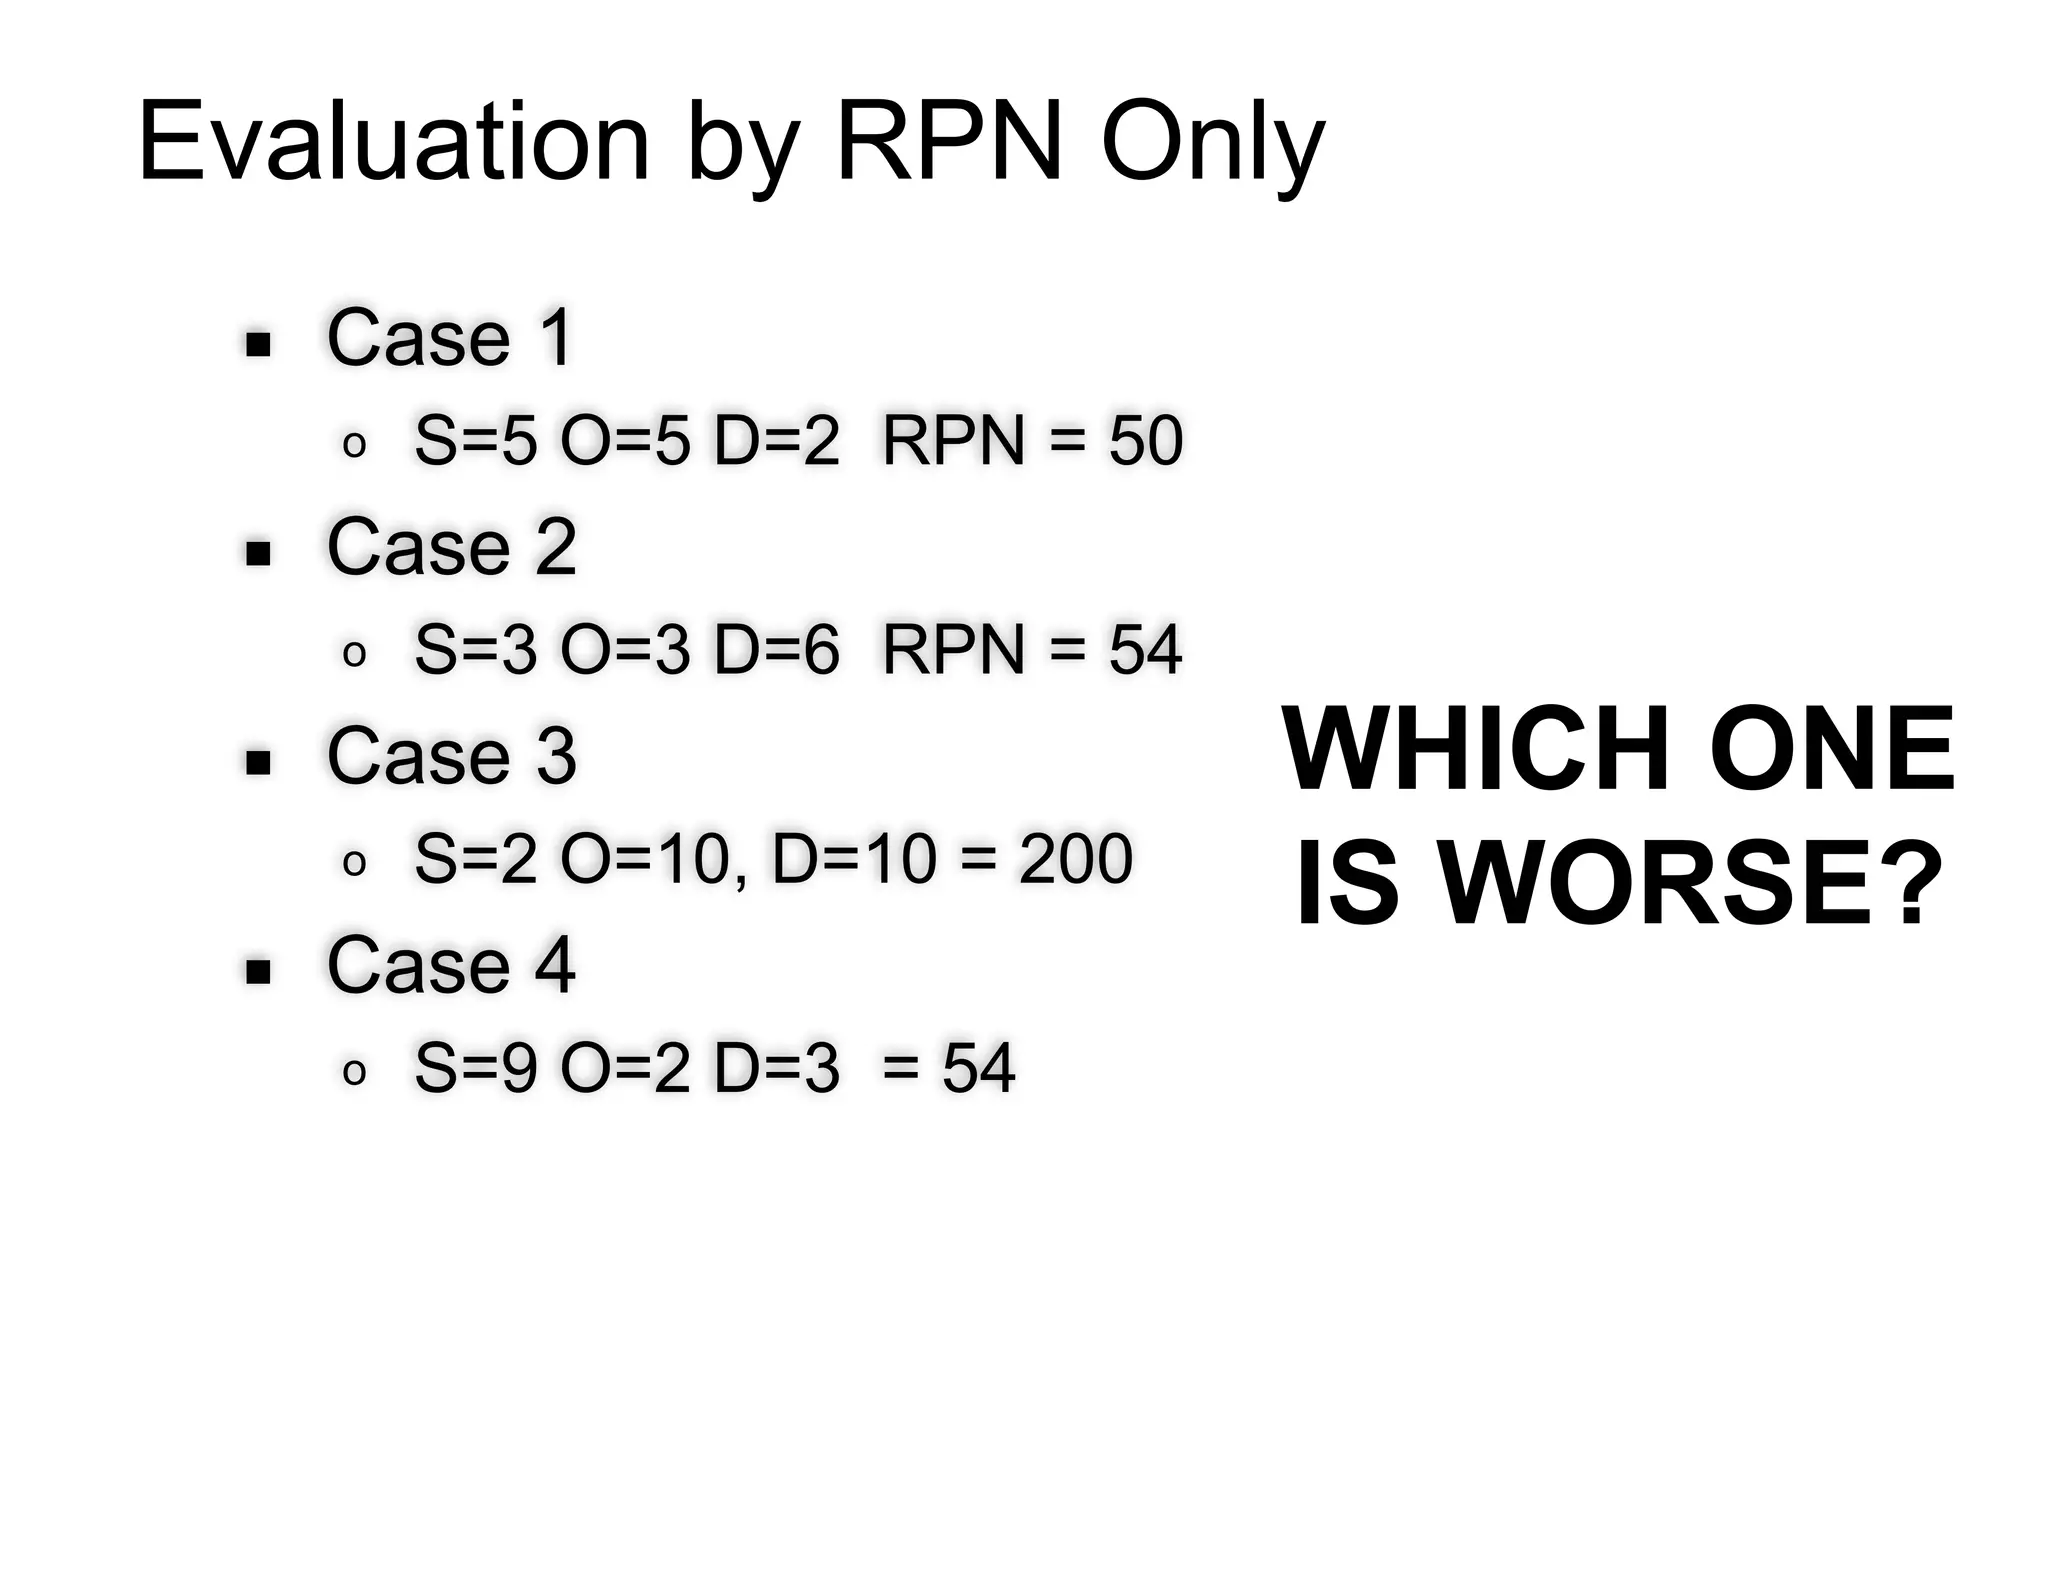
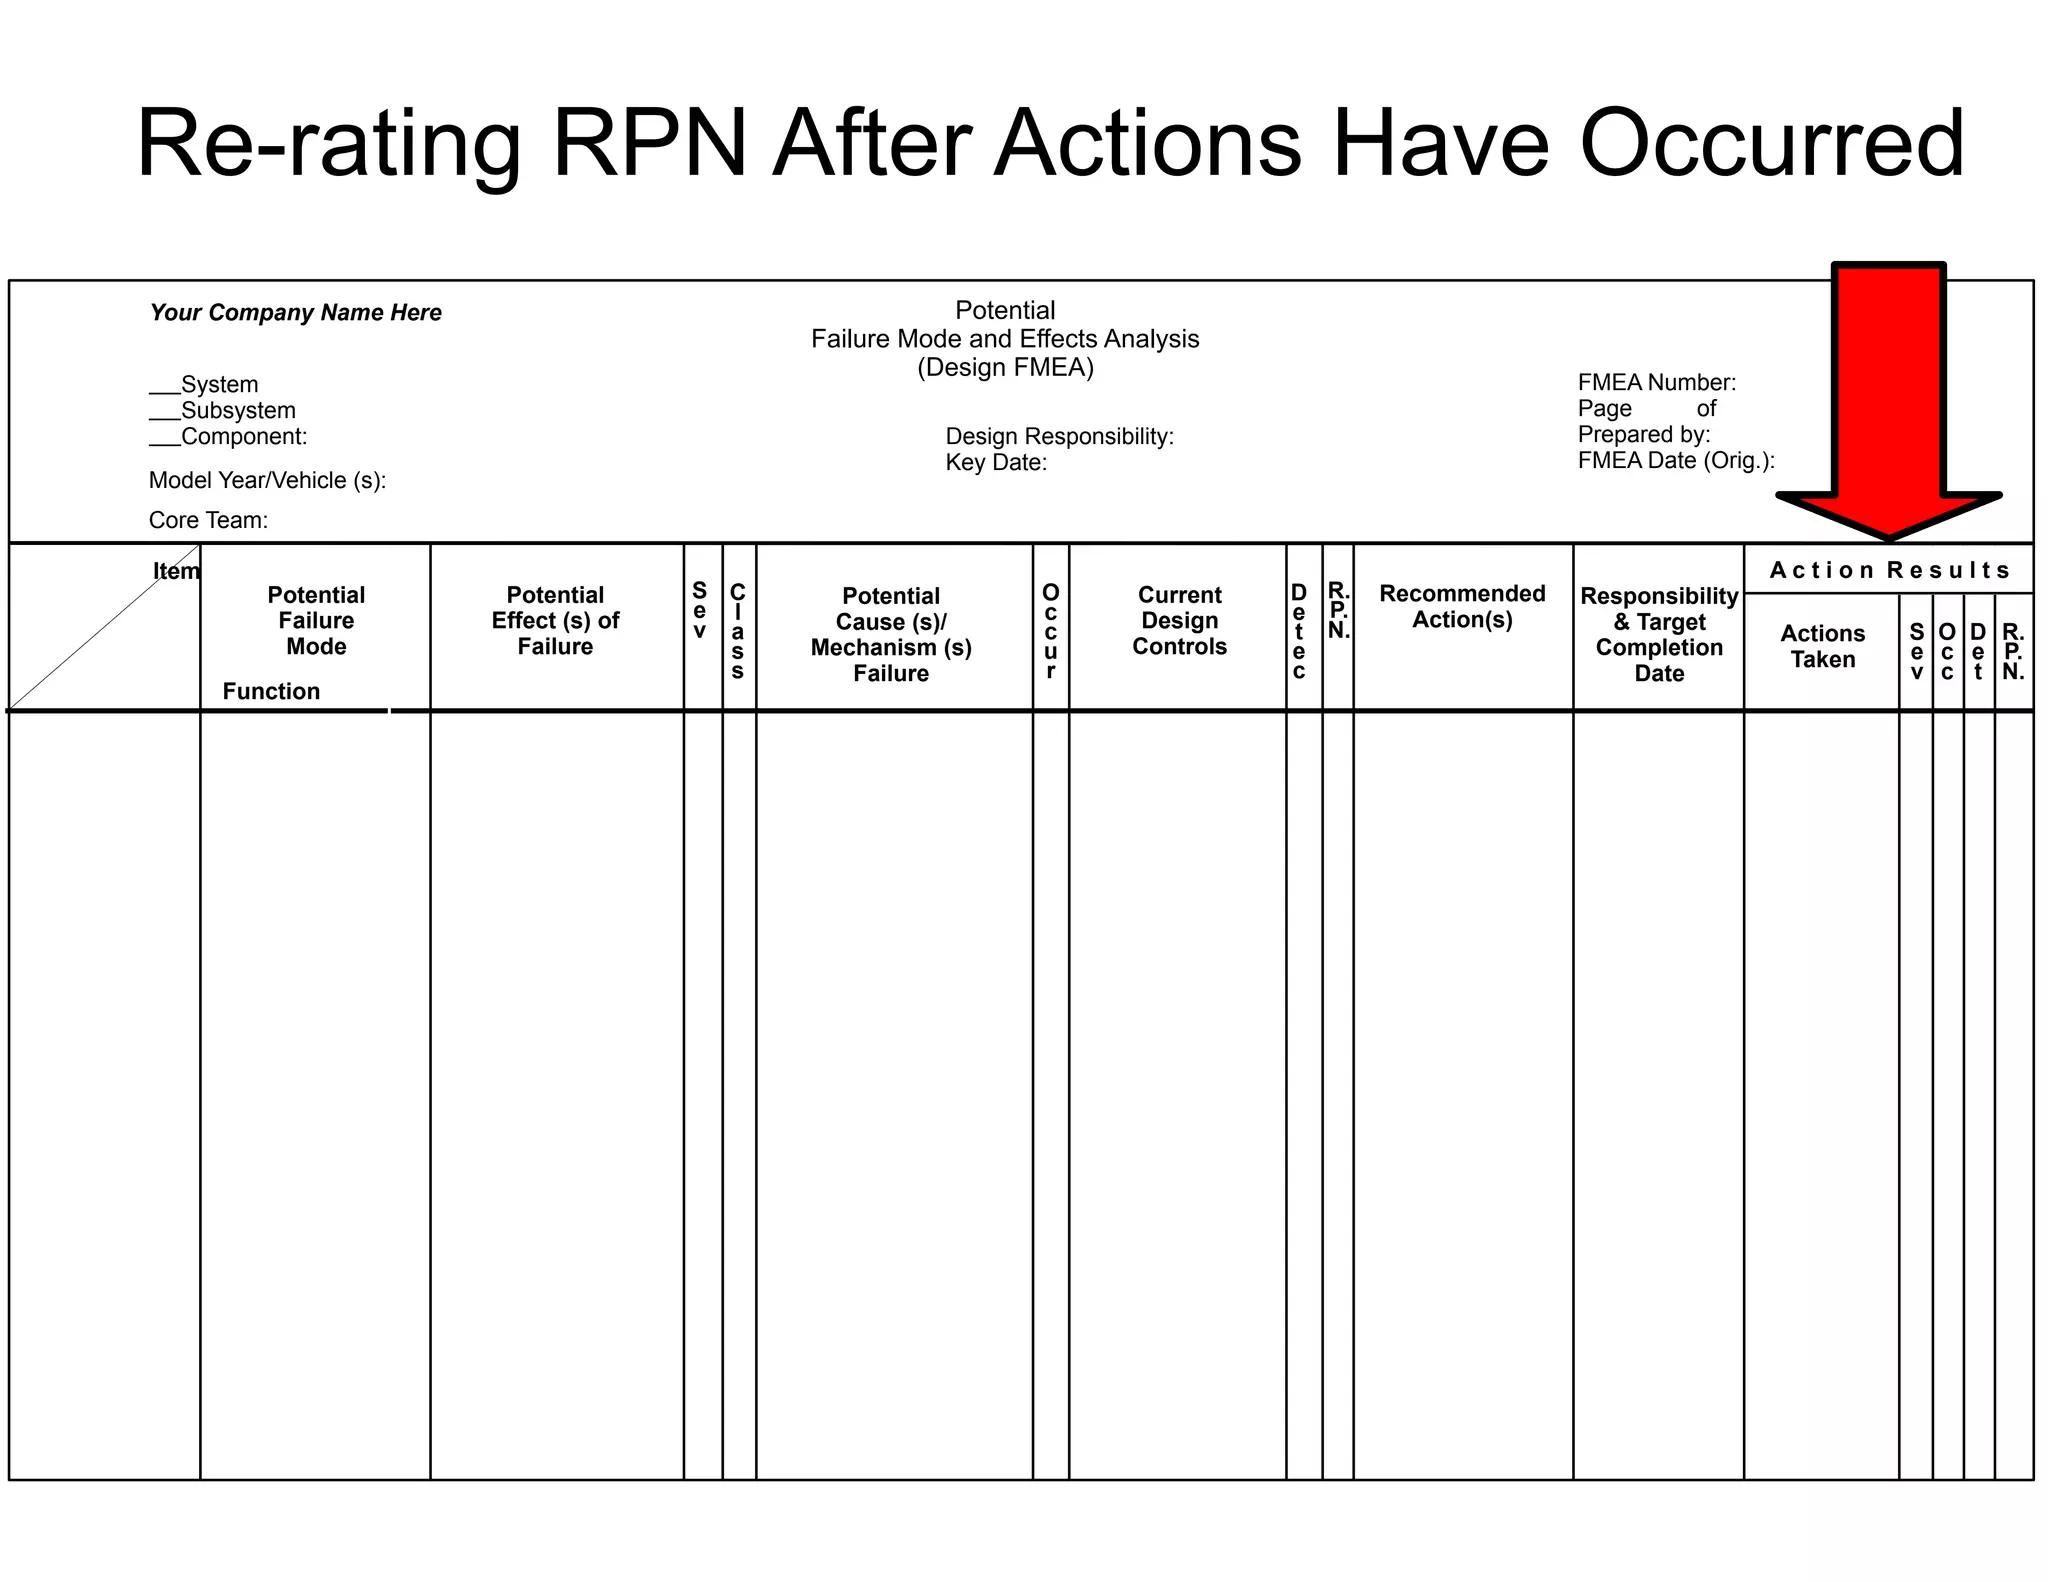

This document provides guidance on conducting a Design Failure Mode and Effects Analysis (DFMEA). It begins with defining the purpose of a FMEA and what it involves. It then discusses current DFMEA practices and concerns. The remainder of the document offers detailed instructions on performing a DFMEA, including how to construct a process flow diagram, interface matrix, evaluate potential failure modes and their effects/severity, occurrence, detection, and risk priority numbers. It provides examples and criteria for properly analyzing risk and prioritizing corrective actions. The overall summary is that the document aims to refine the approach to DFMEAs by outlining the full process and key considerations for effectively conducting a thorough design risk assessment.


![Fmea Handbook V4.1[1][1]](https://cdn.slidesharecdn.com/ss_thumbnails/fmeahandbookv4111-1310447612699-phpapp01-110712001630-phpapp01-thumbnail.jpg?width=640&height=640&fit=bounds)


