Downloaded 11 times
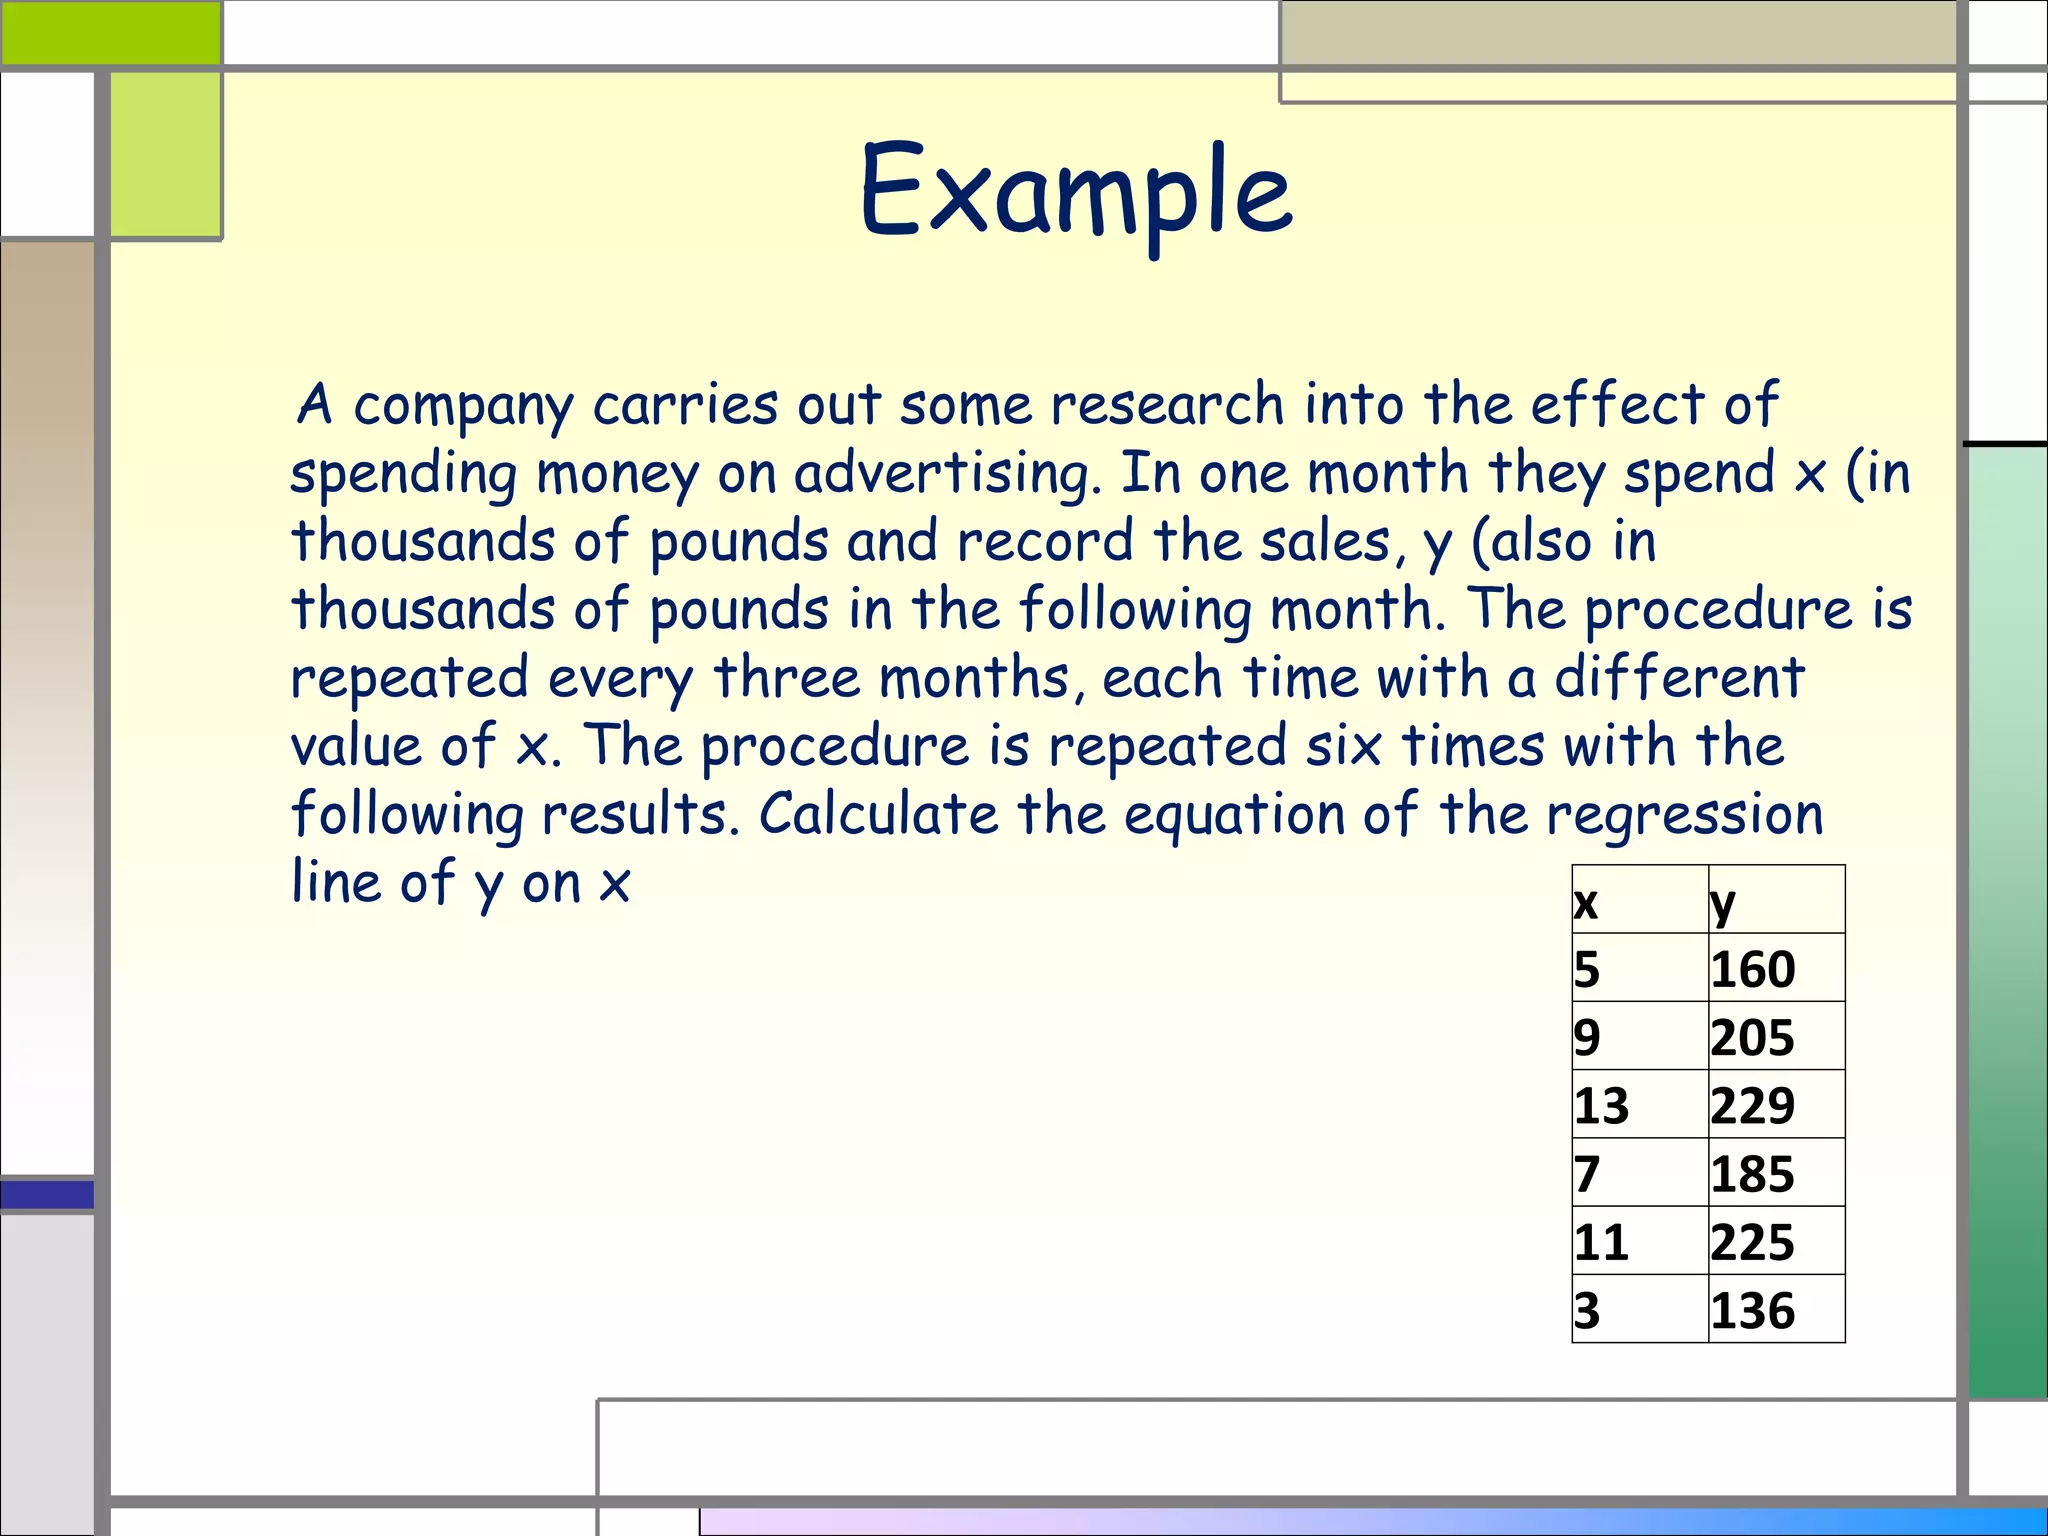
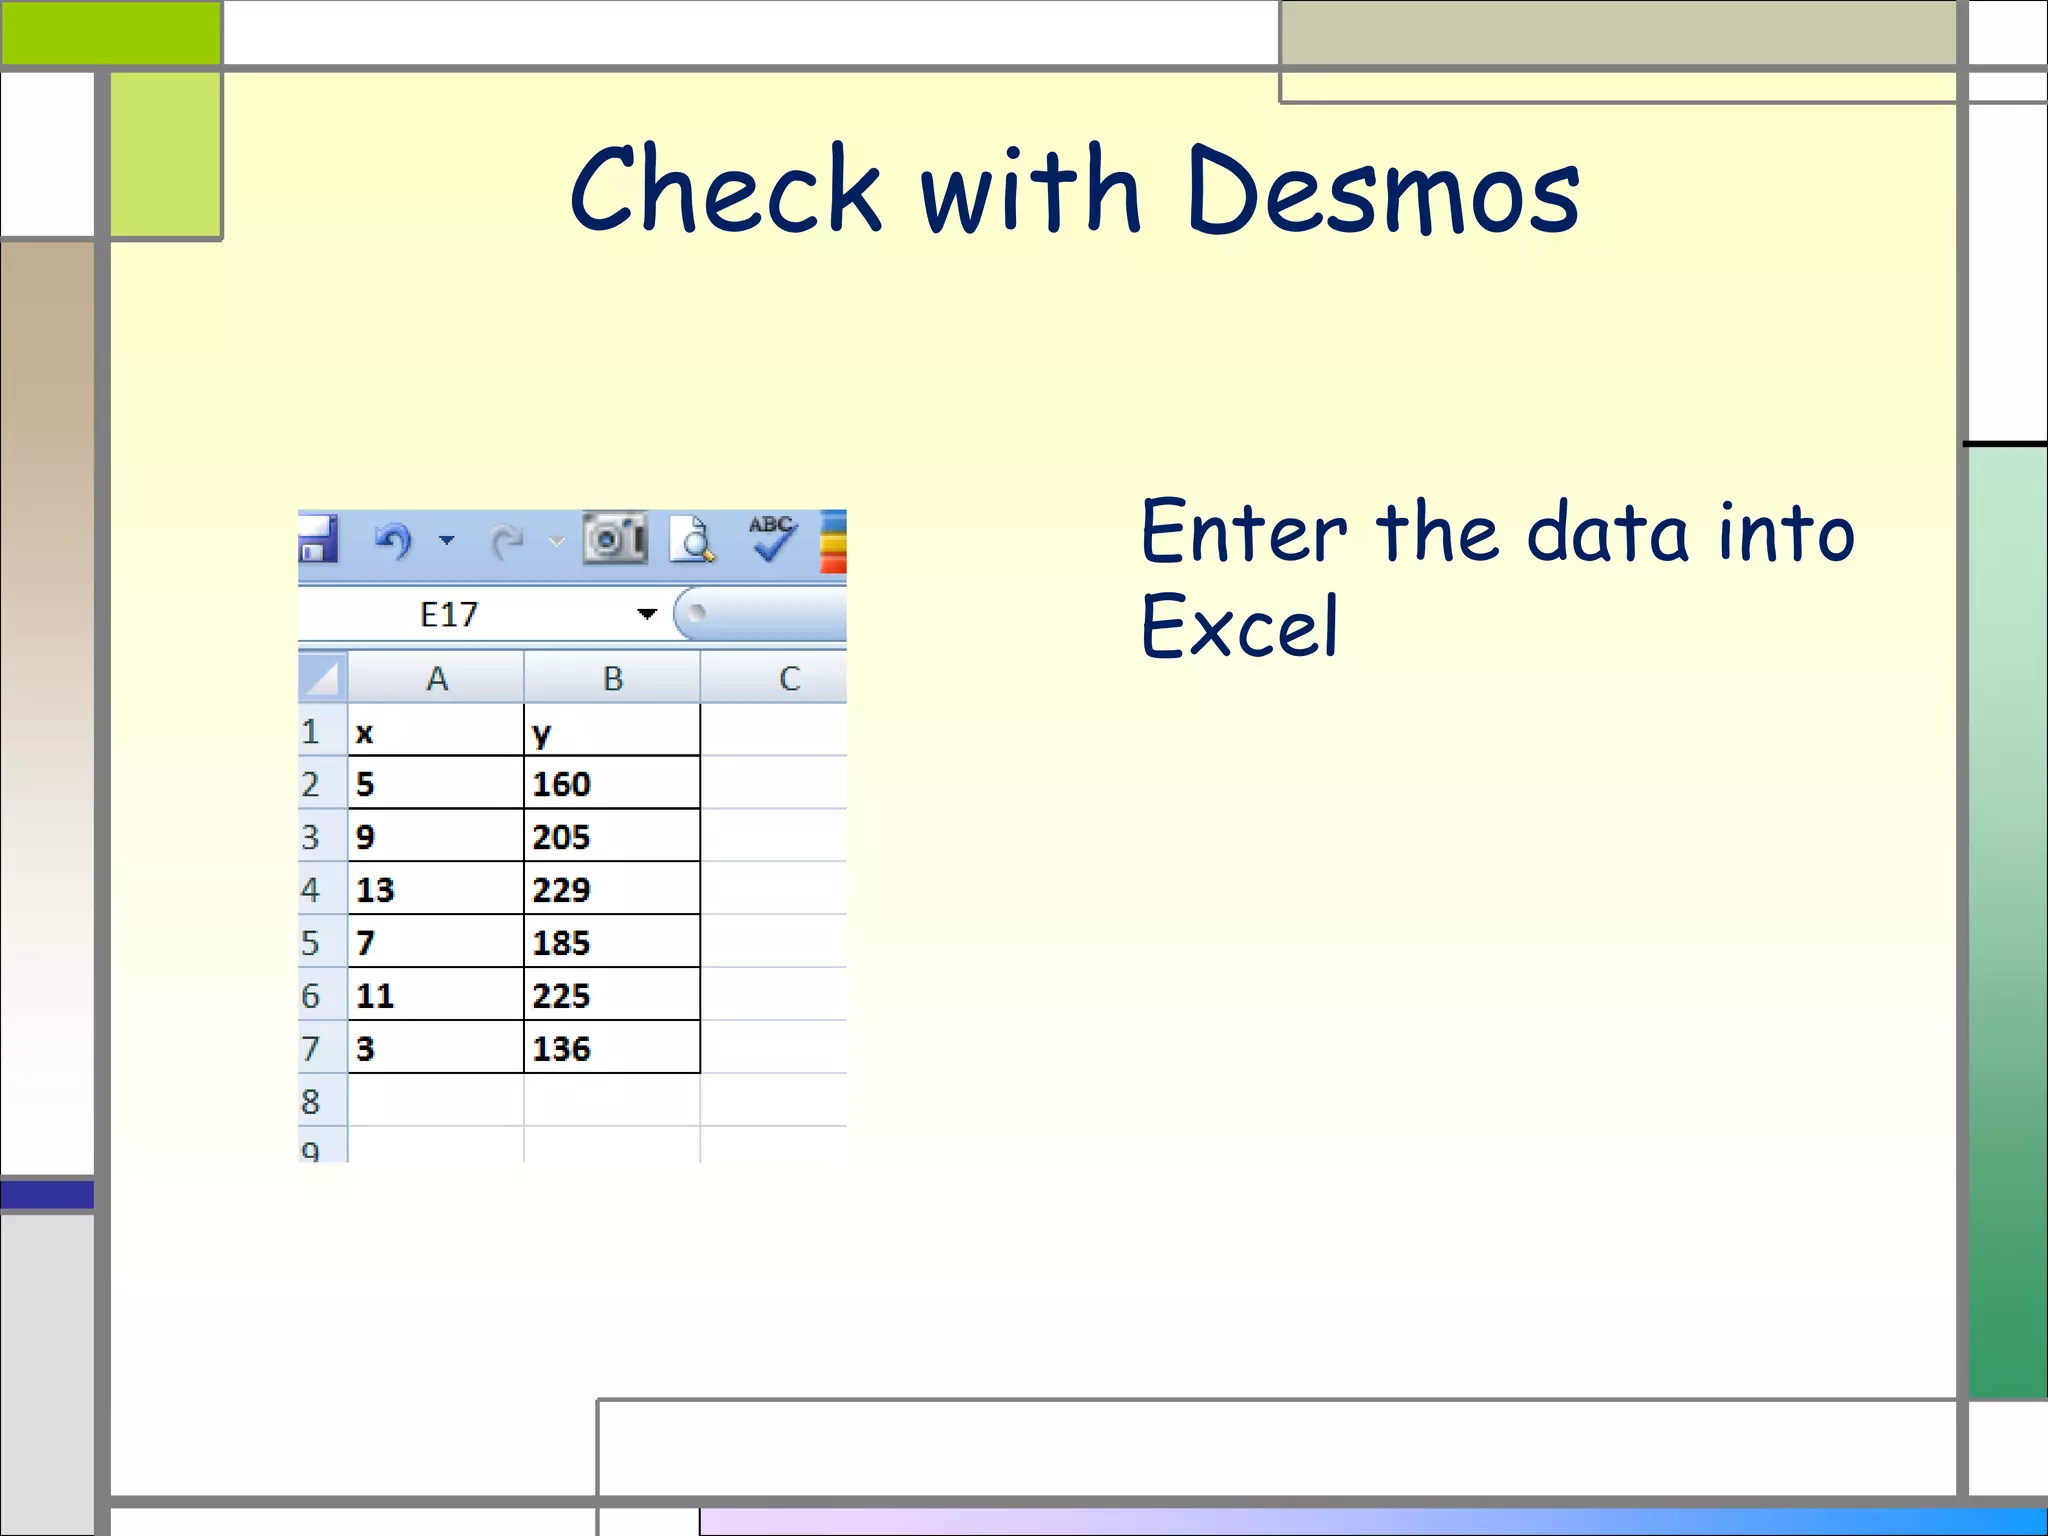
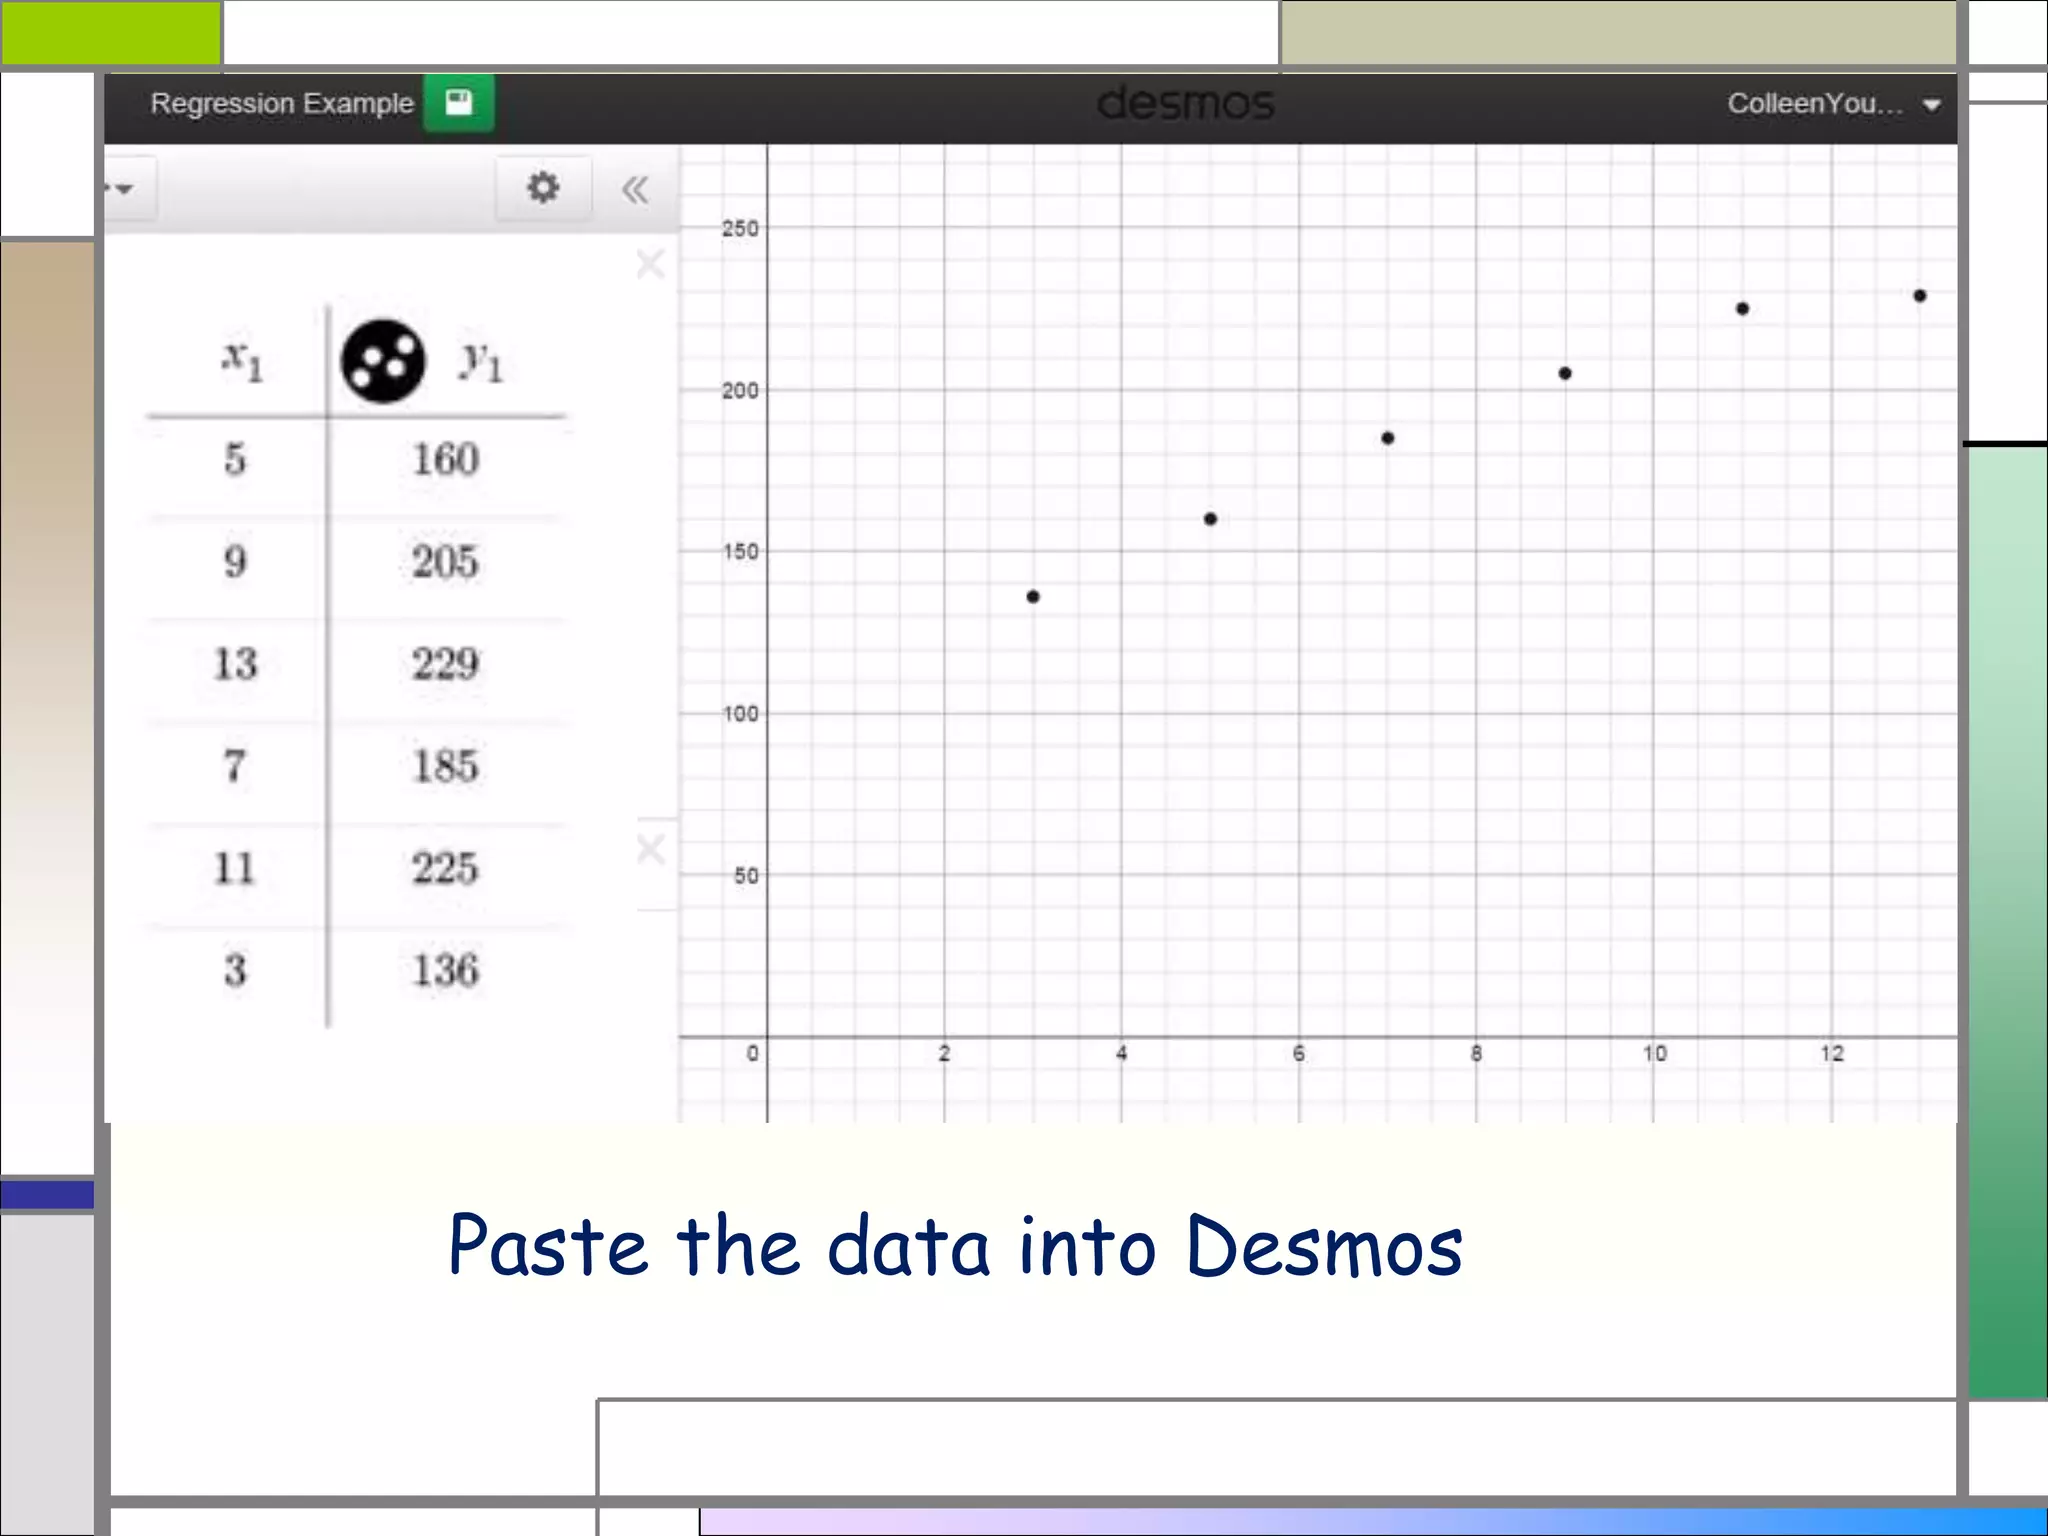
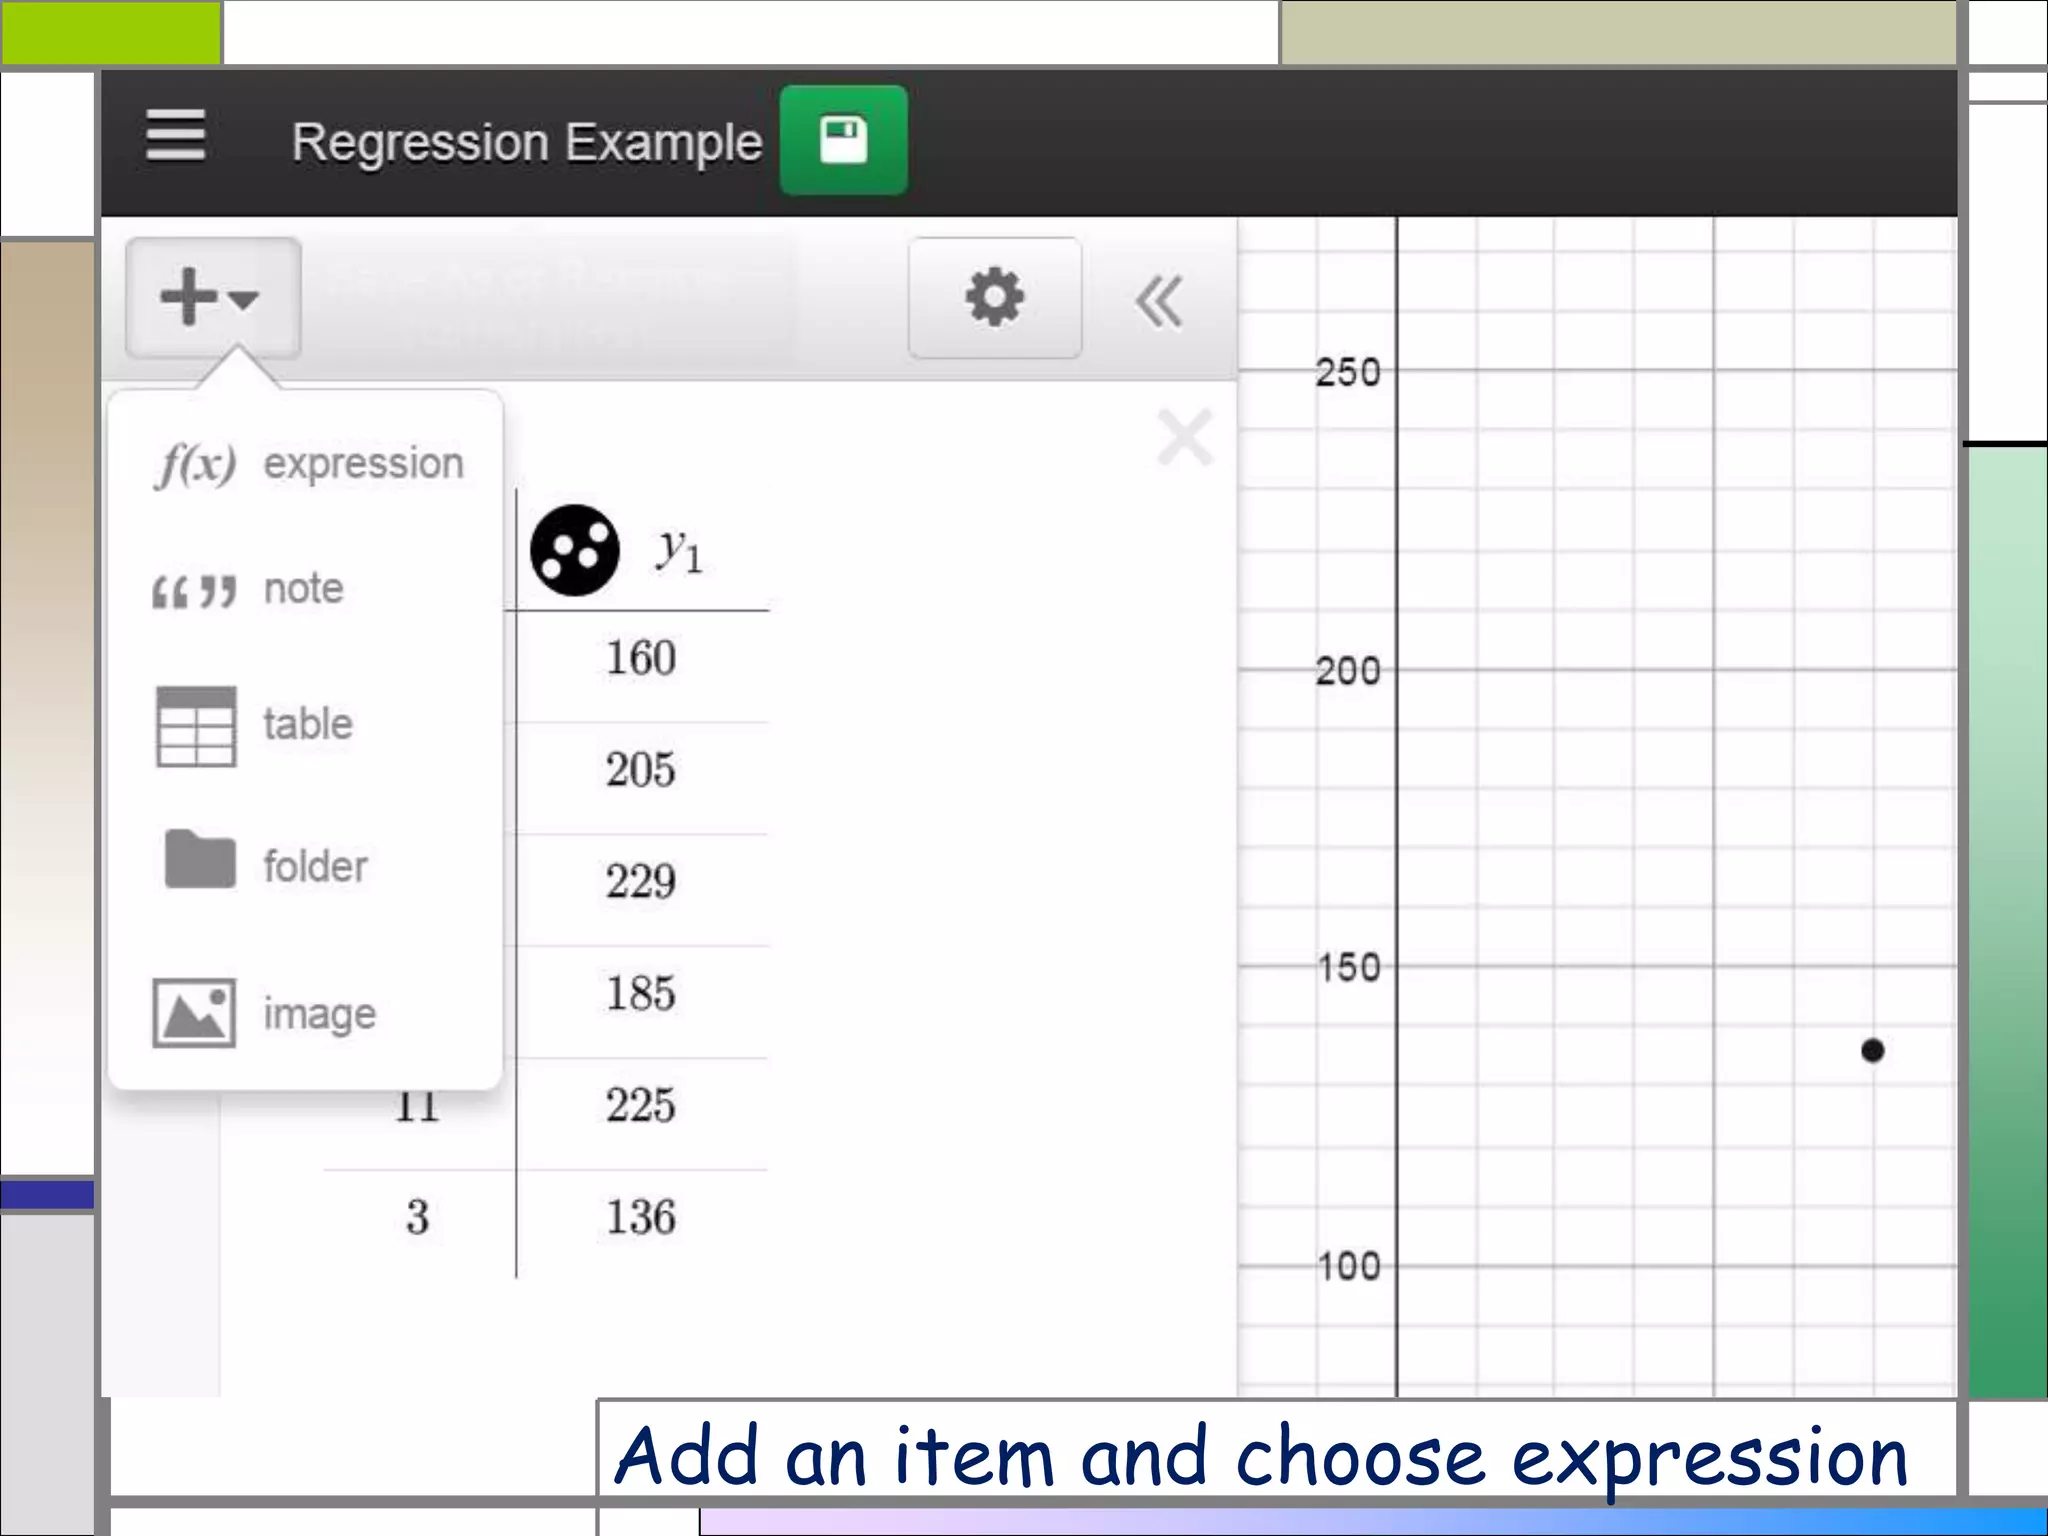
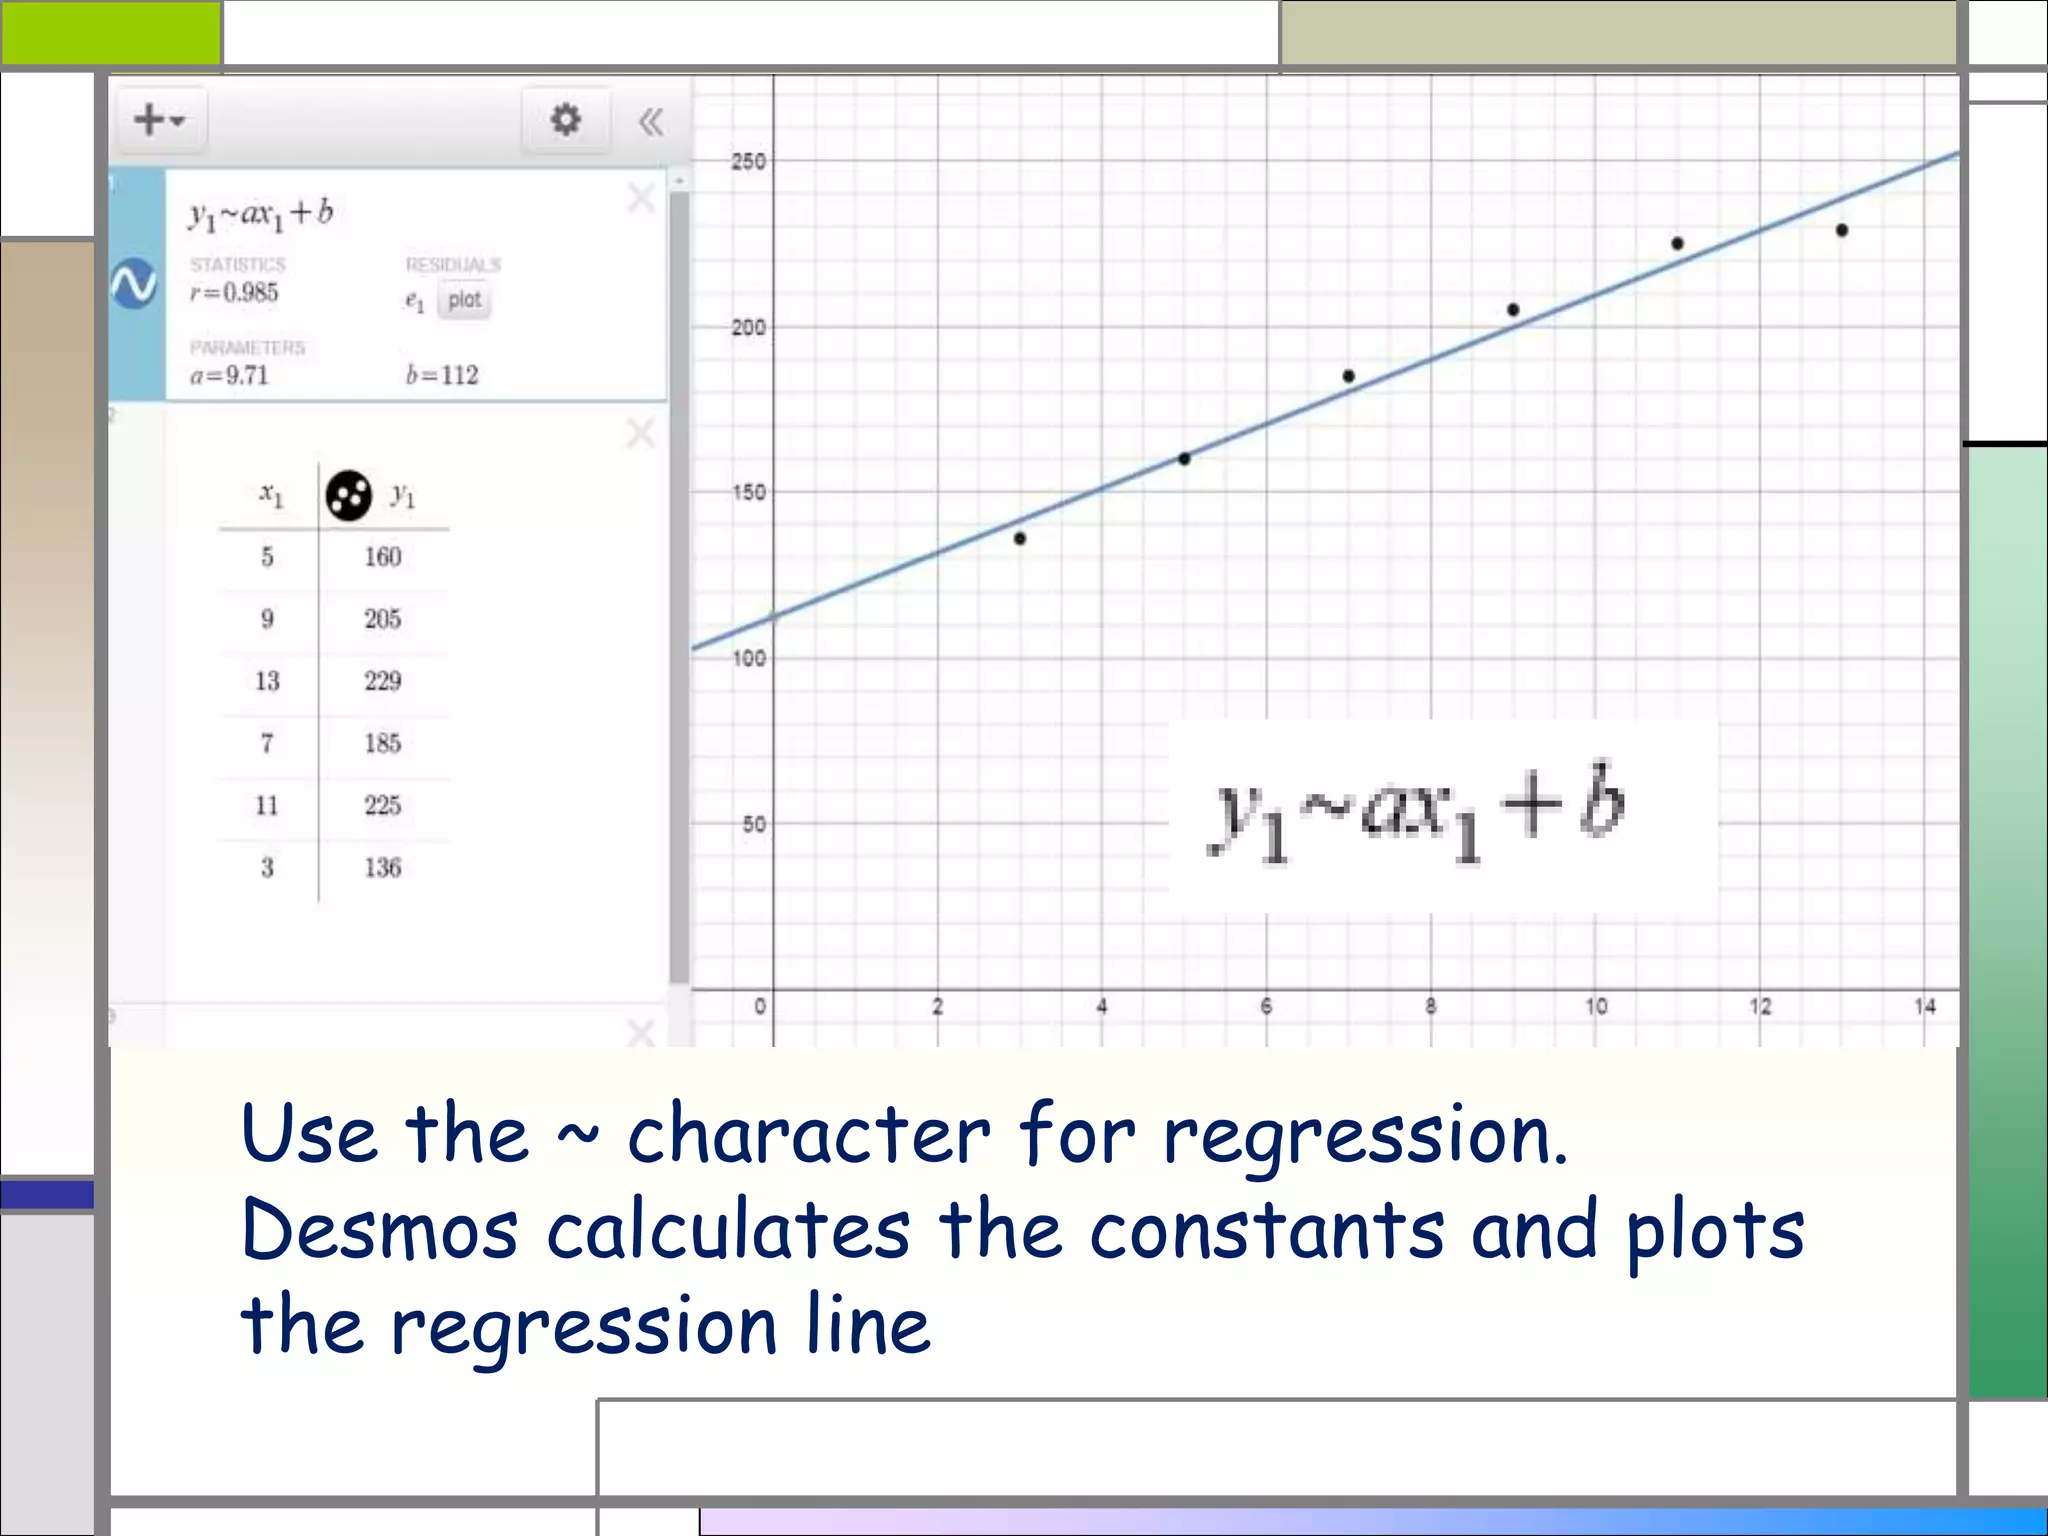
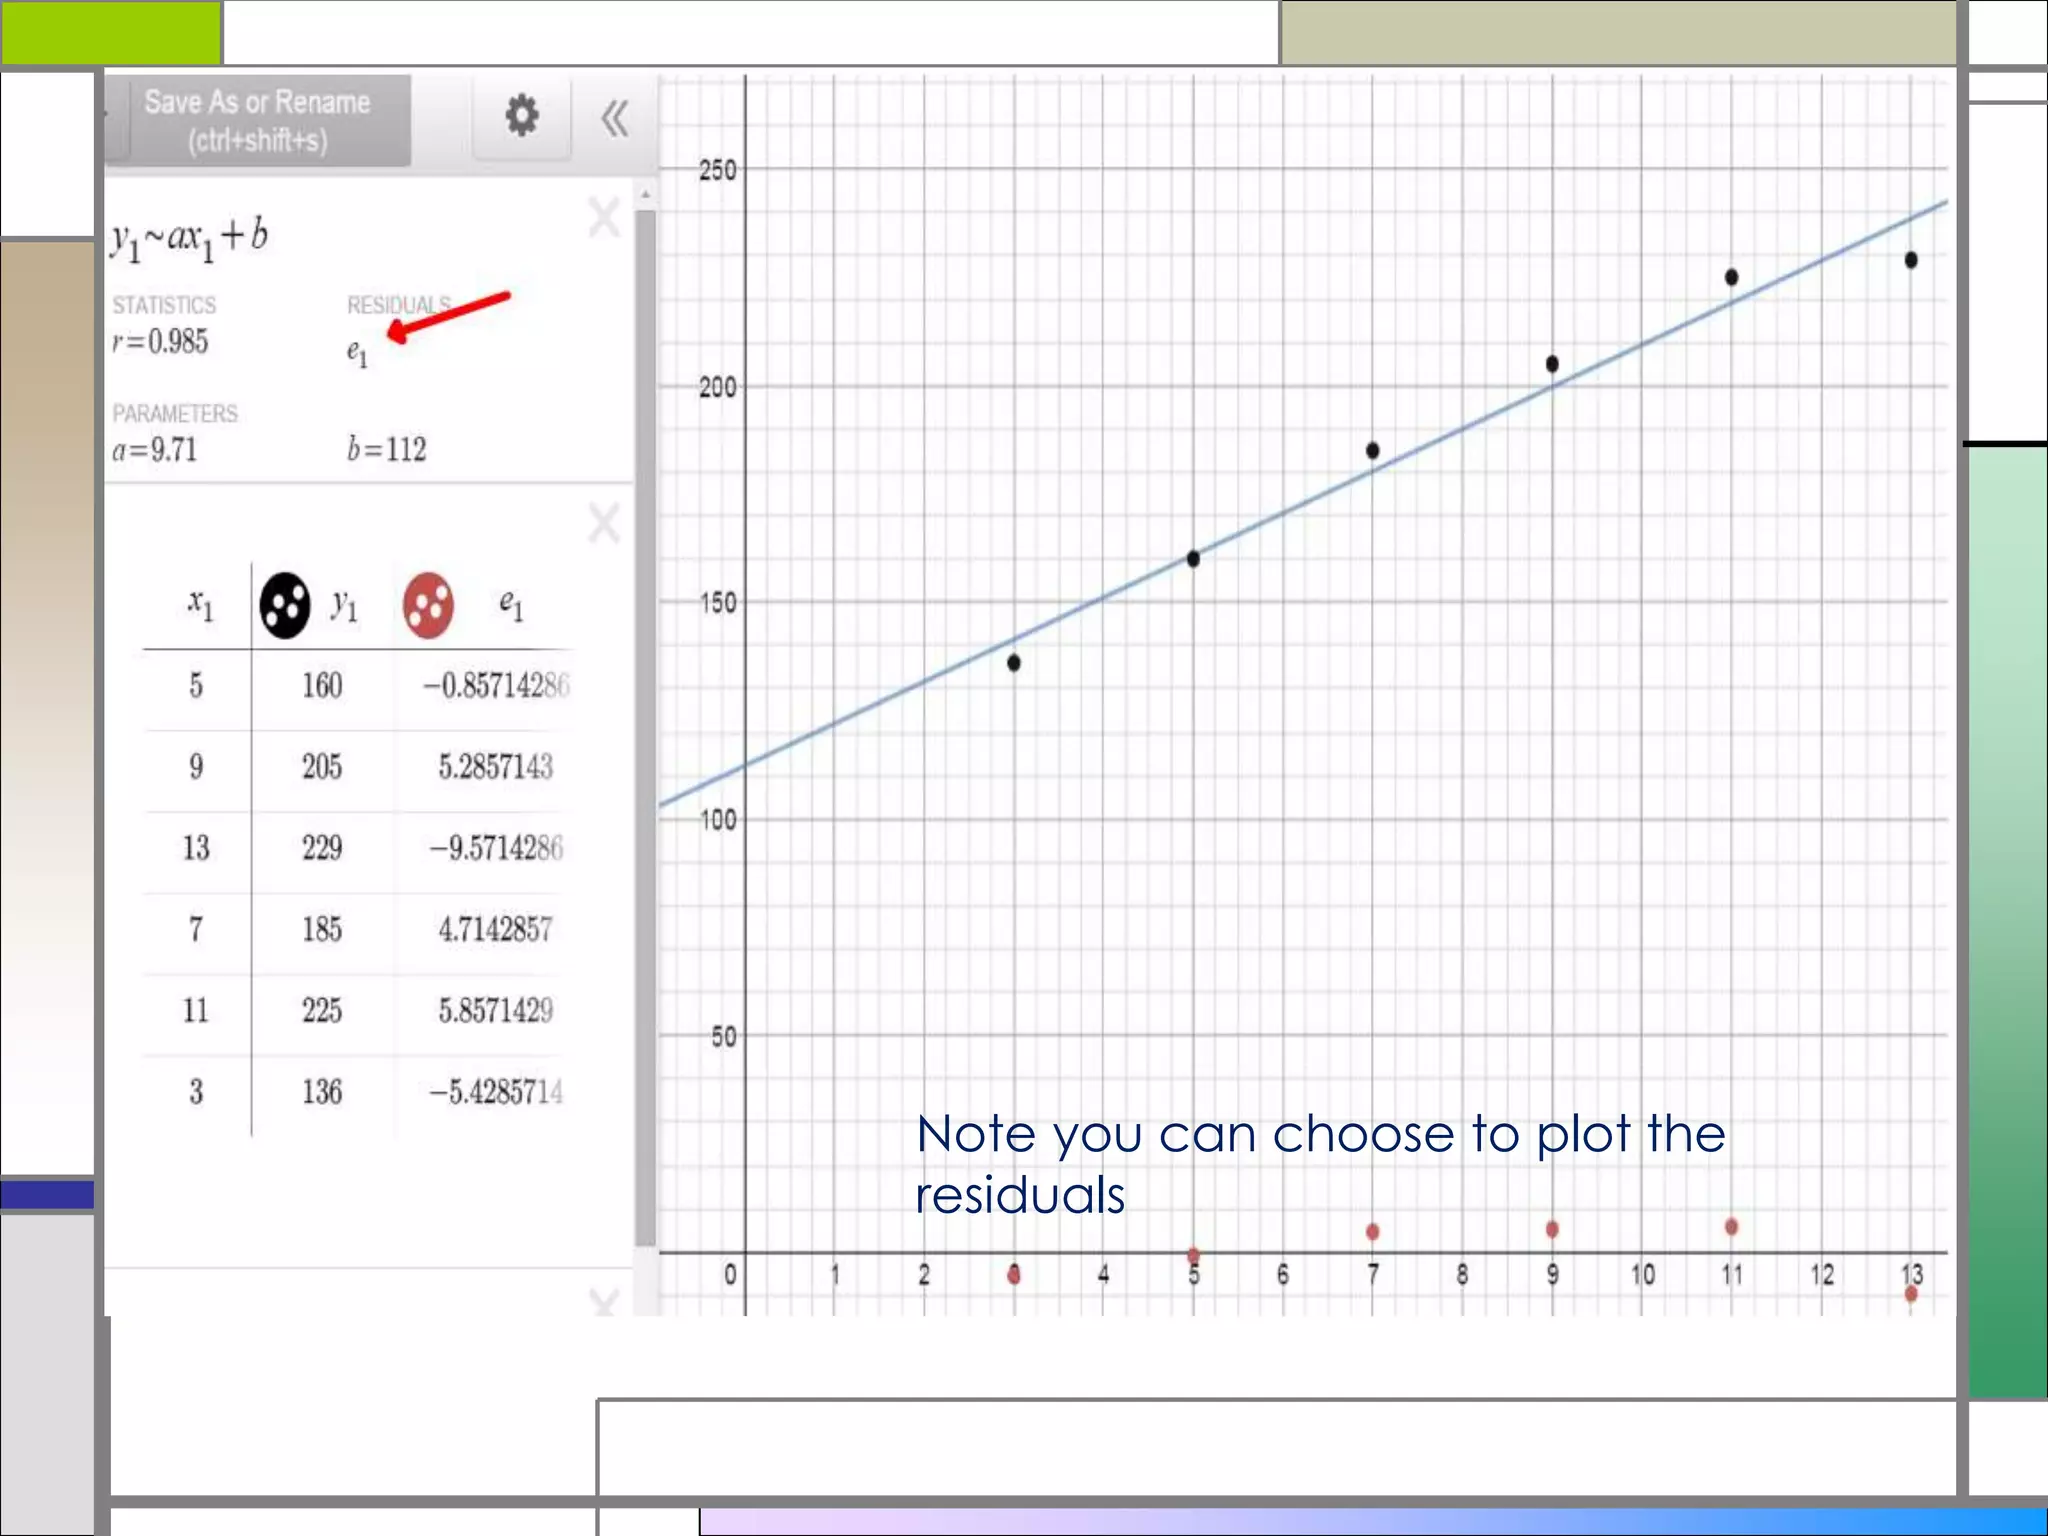
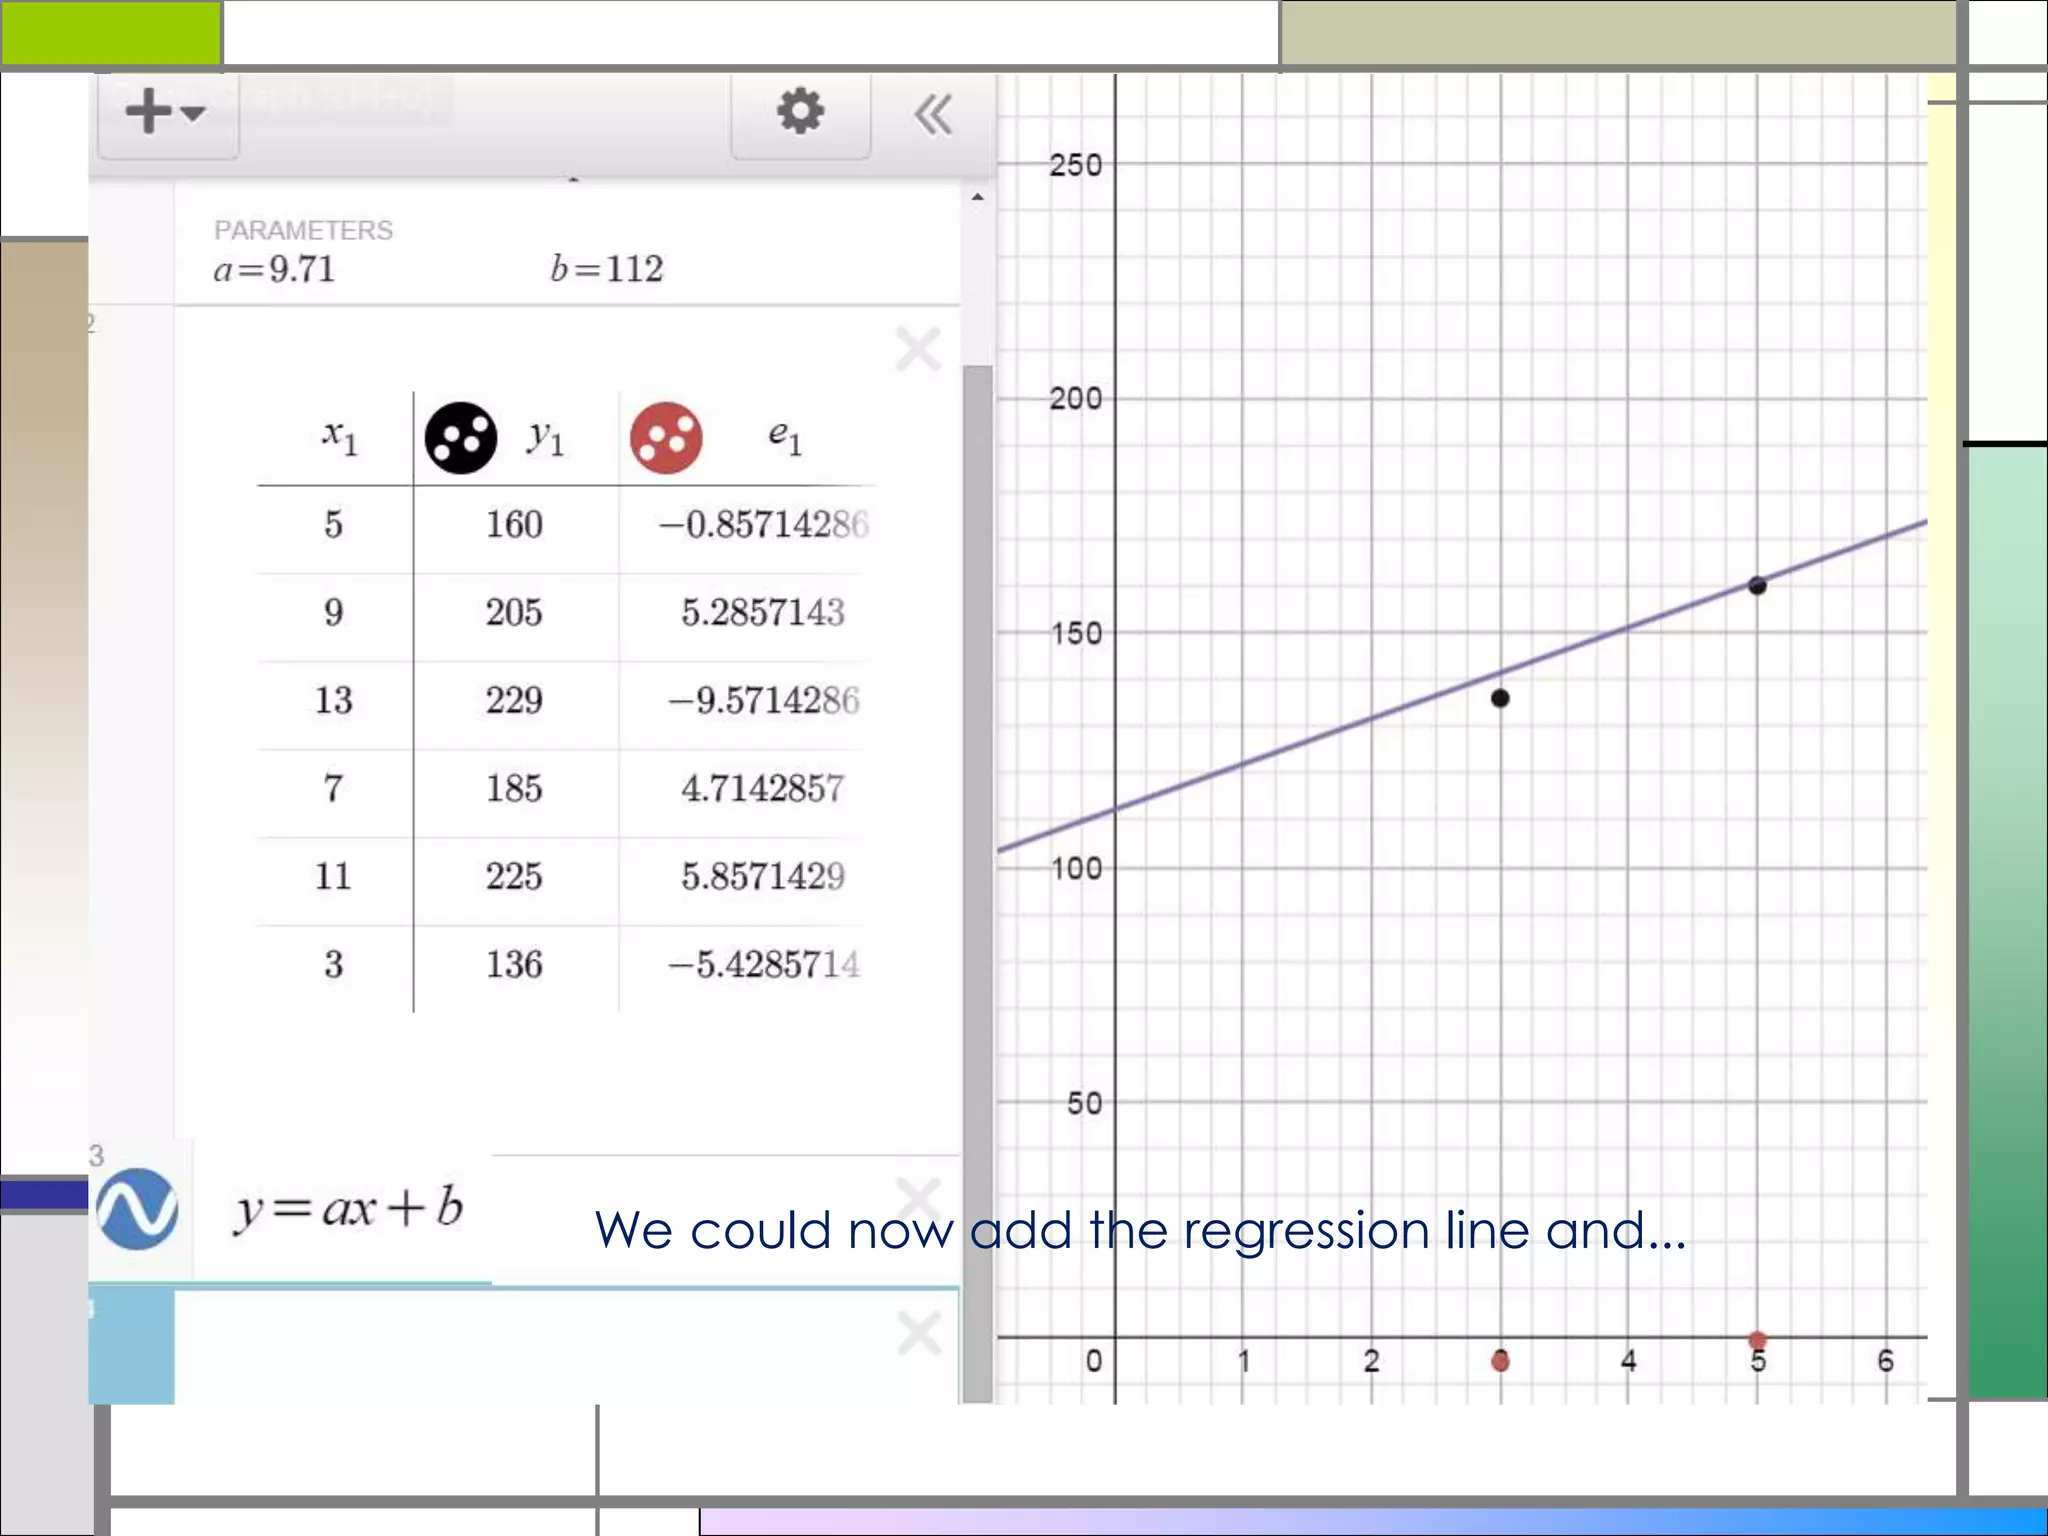
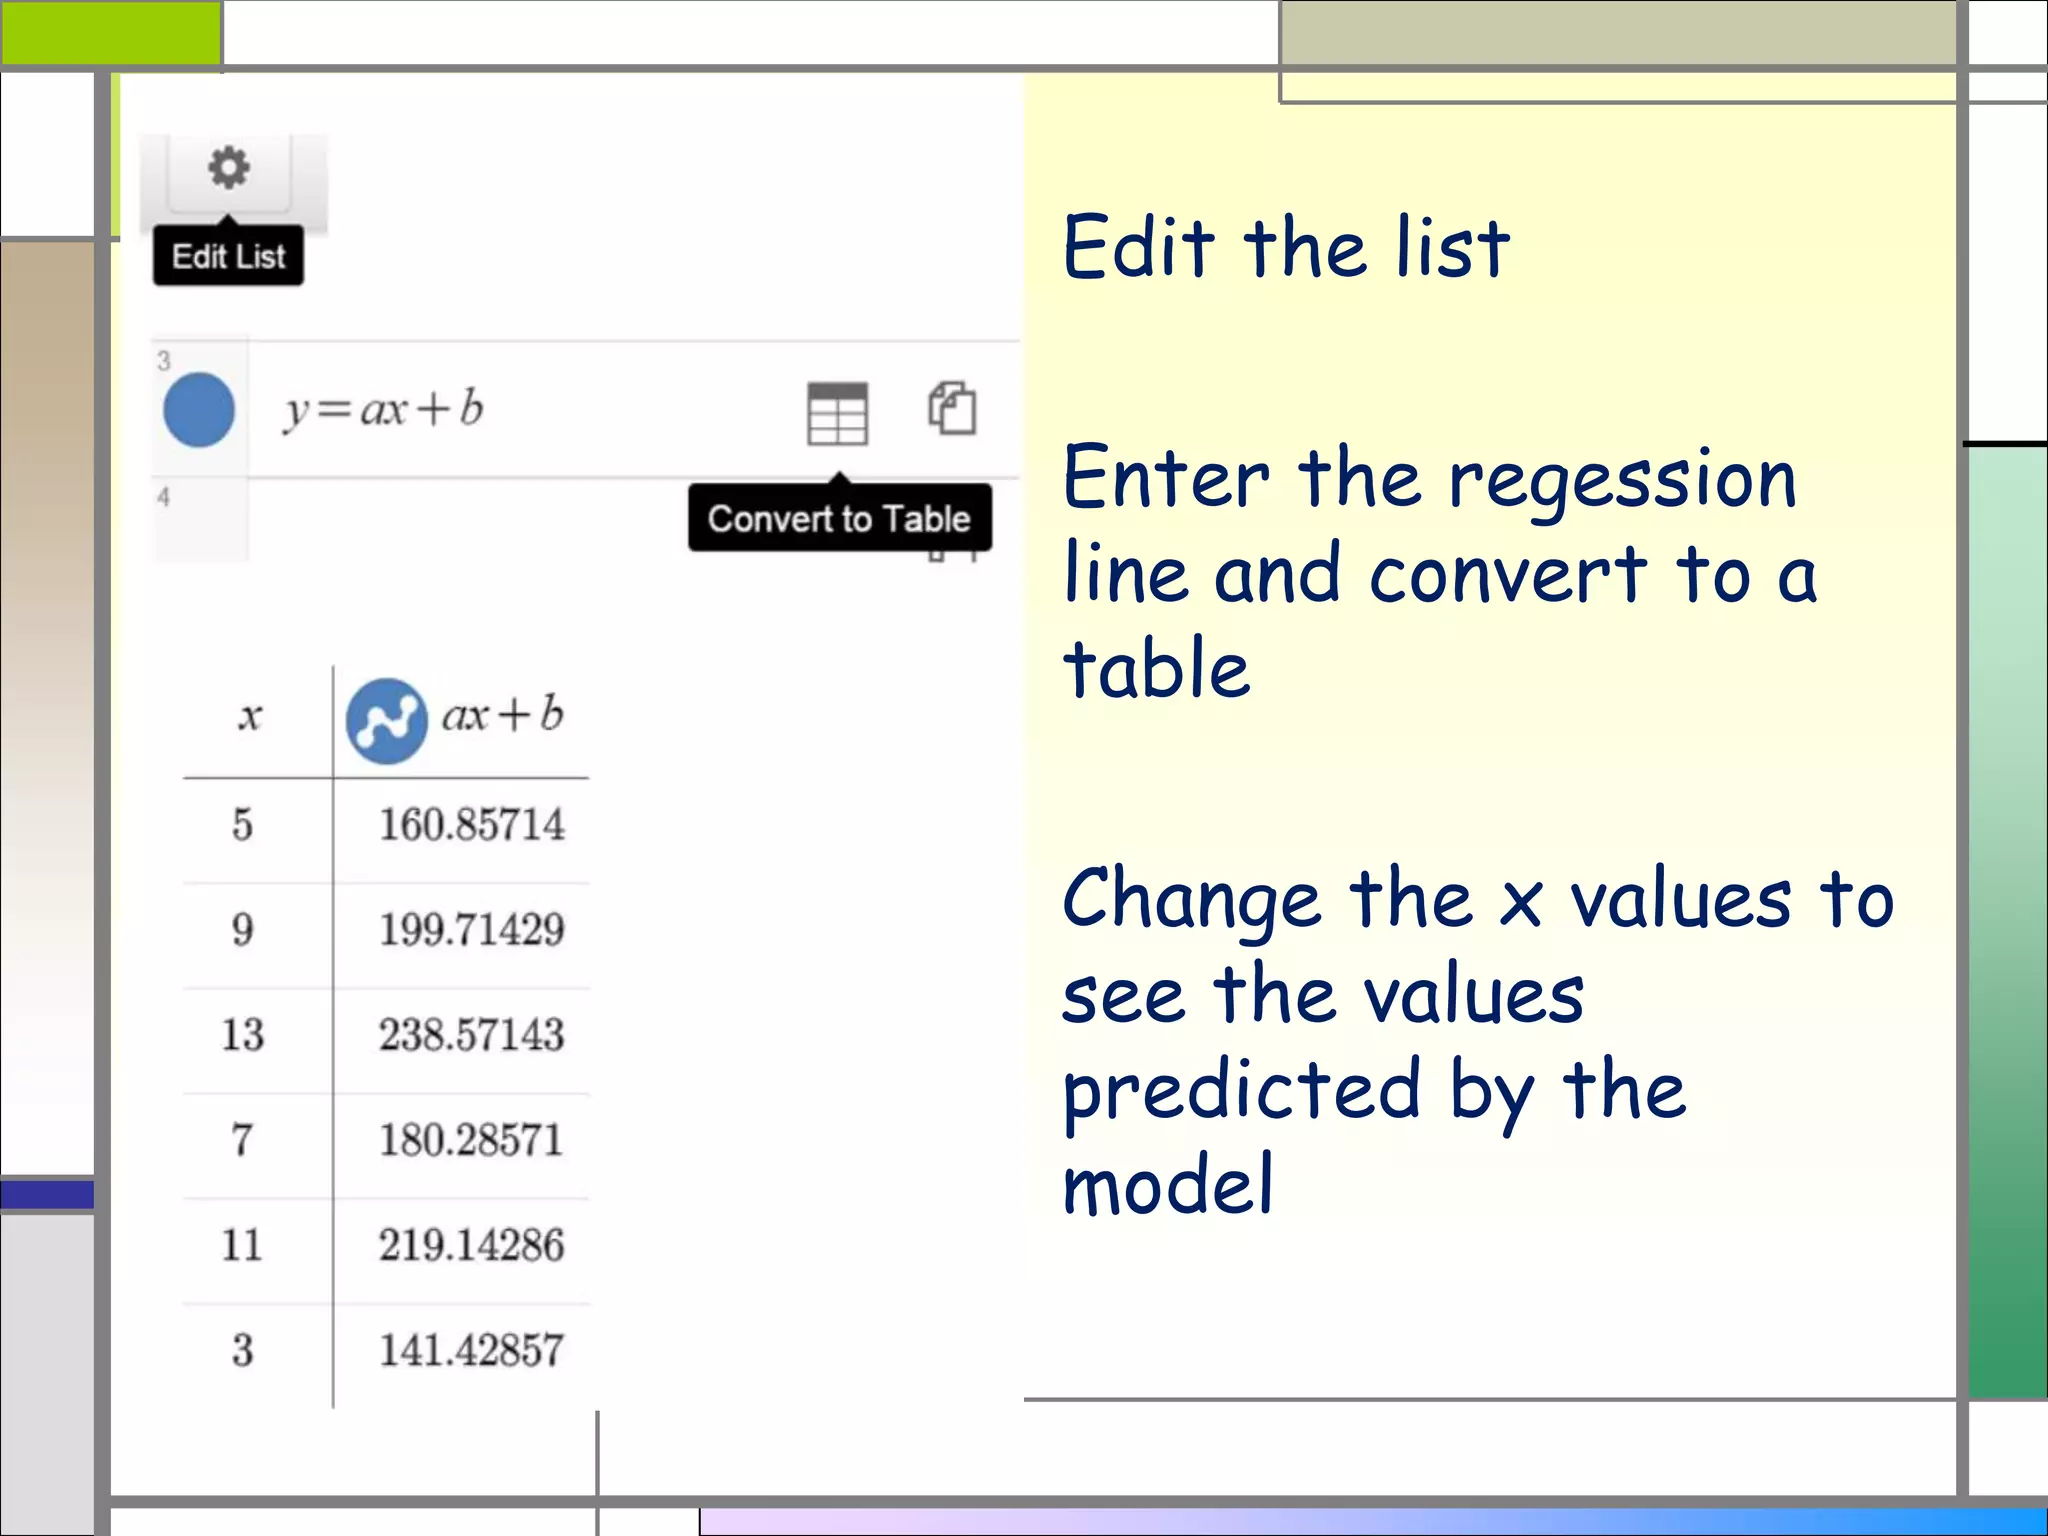
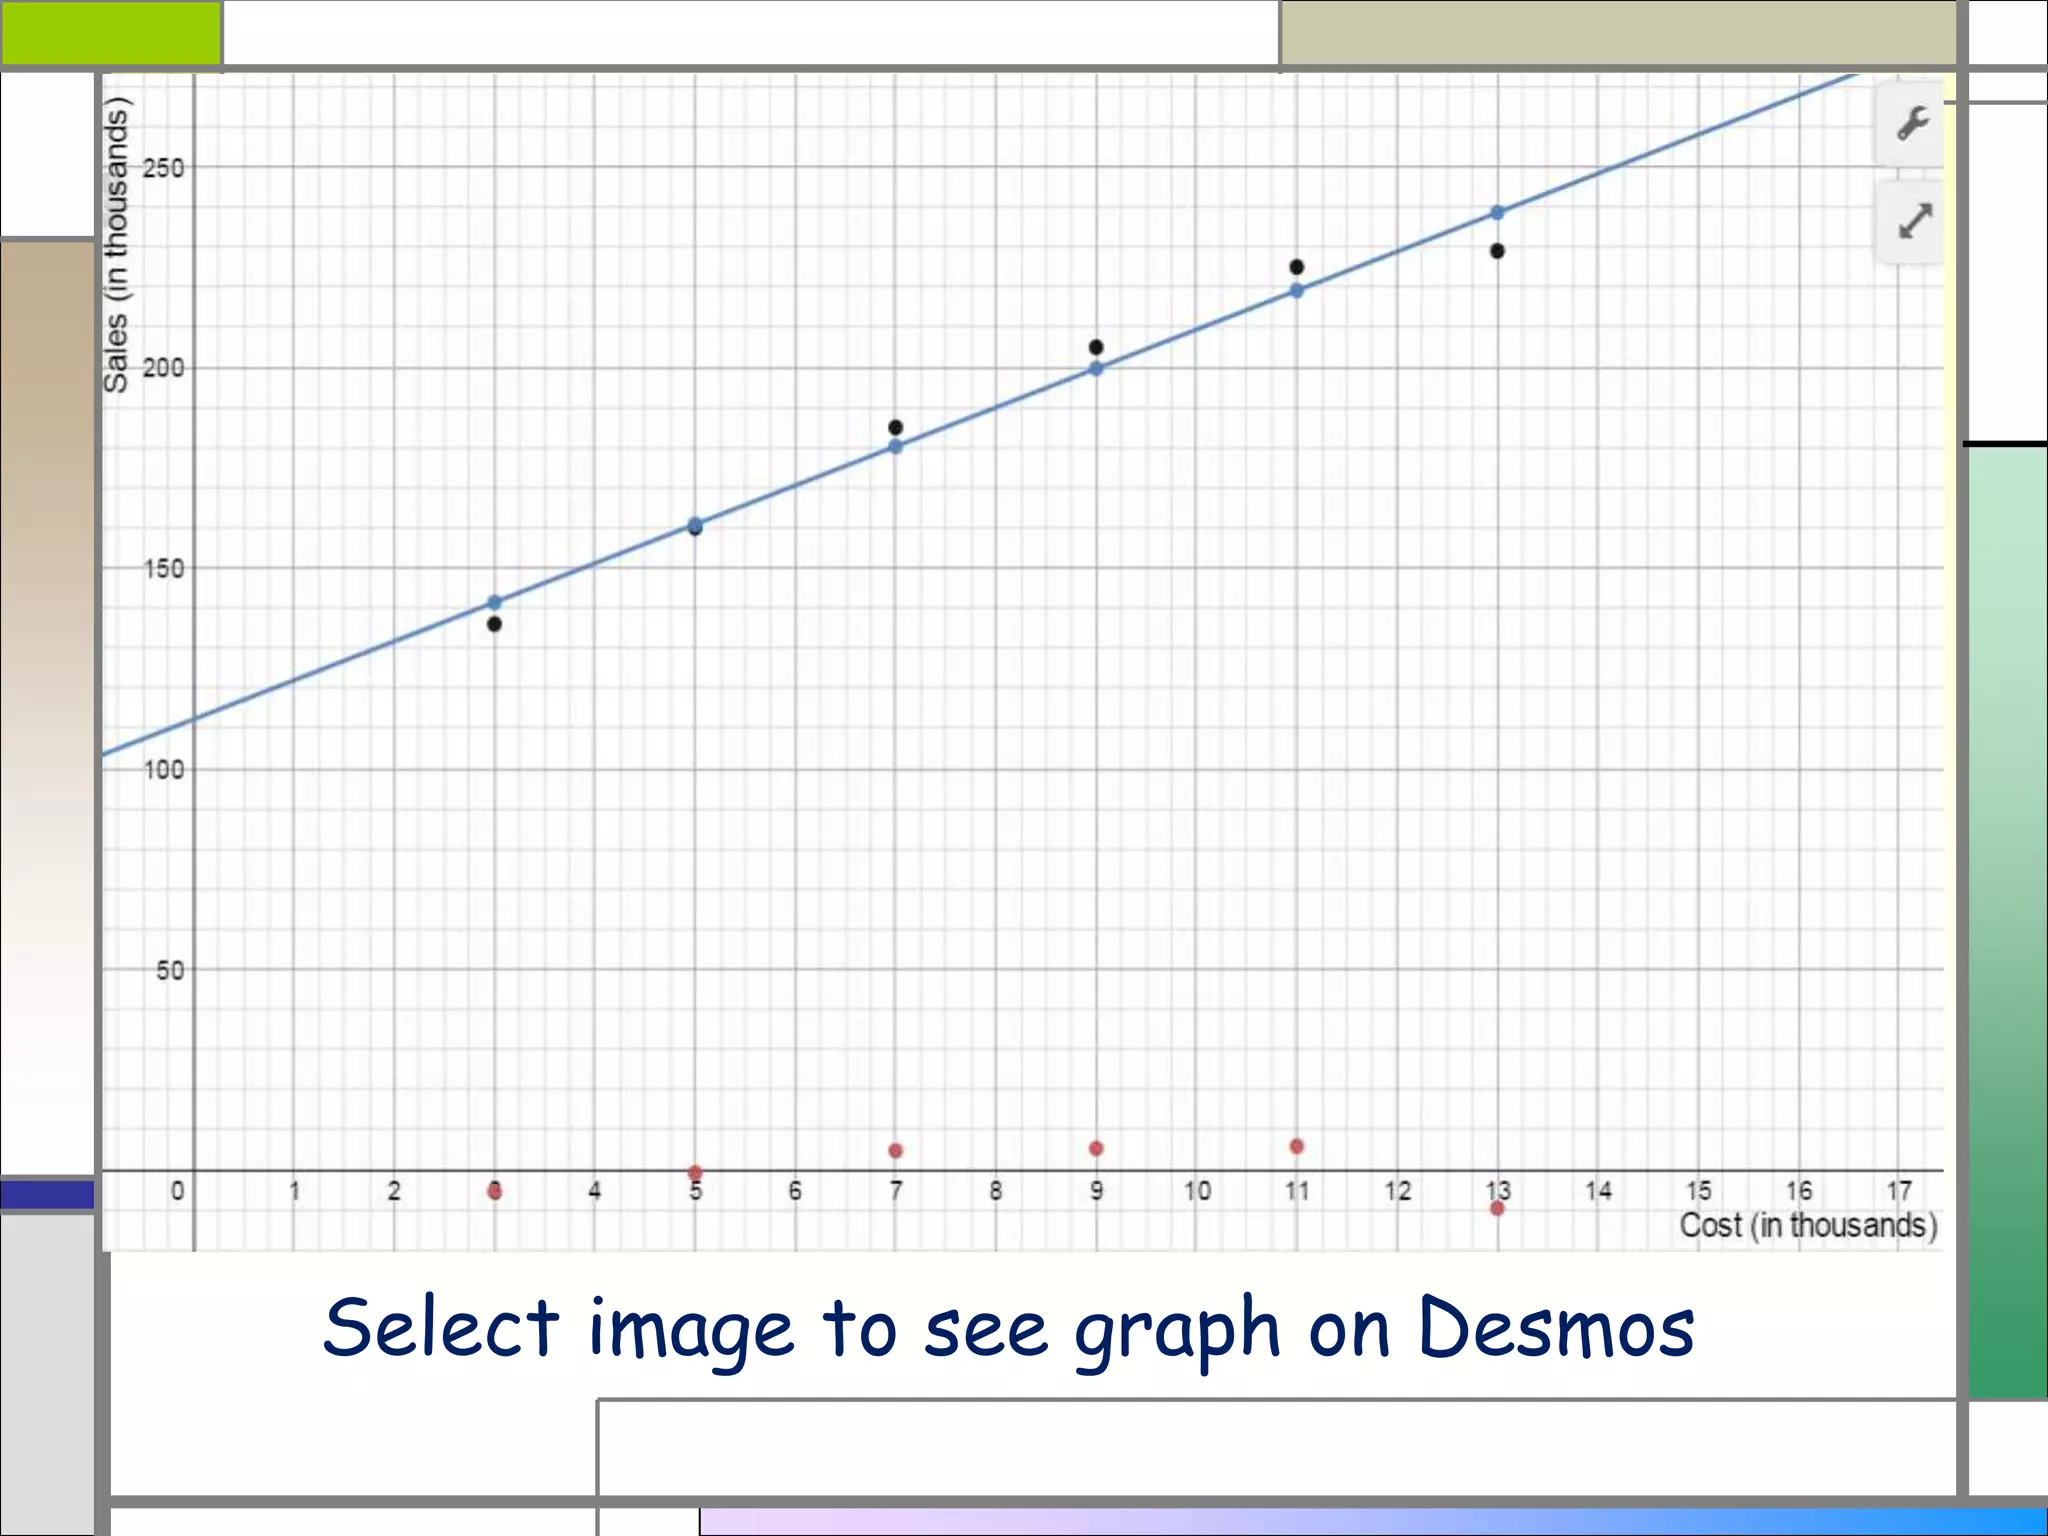


This document discusses using linear regression in Desmos to analyze the relationship between advertising spending (x) and sales (y) for a company. It provides sample advertising spending and sales data for 6 months. It then shows how to enter this data into Desmos, use the regression operator "~" to calculate the linear regression equation, and plot the regression line to visualize the relationship between x and y. The regression line can then be used to predict expected sales for different advertising spending amounts.