Download to read offline
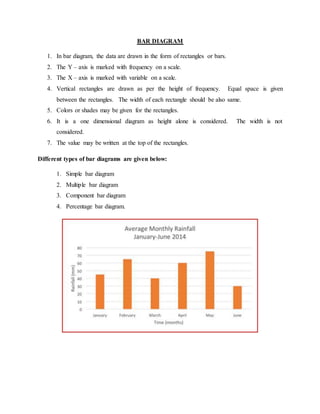
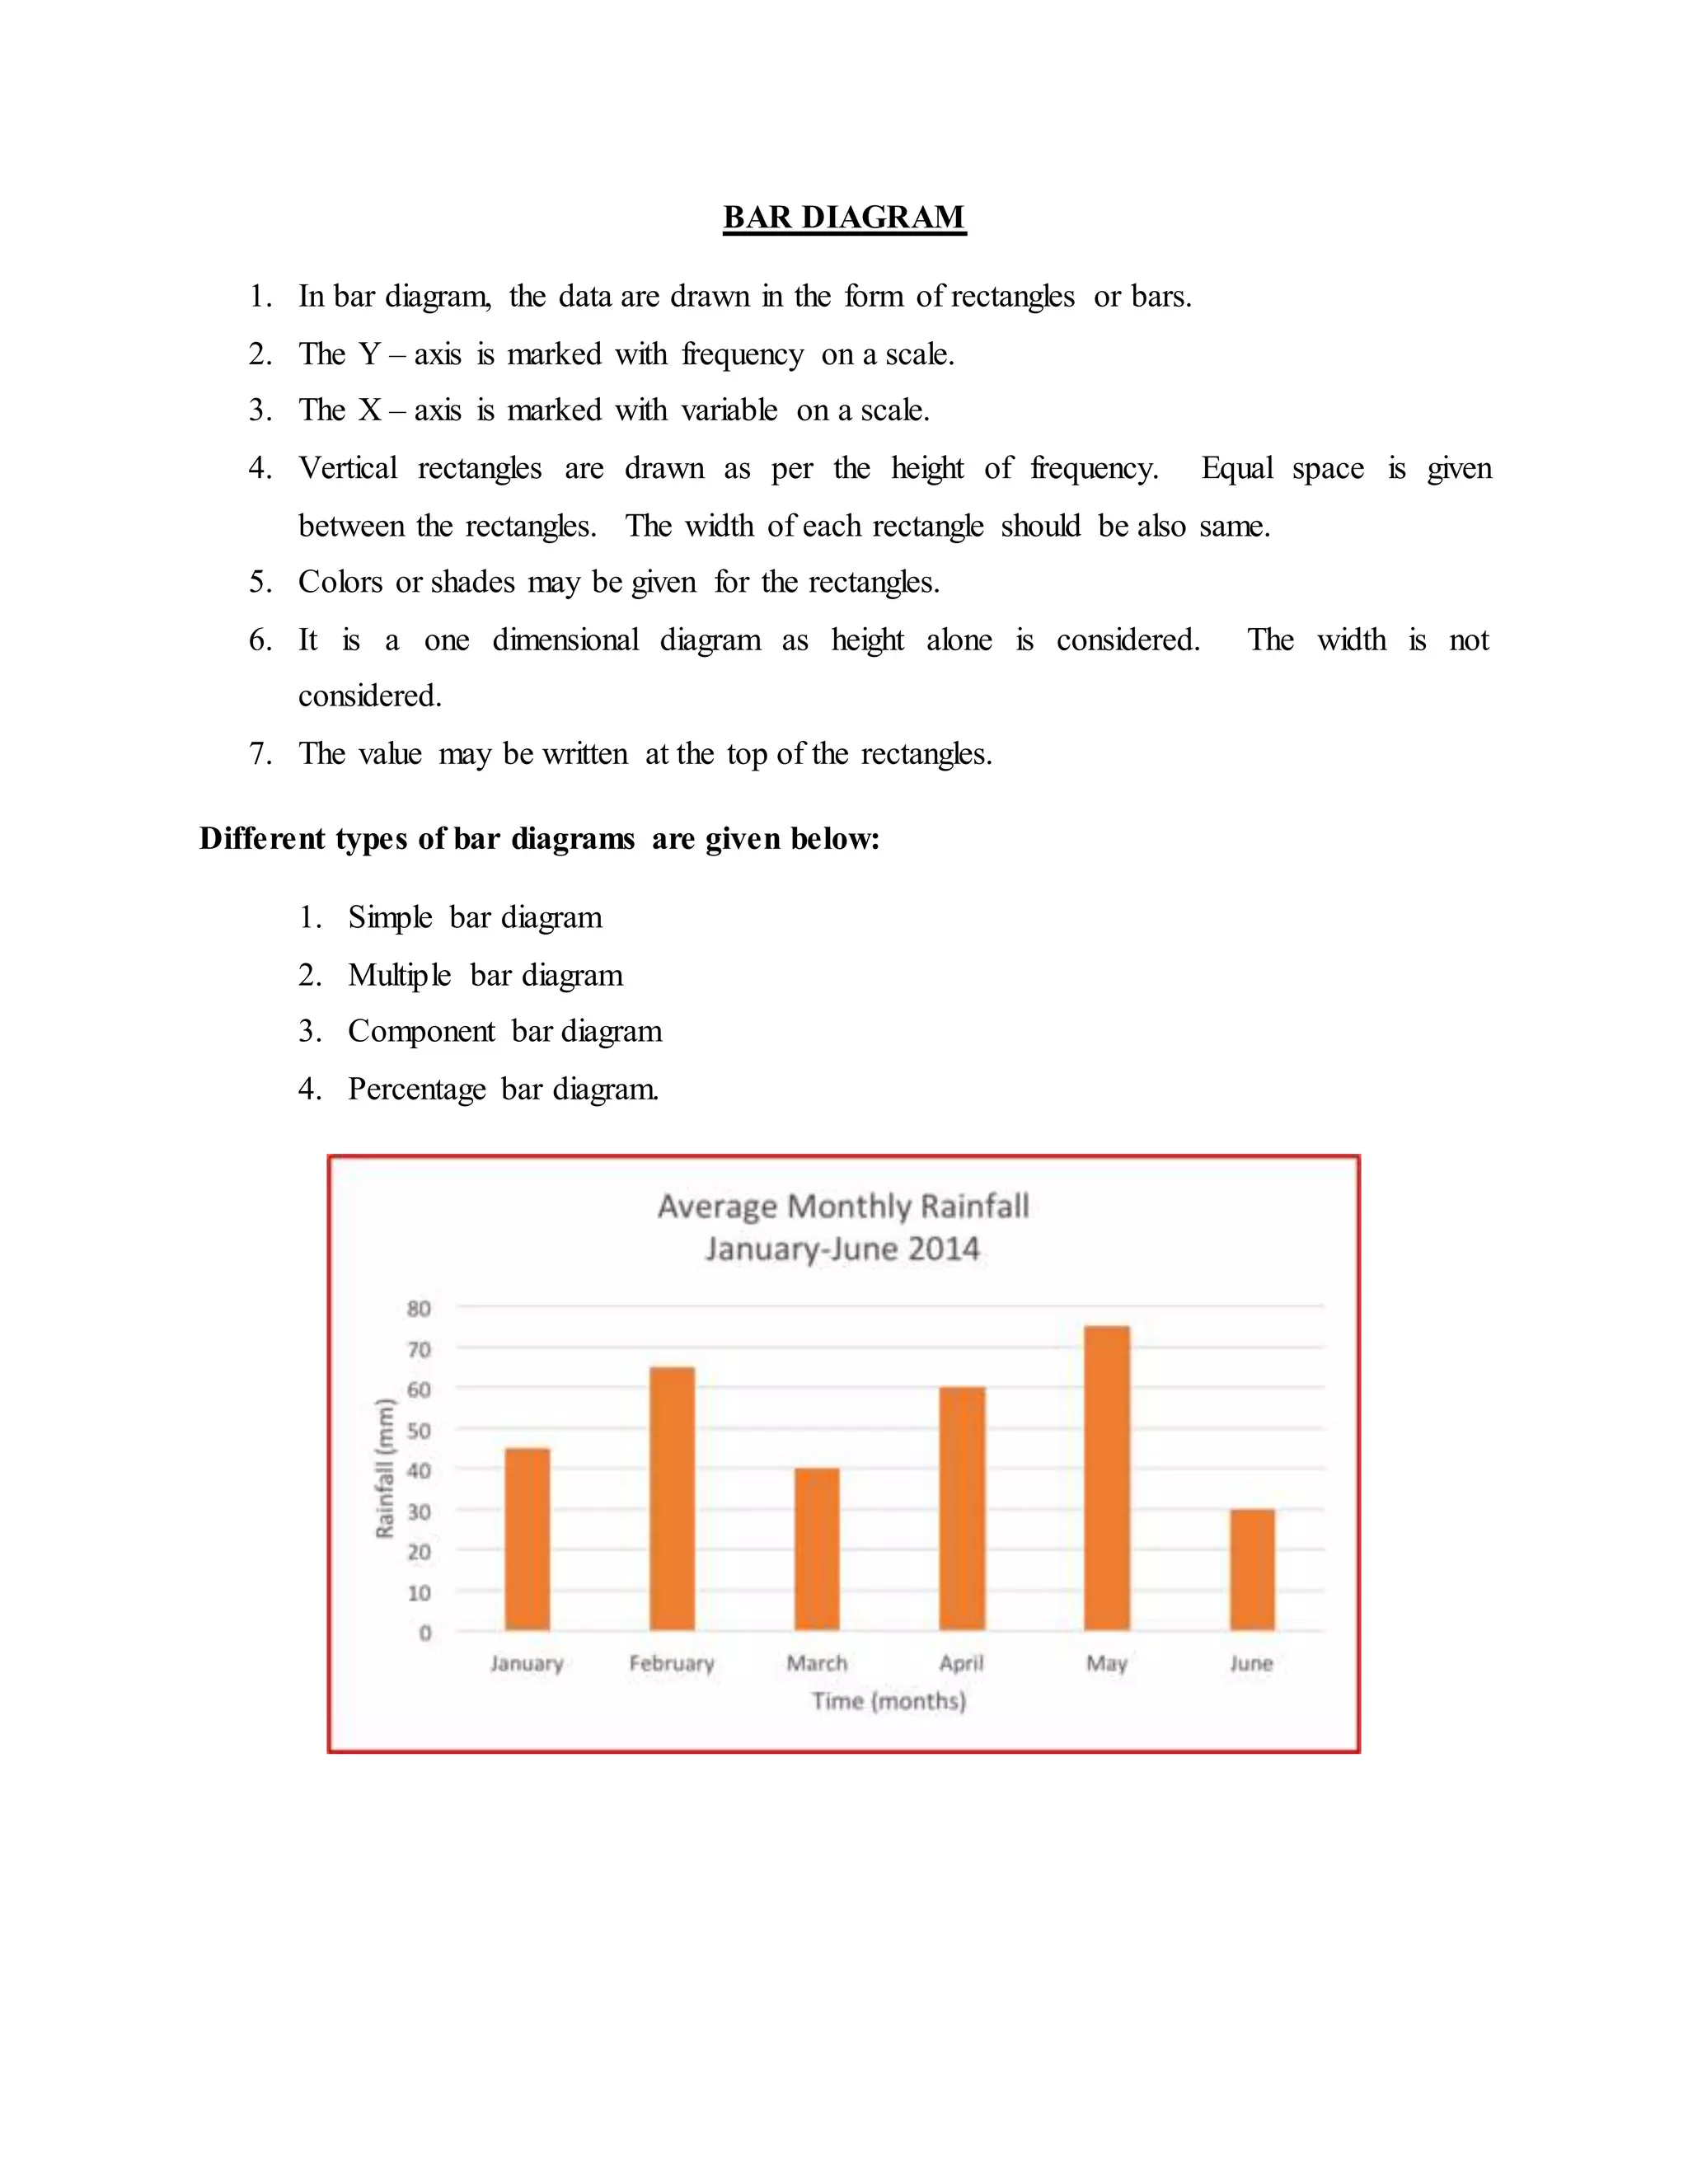

A bar diagram displays data using rectangular bars, with the height of each bar corresponding to the frequency of the variable it represents. The frequency scale is shown on the y-axis and the variables on the x-axis. Each bar is drawn at a uniform width with equal spacing between bars. Bar diagrams can be simple, multiple, component, or percentage based on how many variables are shown.