Downloaded 203 times
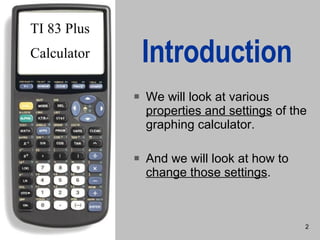


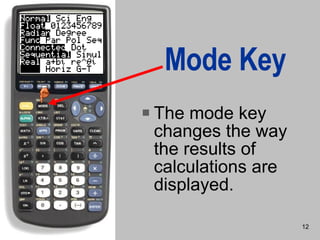

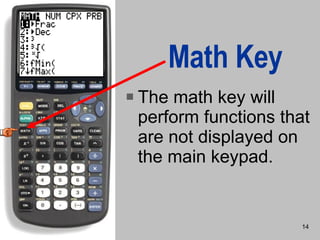
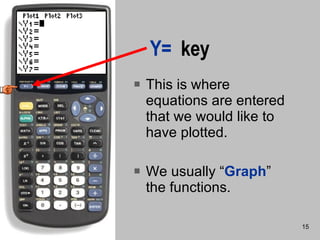
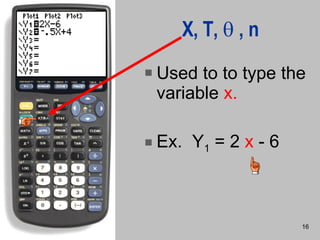
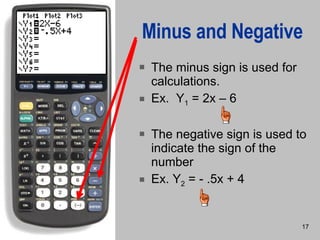
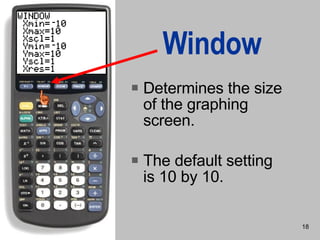

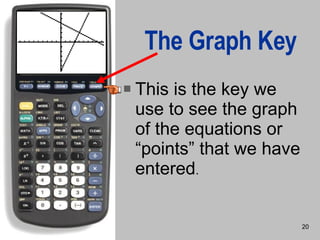
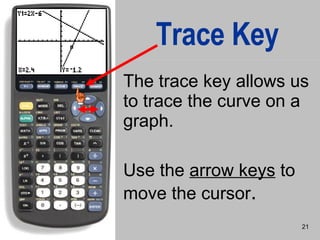


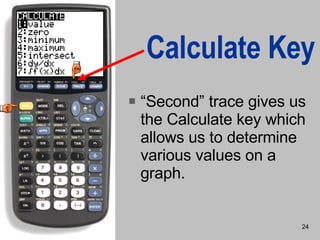


The document provides an introduction to the TI-83 (Plus) graphing calculator, detailing various properties and settings. It explains basic functions such as turning the calculator on/off, using the home screen, entering equations, and graphing functions. Additionally, it covers features like trace, zoom, and stat keys for data analysis and visualization.


![5G Explained! A High Level Overview [Introduction]](https://cdn.slidesharecdn.com/ss_thumbnails/5gexplainedahighleveloverview-260119165306-cc137a3e-thumbnail.jpg?width=640&height=640&fit=bounds)


