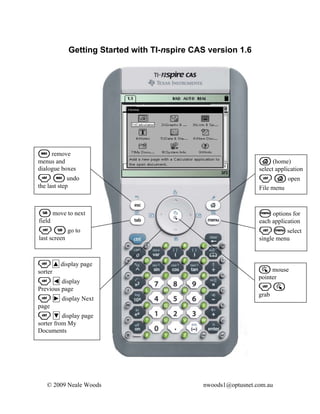
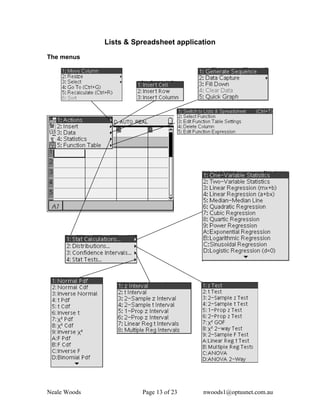
1) The document provides instructions for using the basic features and applications of the TI-nspire CAS calculator, including the calculator, graphing, geometry, lists and spreadsheet, notes, and data analysis applications.
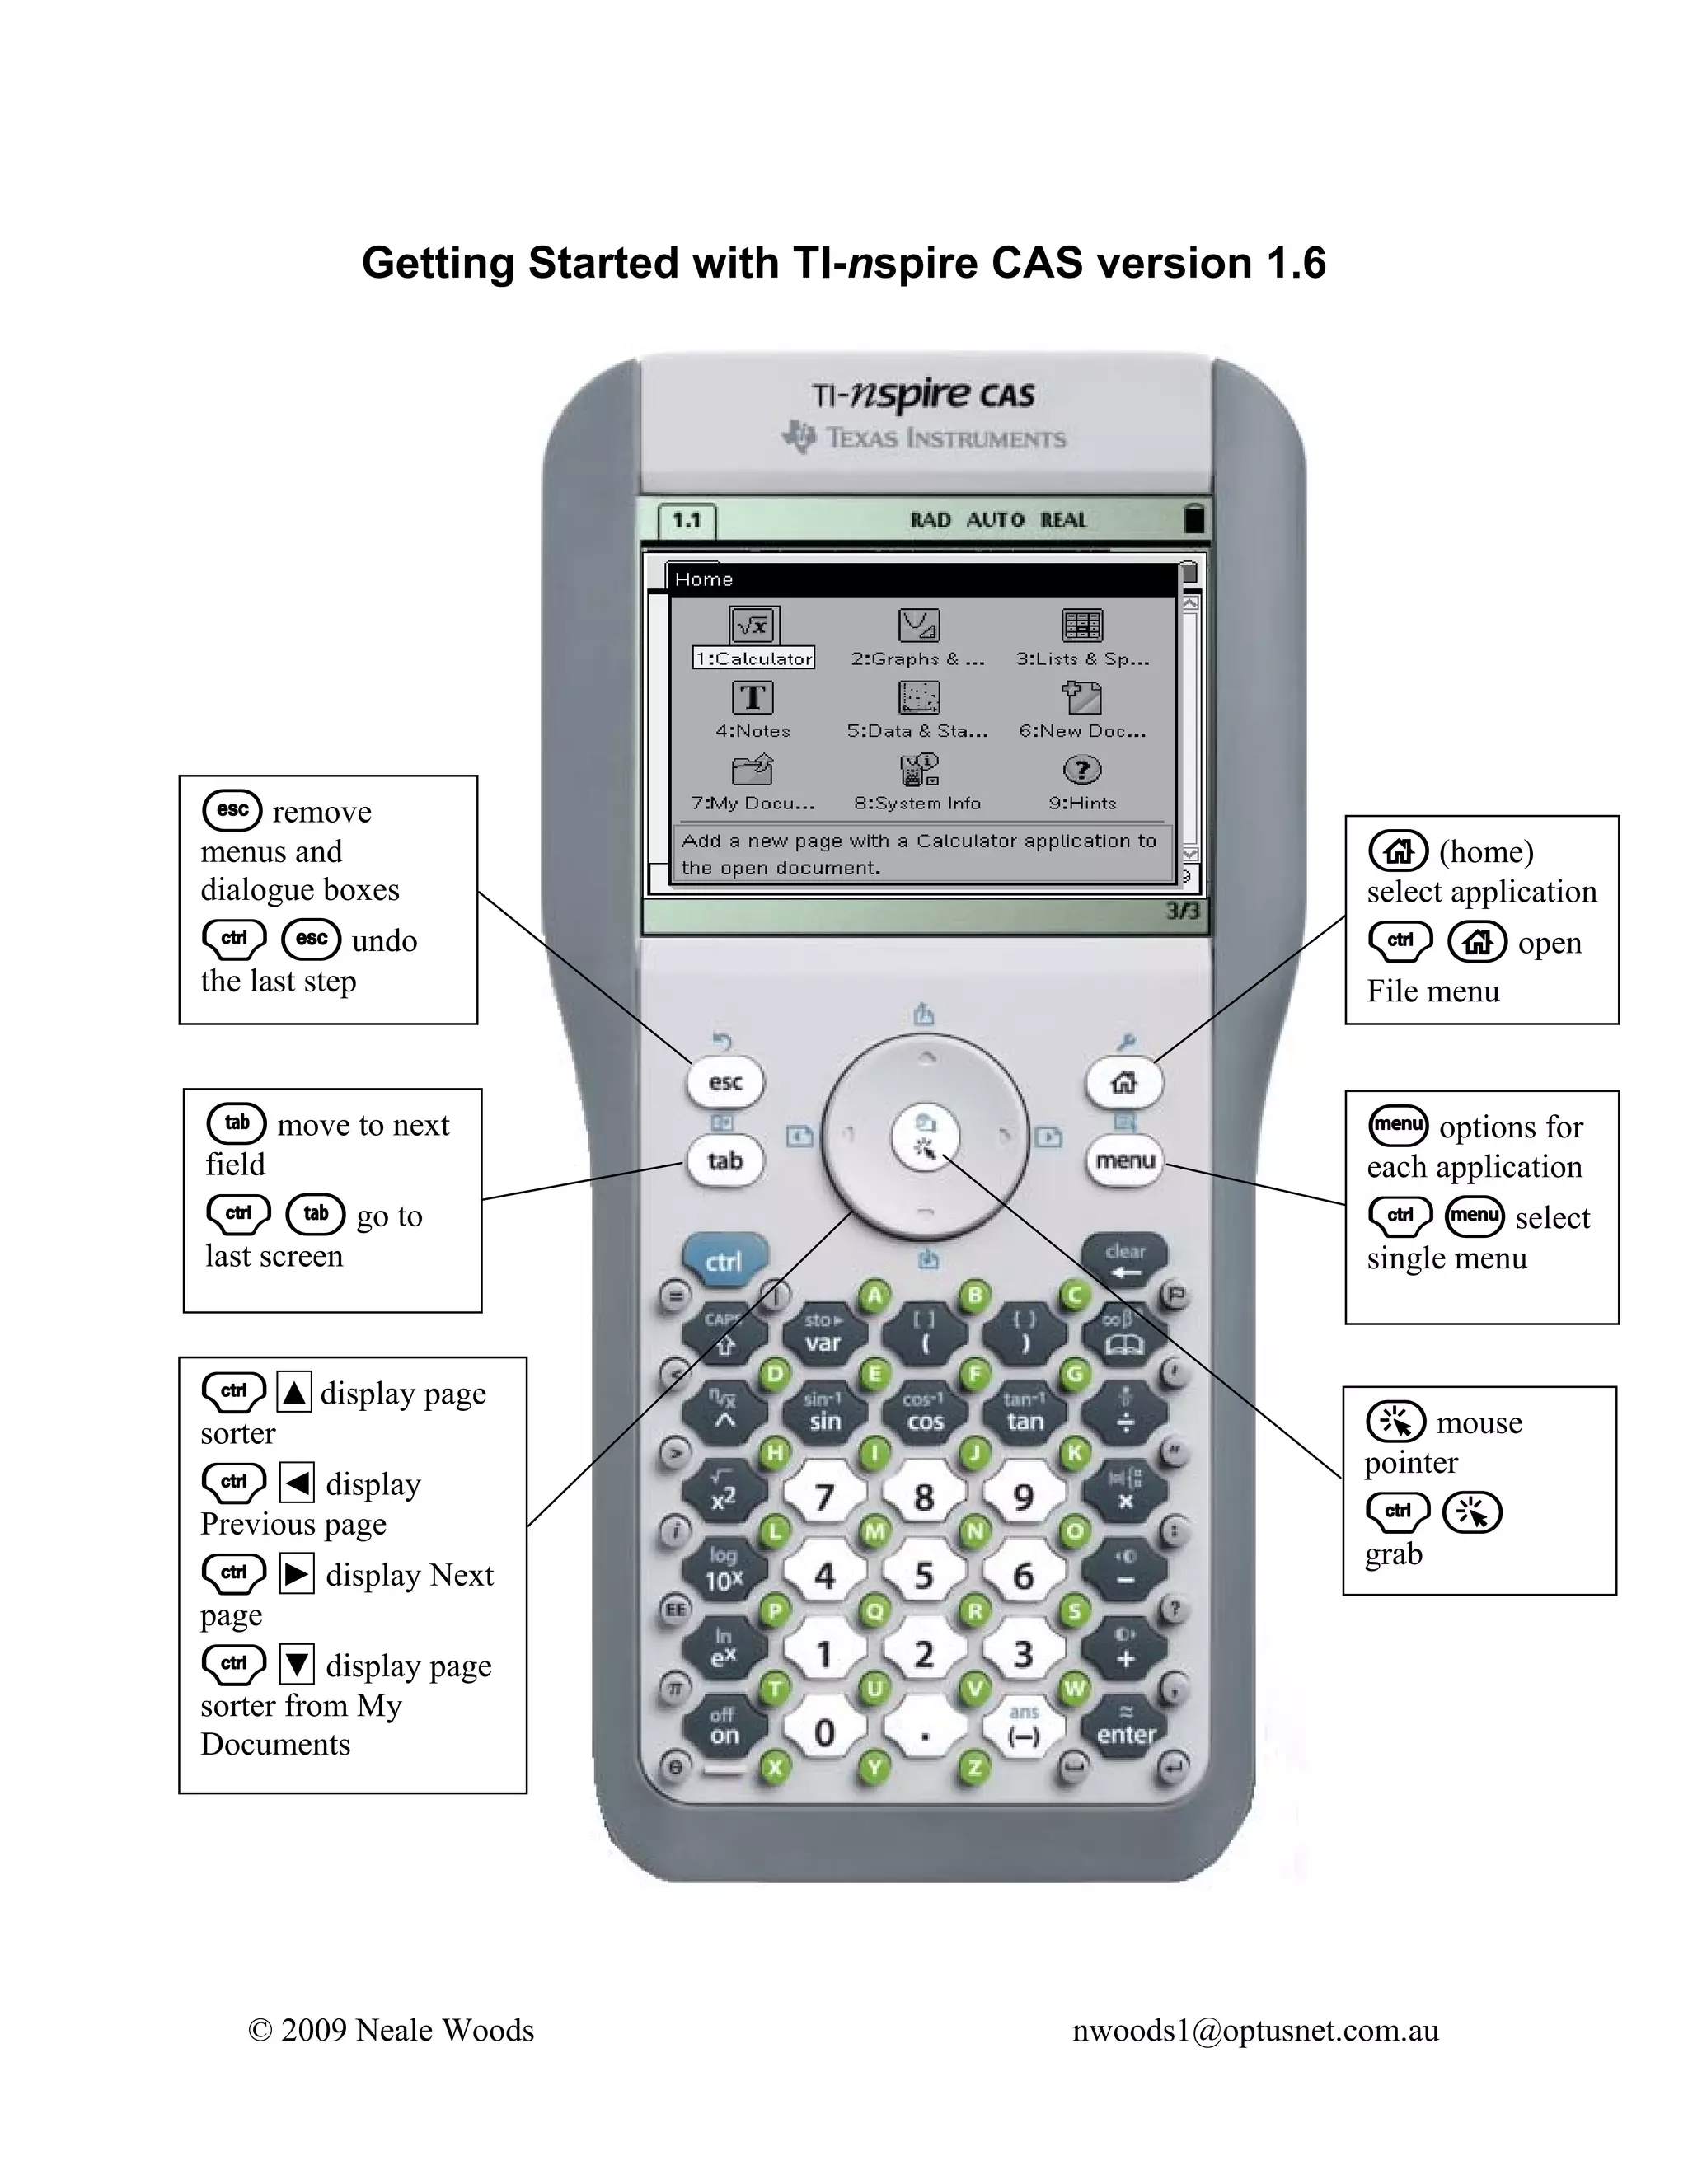
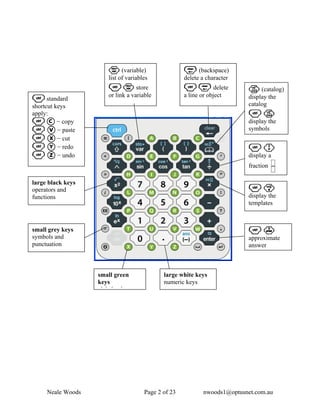
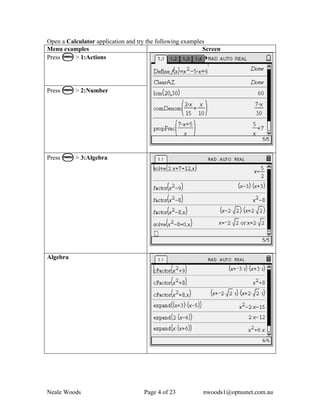
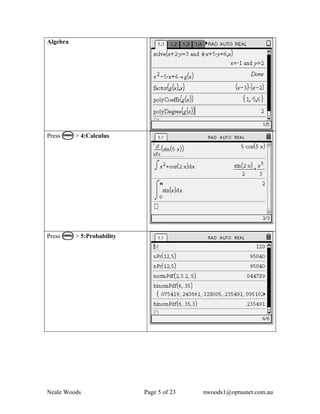
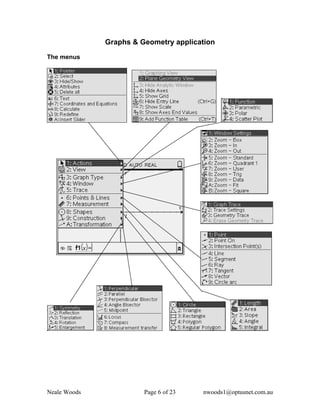
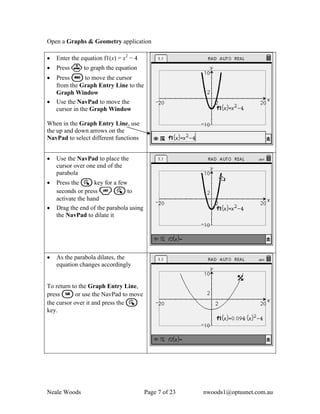
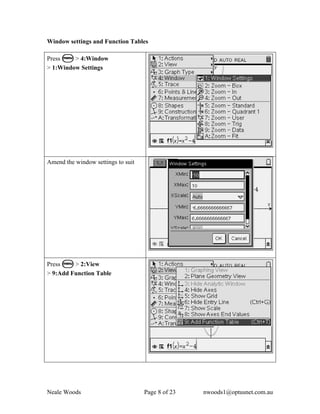
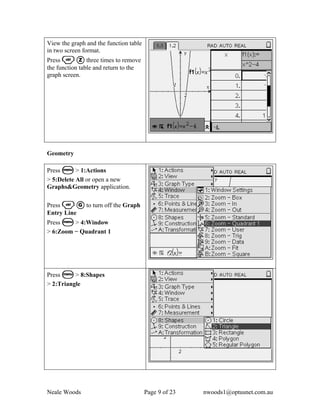
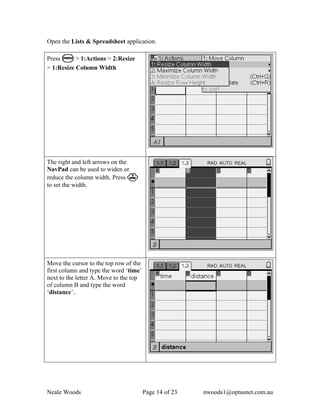
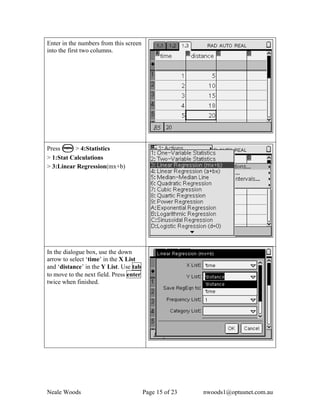
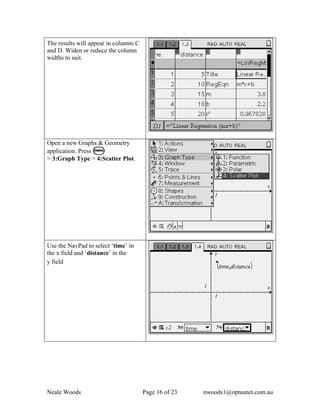
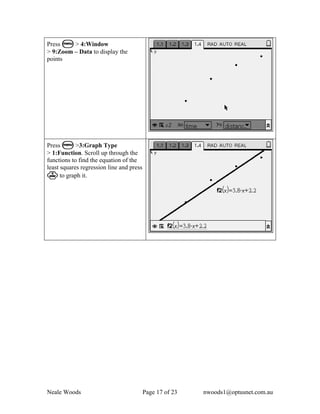
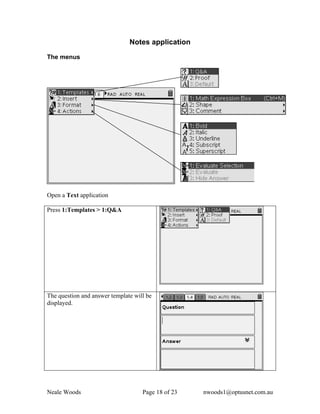
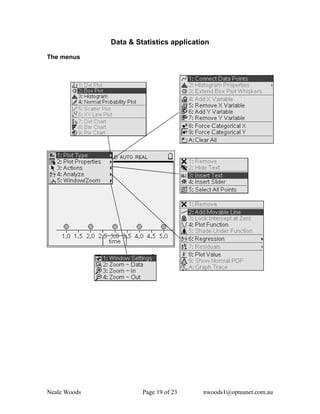
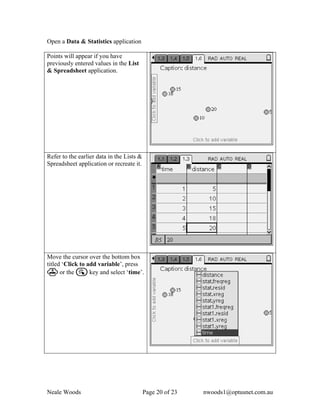
2) Key functions and menus are demonstrated for drawing graphs and shapes, performing calculations and regressions, and moving between applications.
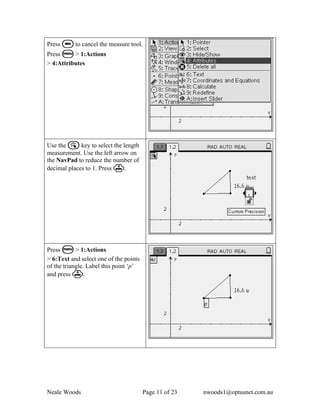
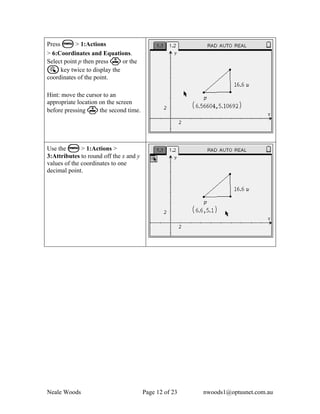
3) Examples show how to enter and manipulate equations, tables, text, and geometric objects, as well as perform statistical analysis and regressions using the built-in data tools.