COVID-19 Update (Summary): August 18, 2020
•Download as PPTX, PDF•
0 likes•52 views

1) This document provides an analysis of COVID-19 cases and projections for various locations around the world. 2) It outlines the models, data sources, and methods used to generate the analysis and projections. 3) The analysis is updated daily and made freely available online, with the goal of understanding the trajectory of the pandemic without a political agenda.

Recommended
Recommended
More Related Content
What's hot
What's hot (20)
Similar to COVID-19 Update (Summary): August 18, 2020
Similar to COVID-19 Update (Summary): August 18, 2020 (11)
More from Steve Shafer
More from Steve Shafer (20)
Recently uploaded
Recently uploaded (20)
COVID-19 Update (Summary): August 18, 2020
- 1. Caveats and Comments 1 Overview: This is my analysis, not Stanford’s. My goal is to understand the trajectory of COVID. It is not confidential and can be freely shared. The R program code is available at https://github.com/StevenLShafer/COVID19/. The daily analysis are available at https://1drv.ms/u/s!AuOyHP_aTIy7rowrt2AjGpWm_frnEQ?e=KBcNbh. You are welcome to use the R code on GitHub for any purpose. I am attempting to keep the analysis and commentary apolitical. I am now including partisan lean as a metric to help understand the epidemic. I occasionally point out misrepresentations by government officials. I occasionally point out where government recommendations have placed Americans at increasing risk. I try to provide a daily update in the morning, except Sundays. My analysis my be delayed by my clinical responsibilities as a Stanford anesthesiologist. There is a lot of information on the figures. If something isn’t clear, please see the explanation on slide 2. Data sources: • USA Case Data: https://github.com/CSSEGISandData/COVID-19/raw/master/csse_covid_19_data/csse_covid_19_time_series/time_series_covid19_confirmed_US.csv • USA Death Data: https://github.com/CSSEGISandData/COVID-19/raw/master/csse_covid_19_data/csse_covid_19_time_series/time_series_covid19_deaths_US.csv • USA Testing and Hospitalization Data: https://raw.githubusercontent.com/COVID19Tracking/covid-tracking-data/master/data/states_daily_4pm_et.csv • Global Case Data: https://github.com/CSSEGISandData/COVID-19/raw/master/csse_covid_19_data/csse_covid_19_time_series/time_series_covid19_confirmed_global.csv • Global Death Data: https://github.com/CSSEGISandData/COVID-19/raw/master/csse_covid_19_data/csse_covid_19_time_series/time_series_covid19_deaths_global.csv • Global Testing Data: https://raw.githubusercontent.com/owid/covid-19-data/master/public/data/owid-covid-data.csv • Mobility Data: https://www.gstatic.com/covid19/mobility/Global_Mobility_Report.csv • Partisan Lean: MIT Election Data and Science Lab: https://doi.org/10.7910/DVN/VOQCHQ/HEIJCQ • Ensemble Model: https://github.com/reichlab/covid19-forecast-hub/raw/master/data-processed/COVIDhub-ensemble/2020-xx-xx-COVIDhub-ensemble.csv Models: 1. Future projections of case numbers are based on the Gompertz function (https://en.wikipedia.org/wiki/Gompertz_function): log 𝑐𝑢𝑚𝑢𝑙𝑎𝑡𝑖𝑣𝑒 𝑐𝑎𝑠𝑒𝑠 = 𝑐𝑢𝑟𝑟𝑒𝑛𝑡 𝑐𝑎𝑠𝑒𝑠 + 𝑚𝑎𝑥𝑖𝑚𝑢𝑚 𝑐𝑎𝑠𝑒𝑠 − 𝑐𝑢𝑟𝑟𝑒𝑛𝑡 𝑐𝑎𝑠𝑒𝑠 1 − 𝑒−𝑘 𝑡 . This is a naïve asymptotic model. k is the rate constant, such that log(2) / k = time to 50% rise. t is the number of days. Wikipedia The Gompertz function is estimated from the last 3 weeks of data for cumulative cases (red dots in the figures). Deaths are predicted from a log linear regression of deaths over the past 21 days. For the US, and individual states, I am also including the 98% prediction interval from the COVID-19 Forecast Hub (https://covid19forecasthub.org/). 2. The rate of change in daily cases and deaths is the slope of delta cases / day over the last 14 days, divided by the average number of cases. Locations The locations for the modeling are where Pamela and I have family and friends, locations of interest to friends and colleagues, or countries in the news (e.g., China, South Korea, Sweden, Brazil) or with significant economic impact on the United States (e.g., Japan, Canada, Mexico). Locations are easy to add. Stay safe, well, resilient, and kind. Steve Shafer steven.shafer@Stanford.edu
- 2. 2,586,092 152,804 1 10 100 1,000 10,000 100,000 1,000,000 10,000,000 100,000,000 Actual(points)/Predicted(line) Phase Pre-Model Modeled Deaths Tests USA projection as of 2020-05-27 0 10,000 20,000 30,000 0 2,000 4,000 6,000 Cases/Day Deaths/Day Cases: 1,662,302 (32,123) -- Deaths: 98,220 (829) -- Case Mortality: 5.9% -- Daily Change in Cases: -0.5% Explanation of the Figures 2 Brown dots: cumulative tests Red dots: cumulative cases used to estimate Gompertz function, presently set to last 3 weeks Red line: predicted cumulative cases based on the Gompertz function estimated from the red dots Red number: total cases on June 30th, based on the Gompertz function estimated from the red dots Black number: total Deaths on July 31th, based on log-linear regression of the past 21 days Black line: predicted cumulative deaths, based on a log linear regression of deaths over past 21 days. Axis for deaths / day, usually 1/10th of the axis for cases / day on the left side of the figure. Green line: linear regression over 8 days, used to calculate percent increase / decrease (see below) Daily change in cases, calculated as the slope of the green line (above left) / number of new cases yesterday. Case mortality: cumulative deaths / cumulative cases. Cases / day calculated from cumulative cases used to estimate the Gompertz function Cases / day calculated from cumulative cases not used to estimate the Gompertz function Deaths / day, axis is on the left Blue line: today Blue dots: cumulative cases not used to estimate Gompertz function Cumulative cases (yesterday’s cases) and cumulative deaths (yesterday’s deaths) Axis for cases / day. Axis for deaths / day appears to the right. Geographic location Date of analysis, also shown as blue vertical line below Purple wedge: 98% ensemble prediction interval from COVID-19 Forecast Hub (USA and US States only)
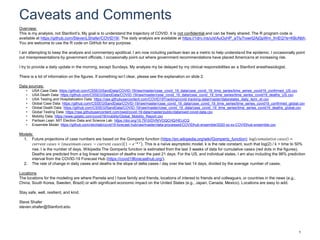
- 3. Worldwide 25,966,208 879,203 1 10 100 1,000 10,000 100,000 1,000,000 10,000,000 100,000,000 Actual(points)/Predicted(line) Phase Pre-Model Modeled Deaths Worldwide projection as of 2020-08-18 0 100,000 200,000 300,000 0 5,000 10,000 15,000 Cases/Day Deaths/Day Cases: 21,871,665 (209,595) -- Deaths: 773,917 (4,125) -- Case Mortality: 3.5% -- Daily Change: -0.8% Cases, +0.3% Deaths 2020-08-18 Summary: 3
- 4. USA 6,280,977 188,574 1 10 100 1,000 10,000 100,000 1,000,000 10,000,000 100,000,000 Actual(points)/Predicted(line) Phase Pre-Model Modeled Deaths Tests USA projection as of 2020-08-18 Mother'sDay MemorialDay July4th July15,2020 0 20,000 40,000 60,000 0 1,000 2,000 3,000 Cases/Day Deaths/Day Cases: 5,438,325 (35,112) -- Deaths: 170,497 (445) -- Case Mortality: 3.1% -- Daily Change: -1.8% Cases, -1.0% Deaths 2020-08-18 Summary: 4
- 5. Japan, South Korea, Thailand, Vietnam 91,725 1,602 1 10 100 1,000 10,000 100,000 1,000,000 10,000,000 100,000,000 Actual(points)/Predicted(line) Phase Pre-Model Modeled Deaths Tests Japan, South Korea, Thailand, Vietnam projection as of 2020-08-18 0 500 1,000 1,500 2,000 0 25 50 75 100 Cases/Day Deaths/Day Cases: 76,839 (908) -- Deaths: 1,501 (11) -- Case Mortality: 2.0% -- Daily Change: -1.7% Cases, +4.7% Deaths 2020-08-18 Summary: 5
- 6. Western Europe 1,742,937 164,285 1 10 100 1,000 10,000 100,000 1,000,000 10,000,000 100,000,000 Actual(points)/Predicted(line) Phase Pre-Model Modeled Deaths Tests Western Europe projection as of 2020-08-18 0 20,000 40,000 60,000 80,000 0 1,000 2,000 3,000 4,000 Cases/Day Deaths/Day Cases: 1,630,053 (23,584) -- Deaths: 163,441 (70) -- Case Mortality: 10.0% -- Daily Change: +3.9% Cases, +4.7% Deaths 2020-08-18 Summary: 6
- 7. Worldwide cases USA BRA IND RUS ZAF PER MEX COL CHL ESP IRN GBR SAU ARG PAK BGD FRA ITA TUR DEU IRQ PHL IDN CAN KAZ ECU BOL EGY UKR ISR CHN DOM SWE BEL ROU BLR NLD GTM POL JPN PRT HND NGA MAR GHA KGZ DZA CHE AFG UZB VEN AZE ETH KEN SRB NPL AUS AUT SLV CZE CMR CIV DNK KOR BGR USA 0 2,000,000 4,000,000 6,000,000 1 6 11 16 21 26 31 36 41 46 51 56 61 66 Rank Totalcasestodate Worldwide cases Excludes countries with population < 5,000,000 2020-08-18 Summary: 7
- 8. Worldwide cases CHL PER USA BRA ISR ZAF SAU COL BOL SWE DOM ESP KGZ ARG BEL BLR ECU KAZ RUS HND IRQ SRB GBR PRT IRN CHE GTM MEX ITA FRA AZE NLD CAN TUR SLV ROU DNK AUT DEU IND UKR BGR CZE GHA BGD PHL PAK POL FIN PRY LBY AFG VEN UZB MAR EGY DZA AUS CMR NPL SEN HTI GIN CIV ZMB USA None 1 in 200 1 in 100 1 in 67 1 in 50 1 in 40 1 6 11 16 21 26 31 36 41 46 51 56 61 66 Rank Totalcasestodate Worldwide cases Excludes countries with population < 5,000,000 2020-08-18 Summary: 8
- 9. Average new cases over past 7 days PER COL BRA ISR ARG USA BOL ESP IRQ CHL DOM ZAF ECU LBY GTM PRY HND ROU IND MEX BEL SAU SLV KGZ PHL FRA NLD VEN SRB SWE MAR RUS IRN UKR KAZ DNK CHE UZB AUT CZE PRT BGR NPL GRC ZMB GBR POL BGD TUR DEU DZA AUS KEN ETH AZE CAN SEN BLR GHA GIN IDN ITA JPN SVK ZWE USA None 1 in 20,000 1 in 10,000 1 in 6,667 1 in 5,000 1 in 4,000 1 in 3,333 1 6 11 16 21 26 31 36 41 46 51 56 61 66 Rank Averagecases/day Average new cases over past 7 days Excludes countries with population < 5,000,000 2020-08-18 Summary: 9
- 10. Worldwide deaths USA BRA MEX IND GBR ITA FRA ESP PER IRN RUS COL ZAF CHL BEL DEU CAN IDN NLD PAK ECU TUR IRQ ARG SWE EGY CHN BOL BGD SAU ROU PHL GTM UKR CHE POL PRT HND KGZ DOM DZA AFG KAZ JPN NGA SDN AUT ISR MAR SRB DNK SLV BLR HUN ETH YEM BGR AZE KEN AUS CMR CZE FIN KOR VEN USA 0 50,000 100,000 150,000 1 6 11 16 21 26 31 36 41 46 51 56 61 66 Rank Totaldeathstodate Worldwide deaths Excludes countries with population < 5,000,000 2020-08-18 Summary: 10
- 11. Worldwide deaths BEL PER GBR ESP SWE CHL ITA BRA USA MEX FRA BOL ECU NLD COL IRN KGZ CAN CHE ZAF HND IRQ GTM PRT DOM ARG ROU SRB SAU DNK DEU RUS ISR AUT SLV KAZ TUR BGR BLR FIN EGY AZE HUN POL AFG UKR IND DZA CZE PAK SDN PHL IDN LBY BGD YEM ZMB NIC HTI GRC CMR PRY AUS MAR SEN USA None 1 in 5,000 1 in 2,500 1 in 1,667 1 in 1,250 1 in 1,000 1 6 11 16 21 26 31 36 41 46 51 56 61 66 Rank Totaldeathstodate Worldwide deaths Excludes countries with population < 5,000,000 2020-08-18 Summary: 11
- 12. Average daily deaths over past 7 days PER COL BOL MEX BRA ZAF ARG CHL USA IRN IRQ DOM ROU KAZ GTM ISR HND ECU PRY SLV SAU BGR SRB BEL IND LBY AUS RUS MAR KGZ UKR PHL ESP ITA BLR SWE ZWE ZMB VEN PRT DZA AFG AZE POL IDN TUR EGY BGD SEN FRA GRC ETH KEN GBR UZB HTI CAN MWI NPL MDG AGO GHA AUT NLD CZE USA None 1 in 200,000 1 in 100,000 1 in 66,667 1 in 50,000 1 in 40,000 1 6 11 16 21 26 31 36 41 46 51 56 61 66 Rank Averagedeaths/day Average daily deaths over past 7 days Excludes countries with population < 5,000,000 2020-08-18 Summary: 12
- 13. Case Mortality vs. Testing LUX AREBHR MLT DNK ISLISR RUS LTU AUS USA QAT PRT MDV GBR BEL BLR IRL KWT CAN NZL SAU LVA KAZ SRB SGP AUT DEU ESP CHL CHE EST NOR FINROU CZE ITA NLD GRC SVN TURPAN POL ZAF SVK BGR MAR SLV COL URY HUN MYS IRN HRV KOR IRQ UKR CUB RWA IND PRYCRI ARG NPL BOL PHL GHA ECU BRA JPN PER PAK TUN FJI MEX SEN BGD KEN UGA TGO THA ZWE CIV IDN ETHTWN VNM MMR NGA USA 0 5 10 0 20 40 60 % Tested %CaseMortality Case Mortality vs. Testing as of 2020-08-18 ARE: United Arab Emirates, BHR:Bahrain, MLT: Malta, ISR: Israel, LTU: Lithuania, ISL: Iceland 2020-08-18 Summary: 13
- 14. CV for Cases and Deaths NLD ITA ESPGBR FRA CHE CHN BEL DEU DNKFIN CAN CUBMYS TCD SWE HUN AUTMLI KOR BFA PRT SLESSDCMR TURPAK TUNCZE JPN ECUAFG GRCSDN SVKPOLYEMEGY CIV USABLR CHL BENNGACOD RUS NIC DZAGIN HTI BRASAU BGDIRNAZE KGZUKRSRB IDNMEX PHLSEN ROUDOM IRQGTMGHAHND ISRBGRPER SLV INDBOLTGO SYRKENRWA MOZ COLZAFMWI ZMBARG VENUZBKAZ MARMDG AGONPL ETH LBYAUS PRYZWE PNG UGA VNM 0.001 0.010 0.100 1.000 0.010.01 0.10 1.00 Cases CV DeathsCV Coefficient of variation for cases and deaths as of 2020-08-18 CV calculated over last 28 days 2020-08-18 Summary: 14
- 15. Mortality Trends 0 2 4 6 8 10 12 14 USCaseRateMortality Mortality Type: 13 day rolling median Cumulative Daily Raw Daily vs. Cumulative US Case Rate Mortality Last week excluded because deaths are often backdated 2020-08-18 Summary: 15
- 16. Change in New Cases per Day New cases are: Increasing > +3% Increasing between +1% and +3% No Change (-1% to +1%) Decreasing between -1% and -3% Decreasing > -3% New cases by state as of 2020-08-18 2020-08-18 Summary: 16
- 17. Cases as a Percent of Peak Cases HI TX FL OK LA MS AL GA AZ NM KS AR TN NC SC DC CA UT CO NE MO KY WV VA MD DE OR NV WY SD IA IN OH PA NJ CT RI WA ID MT ND MN IL MI NY MA WI VT NH AK ME 0 25 50 75 100 0 25 50 75 100 0 25 50 75 100 0 25 50 75 100 0 25 50 75 100 0 25 50 75 100 0 25 50 75 100 0 25 50 75 100 PercentofPeak Daily Cases as a Percent of Peak Cases 2020-08-18 Summary: 17
- 18. Change in New Deaths per Day New deaths are: Increasing > +0.5% Increasing between +0.1% and +0.5% No Change (-0.1% to +0.1%) Decreasing between -0.1% and -0.5% Decreasing > -0.5% New deaths by state as of 2020-08-18 2020-08-18 Summary: 18
- 19. Deaths as a Percent of Peak Deaths HI TX FL OK LA MS AL GA AZ NM KS AR TN NC SC DC CA UT CO NE MO KY WV VA MD DE OR NV WY SD IA IN OH PA NJ CT RI WA ID MT ND MN IL MI NY MA WI VT NH AK ME 0 25 50 75 100 0 25 50 75 100 0 25 50 75 100 0 25 50 75 100 0 25 50 75 100 0 25 50 75 100 0 25 50 75 100 0 25 50 75 100 PercentofPeak Daily Deaths as a Percent of Peak Deaths 2020-08-18 Summary: 19
- 20. Change in cases vs change in deaths AL AK AZ AR CA CO CT DE DC FL GA HI ID IL IN IA KS KY LA ME MD MA MI MN MS MO MT NE NV NH NJ NM NY NC ND OH OK OR PA RI SC SD TN TX UT VTVA WA WV WI WY -6 -4 -2 0 2 4 -8 -4 0 4 Change in cases (%/day) Changeindeaths(%/day) Change in cases vs change in deaths over last 14 days as of 2020-08-18 2020-08-18 Summary: 20
- 21. Total US COVID-19 Cases CA FL TX NY GA IL AZ NJ NC LA TN PA MA OH AL VA SC MI MD IN MS MO WA WI MN NV CO AR IA CT OK UT KY KS NE ID NM OR RI DE DC SD ND WV NH MT HI AK ME WY VT 0 200,000 400,000 600,000 1 6 11 16 21 26 31 36 41 46 51 Rank Totalcases Masks No Yes Governor aa Democratic Republican Total US COVID-19 Cases p masks: 0.39, p governor: 0.73. NB: association != causation. 2020-08-18 Summary: 21
- 22. Total US COVID-19 Cases LA FL AZ MS GA AL NY NJ SC NV TN RI TX DC MA AR DE IA MD IL CA NE ID UT CT NC VA OK IN KS SD MN WI ND MO NM MI PA OH CO WA KY AK WY OR MT NH WV HI ME VT None 1 in 200 1 in 100 1 in 67 1 in 50 1 in 40 1 in 33 1 6 11 16 21 26 31 36 41 46 51 Rank TotalCases Masks No Yes Governor aa Democratic Republican Total US COVID-19 Cases p masks: 0.99, p governor: 0.19. NB: association != causation. 2020-08-18 Summary: 22
- 23. Average US COVID-19 cases over the past 7 days GA FL TX NV ID CA TN MS MO AL LA ND KS OK SC IA AR HI NE IL KY IN DE AZ WI NC UT MD VA MN SD AK RI MT DC OH WA MI NM WV OR PA WY CO MA NJ CT NY NH ME VT None 1 in 20,000 1 in 10,000 1 in 6,667 1 in 5,000 1 in 4,000 1 in 3,333 1 6 11 16 21 26 31 36 41 46 51 Rank NewCases/Day Masks No Yes Governor aa Democratic Republican Average US COVID-19 cases over the past 7 days p masks: 0.043, p governor: 0.023. NB: association != causation. 2020-08-18 Summary: 23
- 24. Total US COVID-19 Deaths NY NJ CA TX FL MA IL PA MI GA LA AZ CT OH MD IN VA NC SC MS AL CO WA MN MO TN NV WI RI IA KY NM OK AR DC DE NH KS OR UT NE ID WV SD ME ND MT VT HI WY AK 0 10,000 20,000 30,000 1 6 11 16 21 26 31 36 41 46 51 Rank TotalDeaths Masks No Yes Governor aa Democratic Republican Total US COVID-19 Deaths p masks: 0.057, p governor: 0.21. NB: association != causation. 2020-08-18 Summary: 24
- 25. Total US COVID-19 Deaths NJ NY MA CT LA RI DC MS MI IL AZ DE MD PA IN GA SC FL AL TX NV NM CO OH IA MN NH CA VA WA MO NC TN AR NE KY WI SD OK ND ID KS UT ME VT OR WV MT WY AK HI None 1 in 2,000 1 in 1,000 1 in 667 1 in 500 1 6 11 16 21 26 31 36 41 46 51 Rank TotalDeaths Masks No Yes Governor aa Democratic Republican Total US COVID-19 Deaths p masks: 0.034, p governor: 0.21. NB: association != causation. 2020-08-18 Summary: 25
- 26. Average US COVID-19 deaths over the past 7 days MS FL LA SC GA AZ TX NV AL TN CA ID AR ND IA NM OK MA NC IN OH MO WA WV PA MN KY IL MD KS NE UT DC RI SD OR WI VA MI CO MT HI NJ CT NY WY NH AK DE ME VT None 1 in 500,000 1 in 250,000 1 in 166,667 1 in 125,000 1 6 11 16 21 26 31 36 41 46 51 Rank Deaths/Day Masks No Yes Governor aa Democratic Republican Average US COVID-19 deaths over the past 7 days p masks: 0.22, p governor: 0.012. NB: association != causation. 2020-08-18 Summary: 26
- 27. Daily testing trends HI TX FL OK LA MS AL GA AZ NM KS AR TN NC SC DC CA UT CO NE MO KY WV VA MD DE OR NV WY SD IA IN OH PA NJ CT RI WA ID MT ND MN IL MI NY MA WI VT NH AK ME min max min max min max min max min max min max min max min max Dailytestingfrommintomax Daily testing trends from min to max Line = Friedman's supersmoother 2020-08-18 Summary: 27
- 28. Change in daily tests over past 14 days VT HI MA VA WV NC MO ME NJ AR IL MI CT OK MD KS IN NY IA DC CA PA AL NE KY OR OH SC ND TX TN SD CO MN RI ID NH AK LA WY DE NV MS AZ UT FL NM MT GA WI WA -6.0 -3.0 0.0 3.0 1 6 11 16 21 26 31 36 41 46 51 Rank Changeindailytests(%/day) Masks No Yes Governor aa Democratic Republican Change in daily tests over past 14 days p masks: 0.039, p governor: 0.77. NB: association != causation. 2020-08-18 Summary: 28
- 29. Percent Tested AK NY LA DC NM NJ CT TN IL CA ND MI RI DE MA AR WV FL WI MT MD GA OK UT NC VT NV MN MS IA AL SC NE VA KY OH ME TX AZ SD MO NH IN WA ID KS OR PA HI CO WY 0 10 20 30 40 1 6 11 16 21 26 31 36 41 46 51 Rank PercentTested Masks No Yes Governor aa Democratic Republican Percent Tested p masks: 0.094, p governor: 0.39. NB: association != causation. 2020-08-18 Summary: 29
- 30. Percent of Positive COVID Tests AZ MS FL AL ID SC TX GA NV KS IA NE IN RI MD AR PA MA CO LA SD MO VA UT DE NC NJ TN WA MN OK CA WI IL NY OH KY WY DC CT ND OR MI NH NM HI MT WV ME AK VT 0.0 5.0 10.0 15.0 20.0 1 6 11 16 21 26 31 36 41 46 51 Rank PercentofPositiveTests Masks No Yes Governor aa Democratic Republican Percent of Positive COVID Tests p masks: 0.14, p governor: 0.013. NB: association != causation. 2020-08-18 Summary: 30
- 31. Positive fraction trends HI TX FL OK LA MS AL GA AZ NM KS AR TN NC SC DC CA UT CO NE MO KY WV VA MD DE OR NV WY SD IA IN OH PA NJ CT RI WA ID MT ND MN IL MI NY MA WI VT NH AK ME min max min max min max min max min max min max min max min max Fractionpositivefrommintomax Positive fraction trends from min to max 2020-08-18 Summary: 31
- 32. Change in positive tests over past 14 days HI MT WA NC ND ID MO OK KY NV MS TX AK KS FL WY WI WV TN OR CA SD UT IA MN AR IN NE GA AL DE VA OH CO LA NM RI SC AZ IL PA VT NH MD MI NJ CT NY MA DC ME 0.0 2.0 4.0 1 6 11 16 21 26 31 36 41 46 51 Rank Changeinpositivetests(%/day) Masks No Yes Governor aa Democratic Republican Change in positive tests over past 14 days p masks: 0.077, p governor: 0.3. NB: association != causation. 2020-08-18 Summary: 32
- 33. Change in tests vs change in positive tests AL AK AZ ARCA CO CT DE DC FL GA HI ID IL INIA KS KY LA ME MD MA MI MN MS MO MT NE NV NH NJ NM NY NC ND OH OK OR PA RI SC SDTN TX UT VT VA WA WVWI WY -1 0 1 2 3 4 -5.0 -2.5 0.0 2.5 5.0 Change in tests (%/day) Changeinpositivetests(%/day) Change in tests vs change in positive tests last 14 days as of 2020-08-18 2020-08-18 Summary: 33
- 34. Current hospitalizations as a percent of peak since FebruaryHI MT ND WV AK ID KY MO MS AR KS OH TN NC GA OK AL VA NV OR NE WY UT SC CA SD IA WA IN LA FL NM WI TX MN AZ VT IL MD RI CO PA MI DC ME NH DE MA NJ NY CT 0 30 60 90 1 6 11 16 21 26 31 36 41 46 51 Rank Hospitalizations(%ofpeak) Masks No Yes Governor aa Democratic Republican Current hospitalizations as a percent of peak since February p masks: 0.037, p governor: 0.058. NB: association != causation. 2020-08-18 Summary: 34
- 35. Hospitalizations trends HI TX FL OK LA MS AL GA AZ NM KS AR TN NC SC DC CA UT CO NE MO KY WV VA MD DE OR NV WY SD IA IN OH PA NJ CT RI WA ID MT ND MN IL MI NY MA WI VT NH AK ME min max min max min max min max min max min max min max min max Hospitalizationsfrommintomax Hospitalizations trends from min to max 2020-08-18 Summary: 35
- 36. Change in hospitalizations over past 14 days HI SD VT MT WI ND WV IA RI IL MI OR NE MA MN AK IN MO ID KY WA VA MS NY AR OH DC NM KS PA CT NC GA TN OK NV AL MD CA LA SC UT WY CO FL ME TX DE NH NJ AZ -2.5 0.0 2.5 1 6 11 16 21 26 31 36 41 46 51 Rank Changeinhospitalizations(%/day) Masks No Yes Governor aa Democratic Republican Change in hospitalizations over past 14 days p masks: 0.65, p governor: 0.77. NB: association != causation. 2020-08-18 Summary: 36
- 37. Case Mortality vs. Testing AL AK AZ AR CA CO CT DE DC FL GA HI ID ILIN IA KS KY LA ME MD MA MI MN MS MO MT NE NV NH NJ NM NY NC ND OH OK OR PA RI SC SD TN TX UT VT VA WA WV WI WY 2.5 5.0 7.5 10 20 30 40 % Tested %Mortality Mortality vs. Testing as of 2020-08-18 2020-08-18 Summary: 37
- 38. CV for Cases and Deaths MA LAIL TNCA OKIA NMFLIN NV SCNCMDWIKY OH MSALWA UTGAPATX ARMN ID AZOR MOKSMI DC NEND MT SDRI CTCONY AK MENJVA WY WV NH HI VT DE 0.010.01 0.10 1.00 0.010.01 0.10 1.00 Cases CV DeathsCV Coefficient of variation for cases and deaths as of 2020-08-18 CV calculated over last 28 days 2020-08-18 Summary: 38