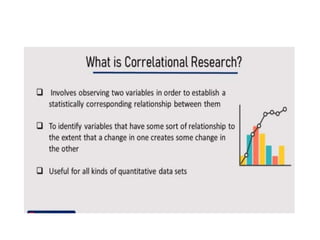
The document discusses correlational research, which examines relationships between two variables without manipulating them. Correlational research can establish that variables are related but cannot prove one causes the other. Key points covered include:
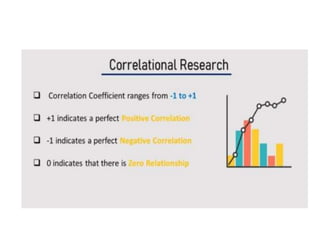
- Correlation coefficients measure the strength and direction of relationships between variables.
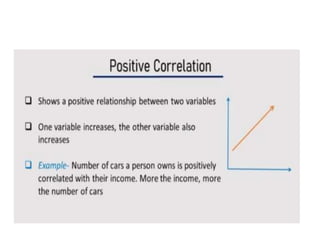
- Positive correlations indicate variables increase together, while negative correlations mean one decreases as the other increases.
- Correlational research has advantages like lower cost but cannot prove causation like experiments can.
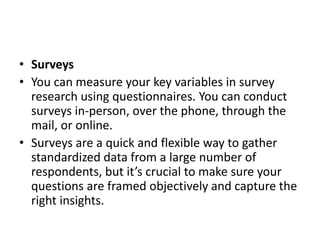
- Common data collection methods are naturalistic observation, surveys, archival data, and secondary data. Correlation and regression analyses are frequently used to analyze correlational data and make predictions.