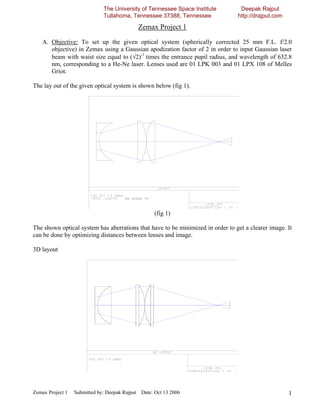
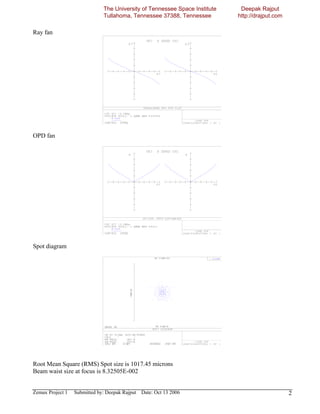
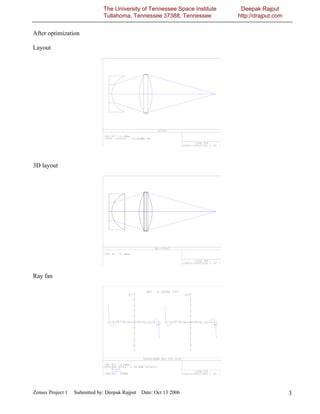
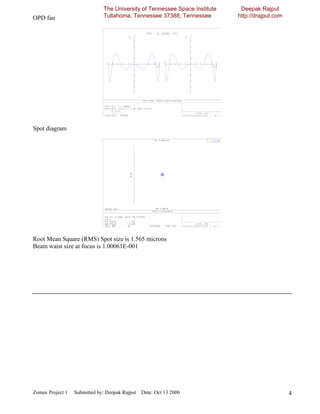
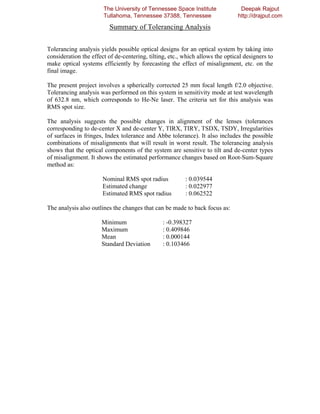
The University of Tennessee Space Institute        Deepak Rajput
                              Tullahoma, Tennessee 37388, Tennessee             http://drajput.com

                                             Zemax Project 1

    A. Objective: To set up the given optical system (spherically corrected 25 mm F.L. f/2.0
       objective) in Zemax using a Gaussian apodization factor of 2 in order to input Gaussian laser
       beam with waist size equal to (√2)-1 times the entrance pupil radius, and wavelength of 632.8
       nm, corresponding to a He-Ne laser. Lenses used are 01 LPK 003 and 01 LPX 108 of Melles
       Griot.

The lay out of the given optical system is shown below (fig 1).


                                                    (fig 1)

The shown optical system has aberrations that have to be minimized in order to get a clearer image. It
can be done by optimizing distances between lenses and image.

3D layout


Zemax Project 1   Submitted by: Deepak Rajput Date: Oct 13 2006                                      1
The University of Tennessee Space Institute    Deepak Rajput
                              Tullahoma, Tennessee 37388, Tennessee         http://drajput.com

Ray fan


OPD fan


Spot diagram


Root Mean Square (RMS) Spot size is 1017.45 microns
Beam waist size at focus is 8.32505E-002


Zemax Project 1   Submitted by: Deepak Rajput Date: Oct 13 2006                                  2
The University of Tennessee Space Institute    Deepak Rajput
                              Tullahoma, Tennessee 37388, Tennessee         http://drajput.com


After optimization

Layout


3D layout


Ray fan


Zemax Project 1   Submitted by: Deepak Rajput Date: Oct 13 2006                                  3
The University of Tennessee Space Institute    Deepak Rajput
OPD fan                       Tullahoma, Tennessee 37388, Tennessee         http://drajput.com


Spot diagram


Root Mean Square (RMS) Spot size is 1.565 microns
Beam waist size at focus is 1.00061E-001


Zemax Project 1   Submitted by: Deepak Rajput Date: Oct 13 2006                                  4
The University of Tennessee Space Institute         Deepak Rajput
                             Tullahoma,and de-centering by Tennesseeof 3 lenses, individually, and all
Considering the effects of tilting by 1° Tennessee 37388, 1mm each             http://drajput.com
3 together.

Case 1: Lens 1 – tilted by 1° and de-centered by 1 mm (Lens 1 is the left most lens)

3D layout


Ray fan


OPD fan


Zemax Project 1   Submitted by: Deepak Rajput Date: Oct 13 2006                                     5
The University of Tennessee Space Institute    Deepak Rajput
Spot diagram                  Tullahoma, Tennessee 37388, Tennessee         http://drajput.com


Root Mean Square (RMS) Spot size is 1054.64 microns
Beam waist size at focus is 8.32505E-002

After optimization

3D layout


Ray fan


Zemax Project 1   Submitted by: Deepak Rajput Date: Oct 13 2006                                  6
The University of Tennessee Space Institute            Deepak Rajput
OPD fan                       Tullahoma, Tennessee 37388, Tennessee                 http://drajput.com


Spot diagram


Root Mean Square (RMS) Spot size is 78.270 microns
Beam waist size at focus is 8.52004E-002

Case 2: Lens 2 – tilted by 1° and de-centered by 1 mm (Lens 2 is the middle lens)

3D layout


Zemax Project 1   Submitted by: Deepak Rajput Date: Oct 13 2006                                          7
The University of Tennessee Space Institute    Deepak Rajput
Ray fan                       Tullahoma, Tennessee 37388, Tennessee         http://drajput.com


OPD fan


Spot diagram


Root Mean Square (RMS) Spot size is 1089.39 microns
Beam waist size at focus is 8.32505E-002


Zemax Project 1   Submitted by: Deepak Rajput Date: Oct 13 2006                                  8
The University of Tennessee Space Institute    Deepak Rajput
After optimization            Tullahoma, Tennessee 37388, Tennessee         http://drajput.com

3D layout


Ray fan


OPD fan


Zemax Project 1   Submitted by: Deepak Rajput Date: Oct 13 2006                                  9
The University of Tennessee Space Institute         Deepak Rajput
Spot diagram                  Tullahoma, Tennessee 37388, Tennessee              http://drajput.com


Root Mean Square (RMS) Spot size is 48.888 microns
Beam waist size at focus is 1.01925E-001

Case 3: Lens 3 – tilted by 1° and de-centered by 1 mm (Lens 3 is the lens next to image)

3D layout


Ray fan


Zemax Project 1   Submitted by: Deepak Rajput Date: Oct 13 2006                                       10
The University of Tennessee Space Institute    Deepak Rajput
OPD fan                       Tullahoma, Tennessee 37388, Tennessee         http://drajput.com


Spot diagram


Root Mean Square (RMS) Spot size is 1081.64 microns
Beam waist size at focus is 8.32505E-002

After optimization

3D layout


Zemax Project 1   Submitted by: Deepak Rajput Date: Oct 13 2006                                  11
The University of Tennessee Space Institute    Deepak Rajput
Ray fan                       Tullahoma, Tennessee 37388, Tennessee         http://drajput.com


OPD fan


Spot diagram


Root Mean Square (RMS) Spot size is 113.346 microns
Beam waist size at focus is 1.09739E-001


Zemax Project 1   Submitted by: Deepak Rajput Date: Oct 13 2006                                  12
The University of Tennessee Space Institute     Deepak Rajput
                             Tullahoma, Tennessee 37388, mm (Lens numbering http://drajput.com
Case 4: Lenses 1, 2 & 3 – tilted by 1° and de-centered by 1 Tennessee       from left)

3D layout


Ray fan


OPD fan


Zemax Project 1   Submitted by: Deepak Rajput Date: Oct 13 2006                                  13
The University of Tennessee Space Institute    Deepak Rajput
Spot diagram                  Tullahoma, Tennessee 37388, Tennessee         http://drajput.com


Root Mean Square (RMS) Spot size is 1067.75 microns
Beam waist size at focus is 8.32505E-002

After optimization

3D layout


Ray fan


Zemax Project 1   Submitted by: Deepak Rajput Date: Oct 13 2006                                  14
The University of Tennessee Space Institute    Deepak Rajput
OPD fan                       Tullahoma, Tennessee 37388, Tennessee         http://drajput.com


Spot diagram


Root Mean Square (RMS) Spot size is 33.210 microns
Beam waist size at focus is 9.86753E-002


Zemax Project 1   Submitted by: Deepak Rajput Date: Oct 13 2006                                  15
The University of Tennessee Space Institute         Deepak Rajput
                              Tullahoma, Tennessee 37388, Tennessee              http://drajput.com
B.    Objective: To perform

(B1) Tolerancing Analysis
(B2) Monte Carlo analysis of the system.

B1: Tolerancing Analysis


                                  Summary of Tolerancing Analysis

Tolerancing analysis yields possible optical designs for an optical system by taking into consideration
the effect of de-centering, tilting, etc., which allows the optical designers to make optical systems
efficiently by forecasting the effect of misalignment, etc. on the final image.

The present project involves a spherically corrected 25 mm focal length f/2.0 objective. Tolerancing
analysis was performed on this system in sensitivity mode at test wavelength of 632.8 nm, which
corresponds to He-Ne laser. The criteria set for this analysis was RMS spot size.

The analysis suggests the possible changes in alignment of the lenses (tolerances corresponding to de-
center X and de-center Y, TIRX, TIRY, TSDX, TSDY, Irregularities of surfaces in fringes, Index
tolerance and Abbe tolerance). It also includes the possible combinations of misalignments that will
result in worst result. The tolerancing analysis shows that the optical components of the system are
sensitive to tilt and de-center types of misalignment. It shows the estimated performance changes
based on Root-Sum-Square method as:

                               Nominal RMS spot radius            : 0.039544
                               Estimated change                   : 0.022977
                               Estimated RMS spot radius          : 0.062522

The analysis also outlines the changes that can be made to back focus as:

                              Minimum                   : -0.398327
                              Maximum                   : 0.409846
                              Mean                      : 0.000144
                              Standard Deviation        : 0.103466


Zemax Project 1   Submitted by: Deepak Rajput Date: Oct 13 2006                                       16
The University of Tennessee Space Institute               Deepak Rajput
B2: Monte Carlo Analysis Tullahoma, Tennessee 37388, Tennessee                    http://drajput.com

Spot diagrams (dithered ray pattern) from Monte Carlo Analysis

                         1)      Spot diagram 1 (RMS spot size: 50.234 microns)


                         2)      Spot diagram 2 (RMS spot size: 34.405 microns)


                         3)      Spot diagram 3 (RMS spot size: 26.840 microns)


Zemax Project 1   Submitted by: Deepak Rajput Date: Oct 13 2006                                        17
The University of Tennessee Space Institute          Deepak Rajput
                              Tullahoma, Tennessee 37388, Tennessee               http://drajput.com
                         4)      Spot diagram 4 (RMS spot size: 23.196 microns)


                         5)      Spot diagram 5 (RMS spot size: 22.559 microns)


The type of the aberration is found to be mostly spherical aberration and it appears to be the most
troublesome for this optical system. Hence, I do not recommend this optical system for tightly
focusing a laser beam. The focused spot appears like a scattered V-shape in most of the cases.


Zemax Project 1   Submitted by: Deepak Rajput Date: Oct 13 2006                                        18
The University of Tennessee Space Institute              Deepak Rajput
                       Tullahoma, Tennessee 37388, Tennessee                   http://drajput.com

                         Summary of Tolerancing Analysis

Tolerancing analysis yields possible optical designs for an optical system by taking into
consideration the effect of de-centering, tilting, etc., which allows the optical designers to
make optical systems efficiently by forecasting the effect of misalignment, etc. on the
final image.

The present project involves a spherically corrected 25 mm focal length f/2.0 objective.
Tolerancing analysis was performed on this system in sensitivity mode at test wavelength
of 632.8 nm, which corresponds to He-Ne laser. The criteria set for this analysis was
RMS spot size.

The analysis suggests the possible changes in alignment of the lenses (tolerances
corresponding to de-center X and de-center Y, TIRX, TIRY, TSDX, TSDY, Irregularities
of surfaces in fringes, Index tolerance and Abbe tolerance). It also includes the possible
combinations of misalignments that will result in worst result. The tolerancing analysis
shows that the optical components of the system are sensitive to tilt and de-center types
of misalignment. It shows the estimated performance changes based on Root-Sum-Square
method as:

                       Nominal RMS spot radius           : 0.039544
                       Estimated change                  : 0.022977
                       Estimated RMS spot radius         : 0.062522

The analysis also outlines the changes that can be made to back focus as:

                      Minimum                   : -0.398327
                      Maximum                   : 0.409846
                      Mean                      : 0.000144
                      Standard Deviation        : 0.103466

Zemax

  • 1.
    The University ofTennessee Space Institute Deepak Rajput Tullahoma, Tennessee 37388, Tennessee http://drajput.com Zemax Project 1 A. Objective: To set up the given optical system (spherically corrected 25 mm F.L. f/2.0 objective) in Zemax using a Gaussian apodization factor of 2 in order to input Gaussian laser beam with waist size equal to (√2)-1 times the entrance pupil radius, and wavelength of 632.8 nm, corresponding to a He-Ne laser. Lenses used are 01 LPK 003 and 01 LPX 108 of Melles Griot. The lay out of the given optical system is shown below (fig 1). (fig 1) The shown optical system has aberrations that have to be minimized in order to get a clearer image. It can be done by optimizing distances between lenses and image. 3D layout Zemax Project 1 Submitted by: Deepak Rajput Date: Oct 13 2006 1
  • 2.
    The University ofTennessee Space Institute Deepak Rajput Tullahoma, Tennessee 37388, Tennessee http://drajput.com Ray fan OPD fan Spot diagram Root Mean Square (RMS) Spot size is 1017.45 microns Beam waist size at focus is 8.32505E-002 Zemax Project 1 Submitted by: Deepak Rajput Date: Oct 13 2006 2
  • 3.
    The University ofTennessee Space Institute Deepak Rajput Tullahoma, Tennessee 37388, Tennessee http://drajput.com After optimization Layout 3D layout Ray fan Zemax Project 1 Submitted by: Deepak Rajput Date: Oct 13 2006 3
  • 4.
    The University ofTennessee Space Institute Deepak Rajput OPD fan Tullahoma, Tennessee 37388, Tennessee http://drajput.com Spot diagram Root Mean Square (RMS) Spot size is 1.565 microns Beam waist size at focus is 1.00061E-001 Zemax Project 1 Submitted by: Deepak Rajput Date: Oct 13 2006 4
  • 5.
    The University ofTennessee Space Institute Deepak Rajput Tullahoma,and de-centering by Tennesseeof 3 lenses, individually, and all Considering the effects of tilting by 1° Tennessee 37388, 1mm each http://drajput.com 3 together. Case 1: Lens 1 – tilted by 1° and de-centered by 1 mm (Lens 1 is the left most lens) 3D layout Ray fan OPD fan Zemax Project 1 Submitted by: Deepak Rajput Date: Oct 13 2006 5
  • 6.
    The University ofTennessee Space Institute Deepak Rajput Spot diagram Tullahoma, Tennessee 37388, Tennessee http://drajput.com Root Mean Square (RMS) Spot size is 1054.64 microns Beam waist size at focus is 8.32505E-002 After optimization 3D layout Ray fan Zemax Project 1 Submitted by: Deepak Rajput Date: Oct 13 2006 6
  • 7.
    The University ofTennessee Space Institute Deepak Rajput OPD fan Tullahoma, Tennessee 37388, Tennessee http://drajput.com Spot diagram Root Mean Square (RMS) Spot size is 78.270 microns Beam waist size at focus is 8.52004E-002 Case 2: Lens 2 – tilted by 1° and de-centered by 1 mm (Lens 2 is the middle lens) 3D layout Zemax Project 1 Submitted by: Deepak Rajput Date: Oct 13 2006 7
  • 8.
    The University ofTennessee Space Institute Deepak Rajput Ray fan Tullahoma, Tennessee 37388, Tennessee http://drajput.com OPD fan Spot diagram Root Mean Square (RMS) Spot size is 1089.39 microns Beam waist size at focus is 8.32505E-002 Zemax Project 1 Submitted by: Deepak Rajput Date: Oct 13 2006 8
  • 9.
    The University ofTennessee Space Institute Deepak Rajput After optimization Tullahoma, Tennessee 37388, Tennessee http://drajput.com 3D layout Ray fan OPD fan Zemax Project 1 Submitted by: Deepak Rajput Date: Oct 13 2006 9
  • 10.
    The University ofTennessee Space Institute Deepak Rajput Spot diagram Tullahoma, Tennessee 37388, Tennessee http://drajput.com Root Mean Square (RMS) Spot size is 48.888 microns Beam waist size at focus is 1.01925E-001 Case 3: Lens 3 – tilted by 1° and de-centered by 1 mm (Lens 3 is the lens next to image) 3D layout Ray fan Zemax Project 1 Submitted by: Deepak Rajput Date: Oct 13 2006 10
  • 11.
    The University ofTennessee Space Institute Deepak Rajput OPD fan Tullahoma, Tennessee 37388, Tennessee http://drajput.com Spot diagram Root Mean Square (RMS) Spot size is 1081.64 microns Beam waist size at focus is 8.32505E-002 After optimization 3D layout Zemax Project 1 Submitted by: Deepak Rajput Date: Oct 13 2006 11
  • 12.
    The University ofTennessee Space Institute Deepak Rajput Ray fan Tullahoma, Tennessee 37388, Tennessee http://drajput.com OPD fan Spot diagram Root Mean Square (RMS) Spot size is 113.346 microns Beam waist size at focus is 1.09739E-001 Zemax Project 1 Submitted by: Deepak Rajput Date: Oct 13 2006 12
  • 13.
    The University ofTennessee Space Institute Deepak Rajput Tullahoma, Tennessee 37388, mm (Lens numbering http://drajput.com Case 4: Lenses 1, 2 & 3 – tilted by 1° and de-centered by 1 Tennessee from left) 3D layout Ray fan OPD fan Zemax Project 1 Submitted by: Deepak Rajput Date: Oct 13 2006 13
  • 14.
    The University ofTennessee Space Institute Deepak Rajput Spot diagram Tullahoma, Tennessee 37388, Tennessee http://drajput.com Root Mean Square (RMS) Spot size is 1067.75 microns Beam waist size at focus is 8.32505E-002 After optimization 3D layout Ray fan Zemax Project 1 Submitted by: Deepak Rajput Date: Oct 13 2006 14
  • 15.
    The University ofTennessee Space Institute Deepak Rajput OPD fan Tullahoma, Tennessee 37388, Tennessee http://drajput.com Spot diagram Root Mean Square (RMS) Spot size is 33.210 microns Beam waist size at focus is 9.86753E-002 Zemax Project 1 Submitted by: Deepak Rajput Date: Oct 13 2006 15
  • 16.
    The University ofTennessee Space Institute Deepak Rajput Tullahoma, Tennessee 37388, Tennessee http://drajput.com B. Objective: To perform (B1) Tolerancing Analysis (B2) Monte Carlo analysis of the system. B1: Tolerancing Analysis Summary of Tolerancing Analysis Tolerancing analysis yields possible optical designs for an optical system by taking into consideration the effect of de-centering, tilting, etc., which allows the optical designers to make optical systems efficiently by forecasting the effect of misalignment, etc. on the final image. The present project involves a spherically corrected 25 mm focal length f/2.0 objective. Tolerancing analysis was performed on this system in sensitivity mode at test wavelength of 632.8 nm, which corresponds to He-Ne laser. The criteria set for this analysis was RMS spot size. The analysis suggests the possible changes in alignment of the lenses (tolerances corresponding to de- center X and de-center Y, TIRX, TIRY, TSDX, TSDY, Irregularities of surfaces in fringes, Index tolerance and Abbe tolerance). It also includes the possible combinations of misalignments that will result in worst result. The tolerancing analysis shows that the optical components of the system are sensitive to tilt and de-center types of misalignment. It shows the estimated performance changes based on Root-Sum-Square method as: Nominal RMS spot radius : 0.039544 Estimated change : 0.022977 Estimated RMS spot radius : 0.062522 The analysis also outlines the changes that can be made to back focus as: Minimum : -0.398327 Maximum : 0.409846 Mean : 0.000144 Standard Deviation : 0.103466 Zemax Project 1 Submitted by: Deepak Rajput Date: Oct 13 2006 16
  • 17.
    The University ofTennessee Space Institute Deepak Rajput B2: Monte Carlo Analysis Tullahoma, Tennessee 37388, Tennessee http://drajput.com Spot diagrams (dithered ray pattern) from Monte Carlo Analysis 1) Spot diagram 1 (RMS spot size: 50.234 microns) 2) Spot diagram 2 (RMS spot size: 34.405 microns) 3) Spot diagram 3 (RMS spot size: 26.840 microns) Zemax Project 1 Submitted by: Deepak Rajput Date: Oct 13 2006 17
  • 18.
    The University ofTennessee Space Institute Deepak Rajput Tullahoma, Tennessee 37388, Tennessee http://drajput.com 4) Spot diagram 4 (RMS spot size: 23.196 microns) 5) Spot diagram 5 (RMS spot size: 22.559 microns) The type of the aberration is found to be mostly spherical aberration and it appears to be the most troublesome for this optical system. Hence, I do not recommend this optical system for tightly focusing a laser beam. The focused spot appears like a scattered V-shape in most of the cases. Zemax Project 1 Submitted by: Deepak Rajput Date: Oct 13 2006 18
  • 19.
    The University ofTennessee Space Institute Deepak Rajput Tullahoma, Tennessee 37388, Tennessee http://drajput.com Summary of Tolerancing Analysis Tolerancing analysis yields possible optical designs for an optical system by taking into consideration the effect of de-centering, tilting, etc., which allows the optical designers to make optical systems efficiently by forecasting the effect of misalignment, etc. on the final image. The present project involves a spherically corrected 25 mm focal length f/2.0 objective. Tolerancing analysis was performed on this system in sensitivity mode at test wavelength of 632.8 nm, which corresponds to He-Ne laser. The criteria set for this analysis was RMS spot size. The analysis suggests the possible changes in alignment of the lenses (tolerances corresponding to de-center X and de-center Y, TIRX, TIRY, TSDX, TSDY, Irregularities of surfaces in fringes, Index tolerance and Abbe tolerance). It also includes the possible combinations of misalignments that will result in worst result. The tolerancing analysis shows that the optical components of the system are sensitive to tilt and de-center types of misalignment. It shows the estimated performance changes based on Root-Sum-Square method as: Nominal RMS spot radius : 0.039544 Estimated change : 0.022977 Estimated RMS spot radius : 0.062522 The analysis also outlines the changes that can be made to back focus as: Minimum : -0.398327 Maximum : 0.409846 Mean : 0.000144 Standard Deviation : 0.103466