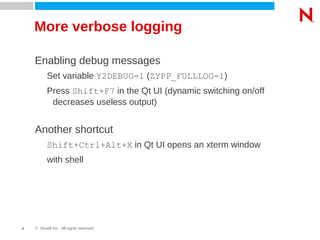
Debugging YaST Scripts
Tips for debugging YaST modules
Ladislav Slezák
Ing.
© Novell Inc. All rights reserved2
Debugger in YaST
There is no debugger in YaST
There was a simple debugger in the past...
So how to debug a YaST script?
© Novell Inc. All rights reserved3
Debugging YaST
Use y2log (/var/log/YaST2/y2log)
• Put y2milestone() wherever it may be useful
• Use y2debug() – not logged by default, for details potentially needed
• Use y2internal() for testing, remove or change it to y2debug later
Use 'showy2log' colorizer
• Command: y2tool showy2log -v -- tail -f
• Displays y2log in colors depending on the log level (errors in red...)
• Formats YCP structures (lists, maps) – more readable output
• Open a separate terminal window with it
© Novell Inc. All rights reserved4
More verbose logging
Enabling debug messages
Set variable Y2DEBUG=1 (ZYPP_FULLLOG=1)
Press Shift+F7 in the Qt UI (dynamic switching on/off
decreases useless output)
Another shortcut
Shift+Ctrl+Alt+X in Qt UI opens an xterm window
with shell.
(That's useful when debugging the installer running from the installation medium, in a running system it
does not make much sense, a terminal can be opened manually very easily.)
© Novell Inc. All rights reserved5
Debugging in YCP
Logging an YCP Backtrace
Use -1 as the first parameter in y2loglevel() call
y2internal(-1, “Backtrace:”);
2007-10-10 15:21:54 <5> cyclops(14553) [YCP] sound/read_routines.ycp:51 Backtrace:
2007-10-10 15:21:54 <5> cyclops(14553) [YCP] sound/read_routines.ycp:157 extractUniqueKey (comment)
2007-10-10 15:21:54 <5> cyclops(14553) [YCP] sound/read_routines.ycp:224 read_modprobe (.modprobe_sound)
2007-10-10 15:21:54 <5> cyclops(14553) [YCP] Sound.ycp:516 read_save_info ()
2007-10-10 15:21:54 <5> cyclops(14553) [YCP] Sound.ycp:710 Sound::ReadModulesConf ()
2007-10-10 15:21:54 <5> cyclops(14553) [YCP] sound/wizards.ycp:262 Sound::Read (true)
2007-10-10 15:21:54 <5> cyclops(14553) [YCP] clients/sound.ycp:588 CommandLine::Run (cmdline)
Breakpoints
Use e.g. Popup::Message() calls
Do not forget to remove them! (svn diff)
© Novell Inc. All rights reserved6
Modifying Installation System
Use /y2update for overriding the current files
YCP interpreter looks the files up in /y2update, $Y2DIR, $HOME/.yast2
and in $PREFIX (/usr)
Create e.g. /y2update/clients, copy the file from /usr there, don't
forget to compile YCP modules (ycpc -c)
Works also for non YCP parts (agents, package-bindings...), very convenient
for debugging YCP clients (clients are reloaded when executed)
Use start_shell=1 boot option to modify the system before start
© Novell Inc. All rights reserved7
Modifying Installation System
Use mount for overlaying the files
Mount with -o option can be used for overriding the original files:
mount -o bind /tmp/foo.ycp /usr/share/YaST2/clients/foo.ycp
Modifying the installation system (inst-sys)
Use Driver Update
See dud Linuxrc option, basically any RPM can be added to the installation
system
Create an addon-product
Similar to y2update
Also for adding packages to the inst-sys
© Novell Inc. All rights reserved8
Debugging YaST Agents
For interactive debugging run
/usr/lib/YaST2/bin/y2base stdio scr
Use `Read(.path), `Write(.path,...),
`Execute(.path,...), `Dir(.path) commands
instead of e.g. SCR::Read() in YCP script
Note: rlwrap (readline wrapper) provides easy editing with history for any
command line tool, use it this way:
rlwrap /usr/lib/YaST2/bin/y2base stdio scr
© Novell Inc. All rights reserved9
Debugging a crash
Crash – usually SIGSEGV (11), SIGABORT (6), see y2log
Backtrace – probably the most valuable information,
tells the exact location of the crash and program stack
When YaST crashes it saves the backtrace to
/var/log/YaST2/signal file.
Use c++filt tool for converting the internal C++ symbols to
a readable form:
cat /var/log/YaST2/signal | c++filt
(Note: The backtrace is created by a standard glibc function, it is not YaST specific.)
© Novell Inc. All rights reserved10
Debugging a crash
GNU gdb can be also used debugging YaST
*-debuginfo packages are required for full debug output
How to get a backtrace?
Start YaST in gdb debugger
gdb /usr/lib/YaST2/bin/y2base
run <module> qt
Attach gdb to running YaST
gdb /usr/lib/YaST2/bin/y2base <PID>
Reproduce the crash
Use 'bt' command in gdb
See http://en.opensuse.org/Bugs/YaST for more details
© Novell Inc. All rights reserved11
UI Debugging
Debugging functions
UI::DumpWidgetTree() - dumps UI tree to y2log
UI::FakeUserInput() - simulates user input (clicking buttons)
© Novell Inc. All rights reserved12
Questions?
Do you have another tip for debugging?
YaST Debugging

YaST Debugging

  • 1.
    Debugging YaST Scripts Tipsfor debugging YaST modules Ladislav Slezák Ing.
  • 2.
    © Novell Inc.All rights reserved2 Debugger in YaST There is no debugger in YaST There was a simple debugger in the past... So how to debug a YaST script?
  • 3.
    © Novell Inc.All rights reserved3 Debugging YaST Use y2log (/var/log/YaST2/y2log) • Put y2milestone() wherever it may be useful • Use y2debug() – not logged by default, for details potentially needed • Use y2internal() for testing, remove or change it to y2debug later Use 'showy2log' colorizer • Command: y2tool showy2log -v -- tail -f • Displays y2log in colors depending on the log level (errors in red...) • Formats YCP structures (lists, maps) – more readable output • Open a separate terminal window with it
  • 4.
    © Novell Inc.All rights reserved4 More verbose logging Enabling debug messages Set variable Y2DEBUG=1 (ZYPP_FULLLOG=1) Press Shift+F7 in the Qt UI (dynamic switching on/off decreases useless output) Another shortcut Shift+Ctrl+Alt+X in Qt UI opens an xterm window with shell. (That's useful when debugging the installer running from the installation medium, in a running system it does not make much sense, a terminal can be opened manually very easily.)
  • 5.
    © Novell Inc.All rights reserved5 Debugging in YCP Logging an YCP Backtrace Use -1 as the first parameter in y2loglevel() call y2internal(-1, “Backtrace:”); 2007-10-10 15:21:54 <5> cyclops(14553) [YCP] sound/read_routines.ycp:51 Backtrace: 2007-10-10 15:21:54 <5> cyclops(14553) [YCP] sound/read_routines.ycp:157 extractUniqueKey (comment) 2007-10-10 15:21:54 <5> cyclops(14553) [YCP] sound/read_routines.ycp:224 read_modprobe (.modprobe_sound) 2007-10-10 15:21:54 <5> cyclops(14553) [YCP] Sound.ycp:516 read_save_info () 2007-10-10 15:21:54 <5> cyclops(14553) [YCP] Sound.ycp:710 Sound::ReadModulesConf () 2007-10-10 15:21:54 <5> cyclops(14553) [YCP] sound/wizards.ycp:262 Sound::Read (true) 2007-10-10 15:21:54 <5> cyclops(14553) [YCP] clients/sound.ycp:588 CommandLine::Run (cmdline) Breakpoints Use e.g. Popup::Message() calls Do not forget to remove them! (svn diff)
  • 6.
    © Novell Inc.All rights reserved6 Modifying Installation System Use /y2update for overriding the current files YCP interpreter looks the files up in /y2update, $Y2DIR, $HOME/.yast2 and in $PREFIX (/usr) Create e.g. /y2update/clients, copy the file from /usr there, don't forget to compile YCP modules (ycpc -c) Works also for non YCP parts (agents, package-bindings...), very convenient for debugging YCP clients (clients are reloaded when executed) Use start_shell=1 boot option to modify the system before start
  • 7.
    © Novell Inc.All rights reserved7 Modifying Installation System Use mount for overlaying the files Mount with -o option can be used for overriding the original files: mount -o bind /tmp/foo.ycp /usr/share/YaST2/clients/foo.ycp Modifying the installation system (inst-sys) Use Driver Update See dud Linuxrc option, basically any RPM can be added to the installation system Create an addon-product Similar to y2update Also for adding packages to the inst-sys
  • 8.
    © Novell Inc.All rights reserved8 Debugging YaST Agents For interactive debugging run /usr/lib/YaST2/bin/y2base stdio scr Use `Read(.path), `Write(.path,...), `Execute(.path,...), `Dir(.path) commands instead of e.g. SCR::Read() in YCP script Note: rlwrap (readline wrapper) provides easy editing with history for any command line tool, use it this way: rlwrap /usr/lib/YaST2/bin/y2base stdio scr
  • 9.
    © Novell Inc.All rights reserved9 Debugging a crash Crash – usually SIGSEGV (11), SIGABORT (6), see y2log Backtrace – probably the most valuable information, tells the exact location of the crash and program stack When YaST crashes it saves the backtrace to /var/log/YaST2/signal file. Use c++filt tool for converting the internal C++ symbols to a readable form: cat /var/log/YaST2/signal | c++filt (Note: The backtrace is created by a standard glibc function, it is not YaST specific.)
  • 10.
    © Novell Inc.All rights reserved10 Debugging a crash GNU gdb can be also used debugging YaST *-debuginfo packages are required for full debug output How to get a backtrace? Start YaST in gdb debugger gdb /usr/lib/YaST2/bin/y2base run <module> qt Attach gdb to running YaST gdb /usr/lib/YaST2/bin/y2base <PID> Reproduce the crash Use 'bt' command in gdb See http://en.opensuse.org/Bugs/YaST for more details
  • 11.
    © Novell Inc.All rights reserved11 UI Debugging Debugging functions UI::DumpWidgetTree() - dumps UI tree to y2log UI::FakeUserInput() - simulates user input (clicking buttons)
  • 12.
    © Novell Inc.All rights reserved12 Questions? Do you have another tip for debugging?