


![USAGE
Usage
gdb [prog] [core | procID]
GDB is invoked by running the program gdb.
Once the debugger is started, GDB reads command until you tell it to exit.
To exit gdb: quit
GDB can be started with variety of arguments and options.
gdb program – one argument, which is an executable file more than
one arguments can be provided
gdb program core – two arguments, one executable and one core
file
gdb program 1234 – specify process id as second argument](https://image.slidesharecdn.com/gdb-191114221051/75/Debugging-Modern-C-Application-with-Gdb-22-2048.jpg)
![ELIMINATE - BREAKPOINTS ANDWATCHPOINTS
Eliminate a breakpoint or watchpoint once it has done its job and you no longer
want your program to stop there.
Based on Location
clear - Delete any breakpoints at the next
instruction to be executed in the selected
stack frame.
clear function, clear filename:function -
Delete any breakpoints set at entry to
the function function.
clear linenum, clear filename:linenum -
Delete any breakpoints set at or within
the code of the specified line.
Based on number
delete [breakpoints] [range...] -
Delete the breakpoints or
watchpoints of the breakpoint
ranges specified as arguments.
If no argument is specified, delete all
breakpoints](https://image.slidesharecdn.com/gdb-191114221051/75/Debugging-Modern-C-Application-with-Gdb-34-2048.jpg)
![STEPPINGTHROUGHTHE PROGRAM
step [count] – program execution continue to
next source line going into function calls.
next [count] – program execution continue to
the next source line omitting function calls.
continue [ignore-count] – resume program execution
ignore-count allows you to specify a further number of times to
ignore a breakpoint at this location
until – continue until the next source line in the current stack
frame is reached.
useful to exit from loops
count - times
step into function; next statement](https://image.slidesharecdn.com/gdb-191114221051/75/Debugging-Modern-C-Application-with-Gdb-36-2048.jpg)
![ALTERING EXECUTION
Returning from a function
finish - forced return
return [ret_value] – pops the current stack frame
Continuing at different address: jump line_num|*address
Altering the value of a variable: set <var> = <value>
Proceeding to a specified point: until [line_num|*address |function_name]
call <function(args)> – Invokes the function](https://image.slidesharecdn.com/gdb-191114221051/75/Debugging-Modern-C-Application-with-Gdb-38-2048.jpg)
![POSTMORTEM DEBUGGING – CORE
A core file or core dump is a file that records the memory image of a running process
and its process status (register values etc.).
Its primary use is post-mortem debugging of a program that crashed while it ran outside a
debugger.
A program that crashes automatically produces a core file, unless this feature is disabled by
the user.
Occasionally, you may wish to produce a core file of the program you are debugging in
order to preserve a snapshot of its state.
gdb has a special command for that generate-core-file.
gcore [file]
Produce a core dump of the inferior process.The optional argument file specifies
the file name where to put the core dump. If not specified, the file name defaults to ‘core.pid’,
where pid is the inferior process ID.](https://image.slidesharecdn.com/gdb-191114221051/75/Debugging-Modern-C-Application-with-Gdb-46-2048.jpg)


![GDB QUICK REFEREN CE G D B Version 4
Essential Commands
gdb program [core] debug program [using coredump core]
b [file:]function
run [arglist]
bt
p expr
c
n
s
set breakpoint at function [in file]
start your program [with arglist]
backtrace: display program stack
display the value of an expression
continue running your program
next line, stepping over function calls
next line, stepping into function calls
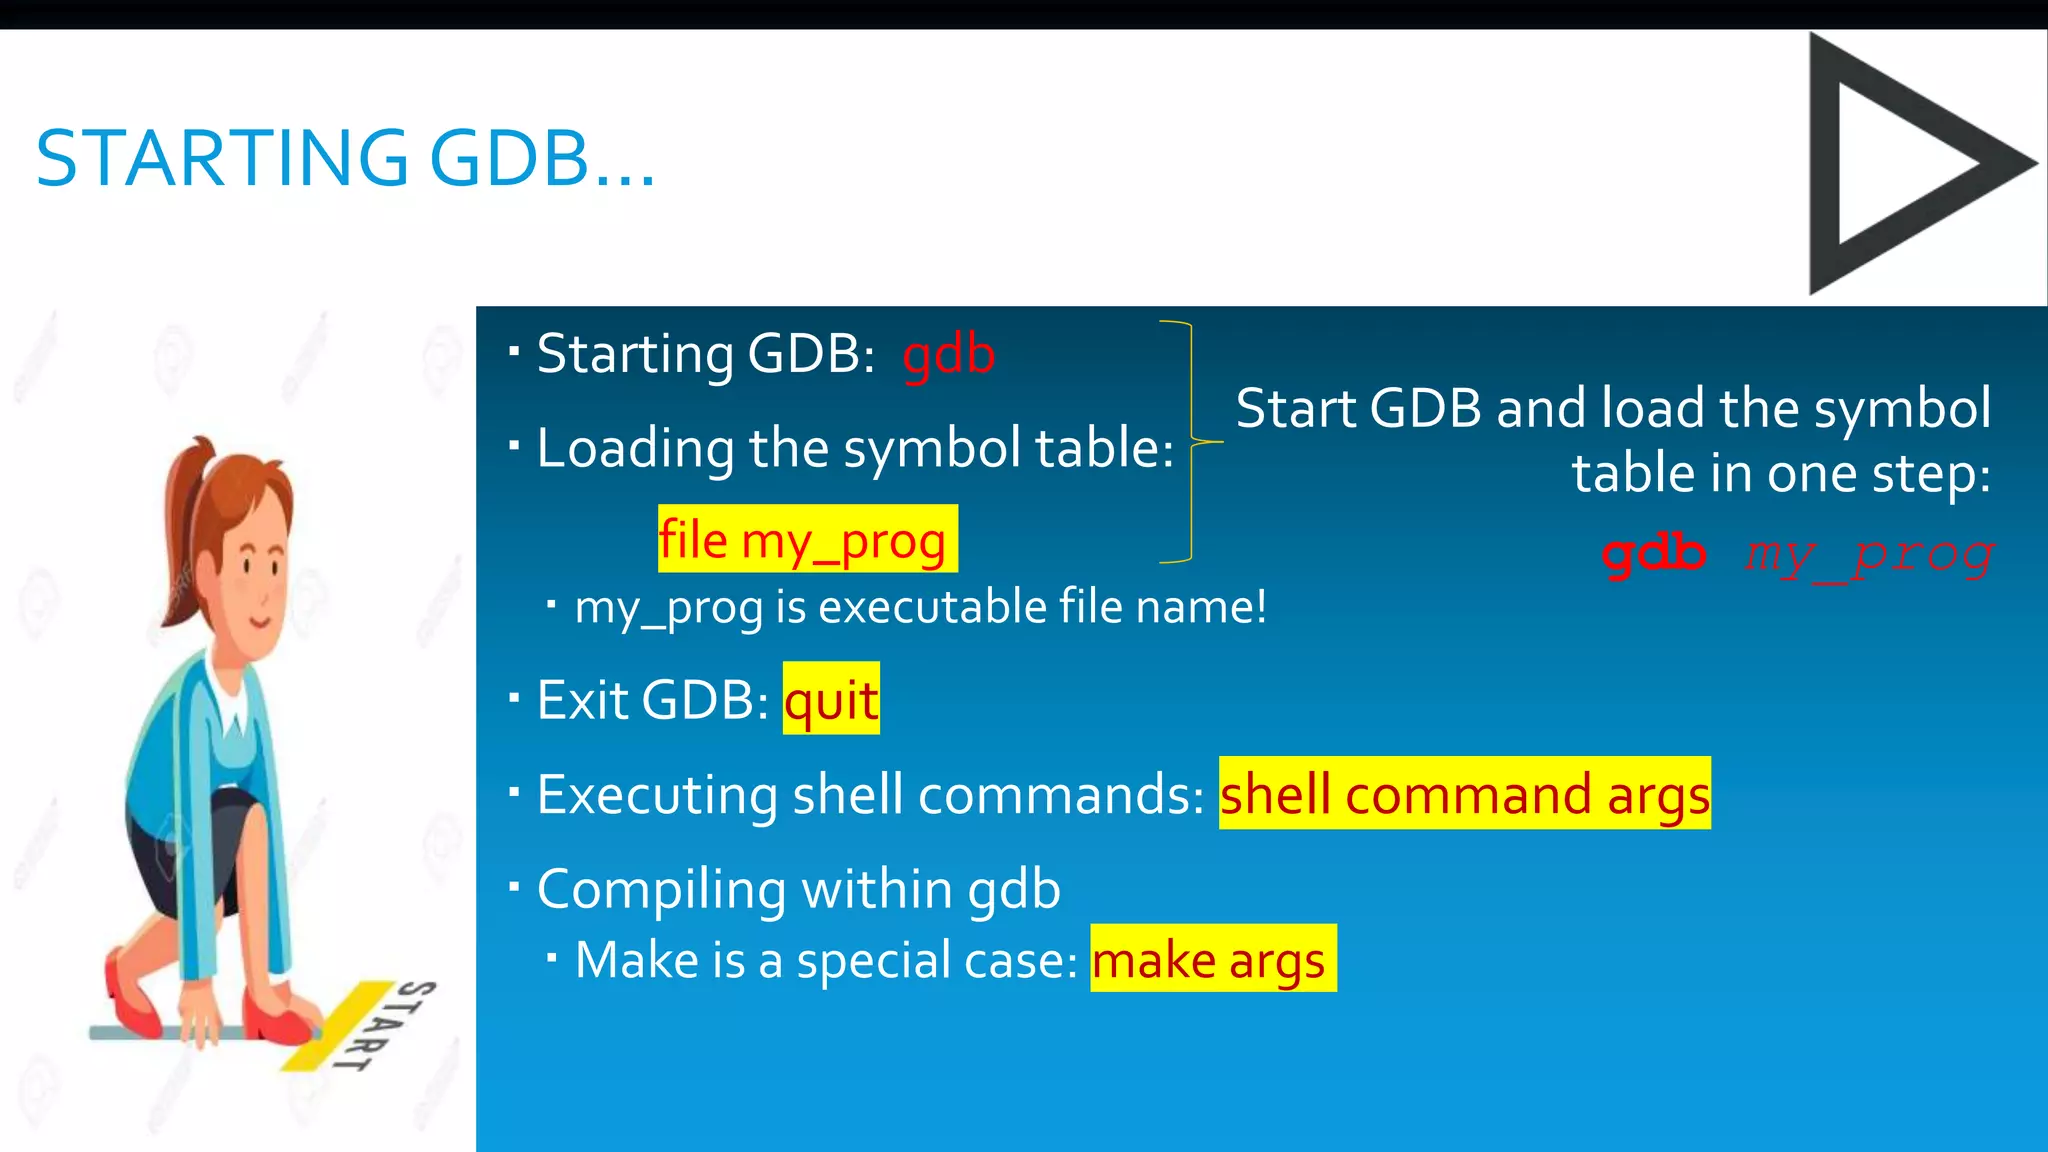
Starting G DB
gdb
gdb program
gdb program core
gdb --help
start GDB, with no debugging ftles
begin debugging program
debug coredump core produced by
program
describe command line options
exit GDB; also q or EOF(eg C-d)
Stopping G DB
quit
INTERRUPT (eg C-c) terminate current command, or
send to running process
Getting Help
help
help class
help command
list classes of commands
one-line descriptions for commands in
class
describe command
Executing your Program
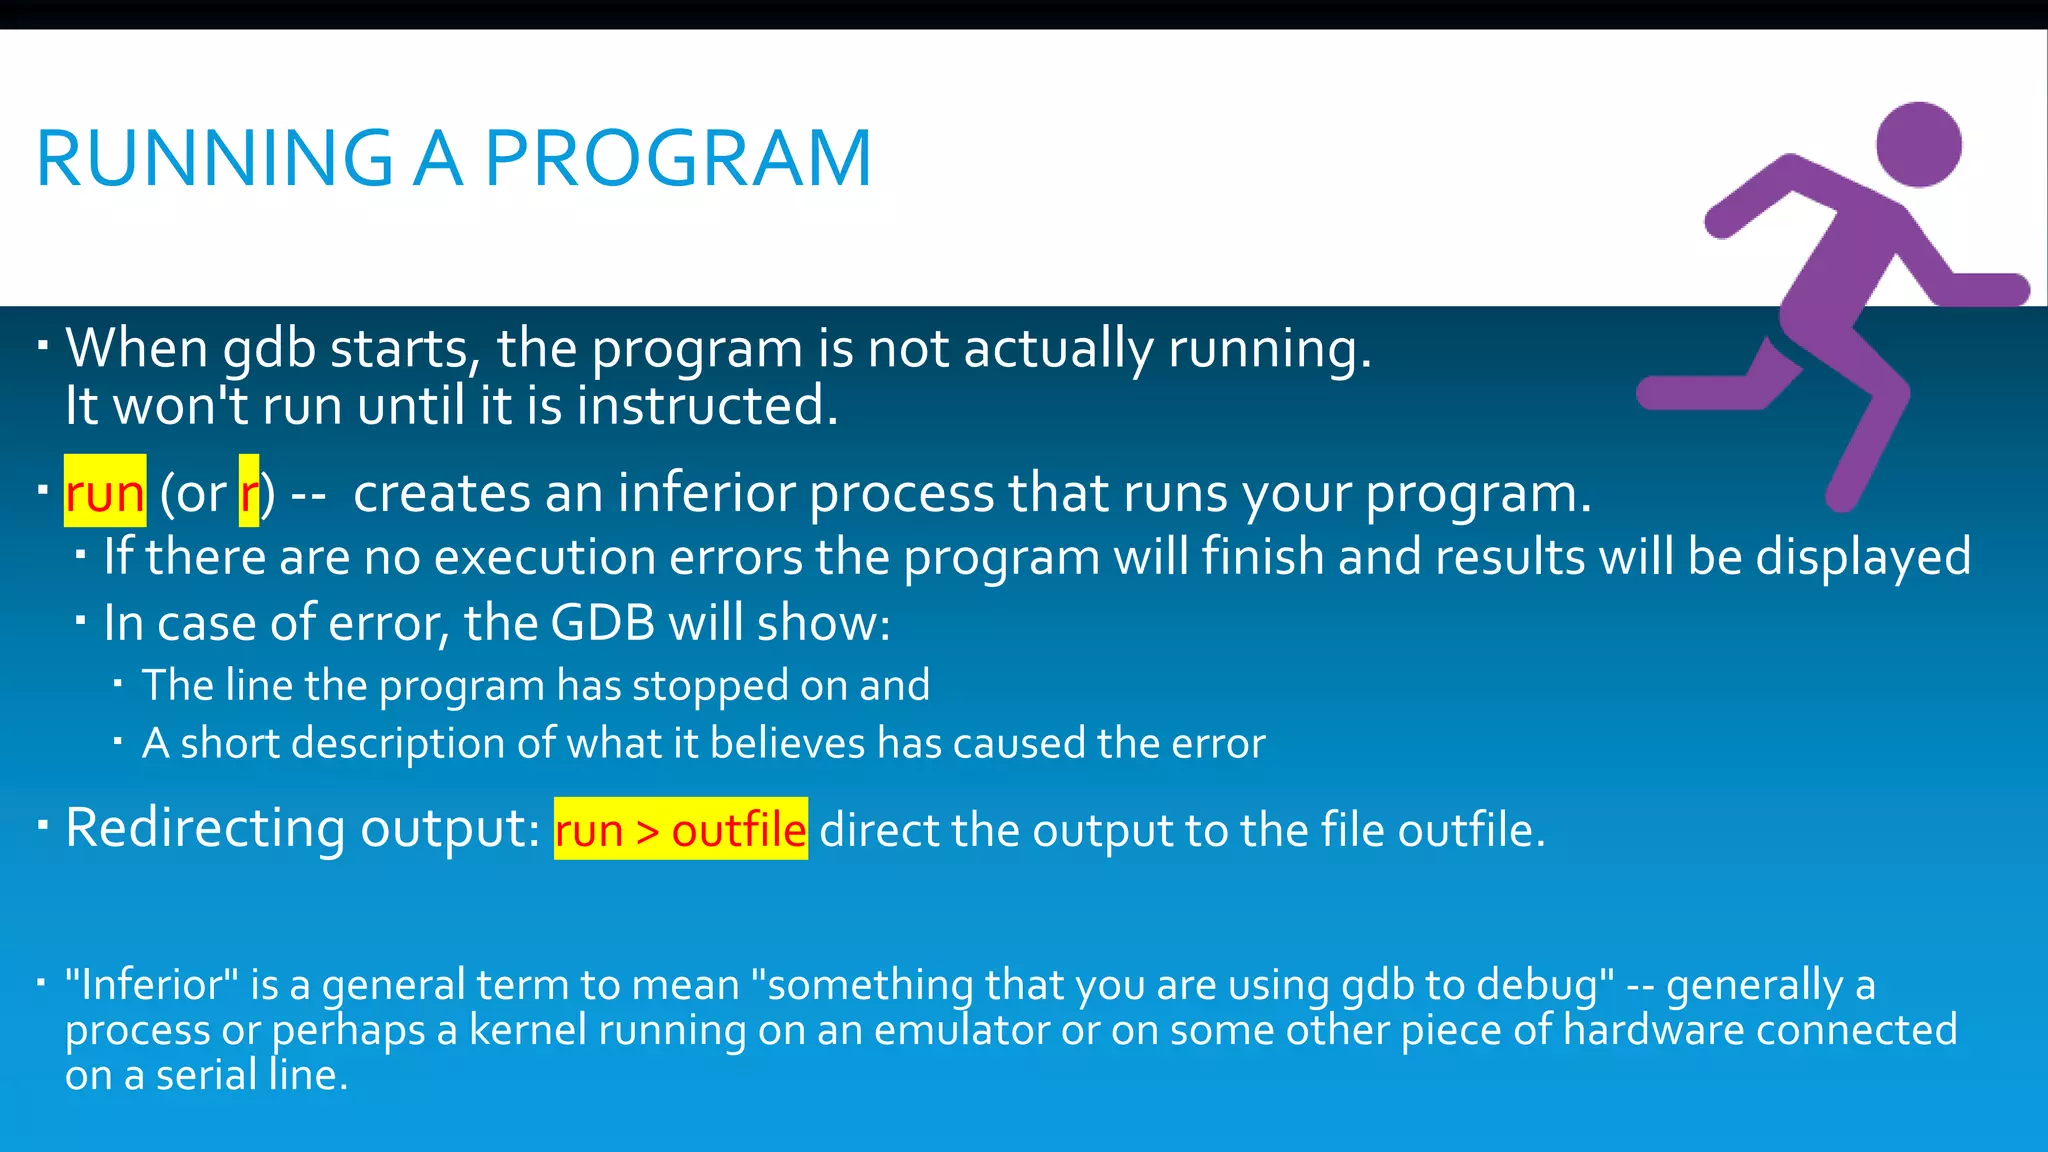
run arglist
run
run . . . <inf >outf
k i l l
start your program with arglist
start your program with current argument
list
start your program with input, output
redirected
kill running program
t t y dev
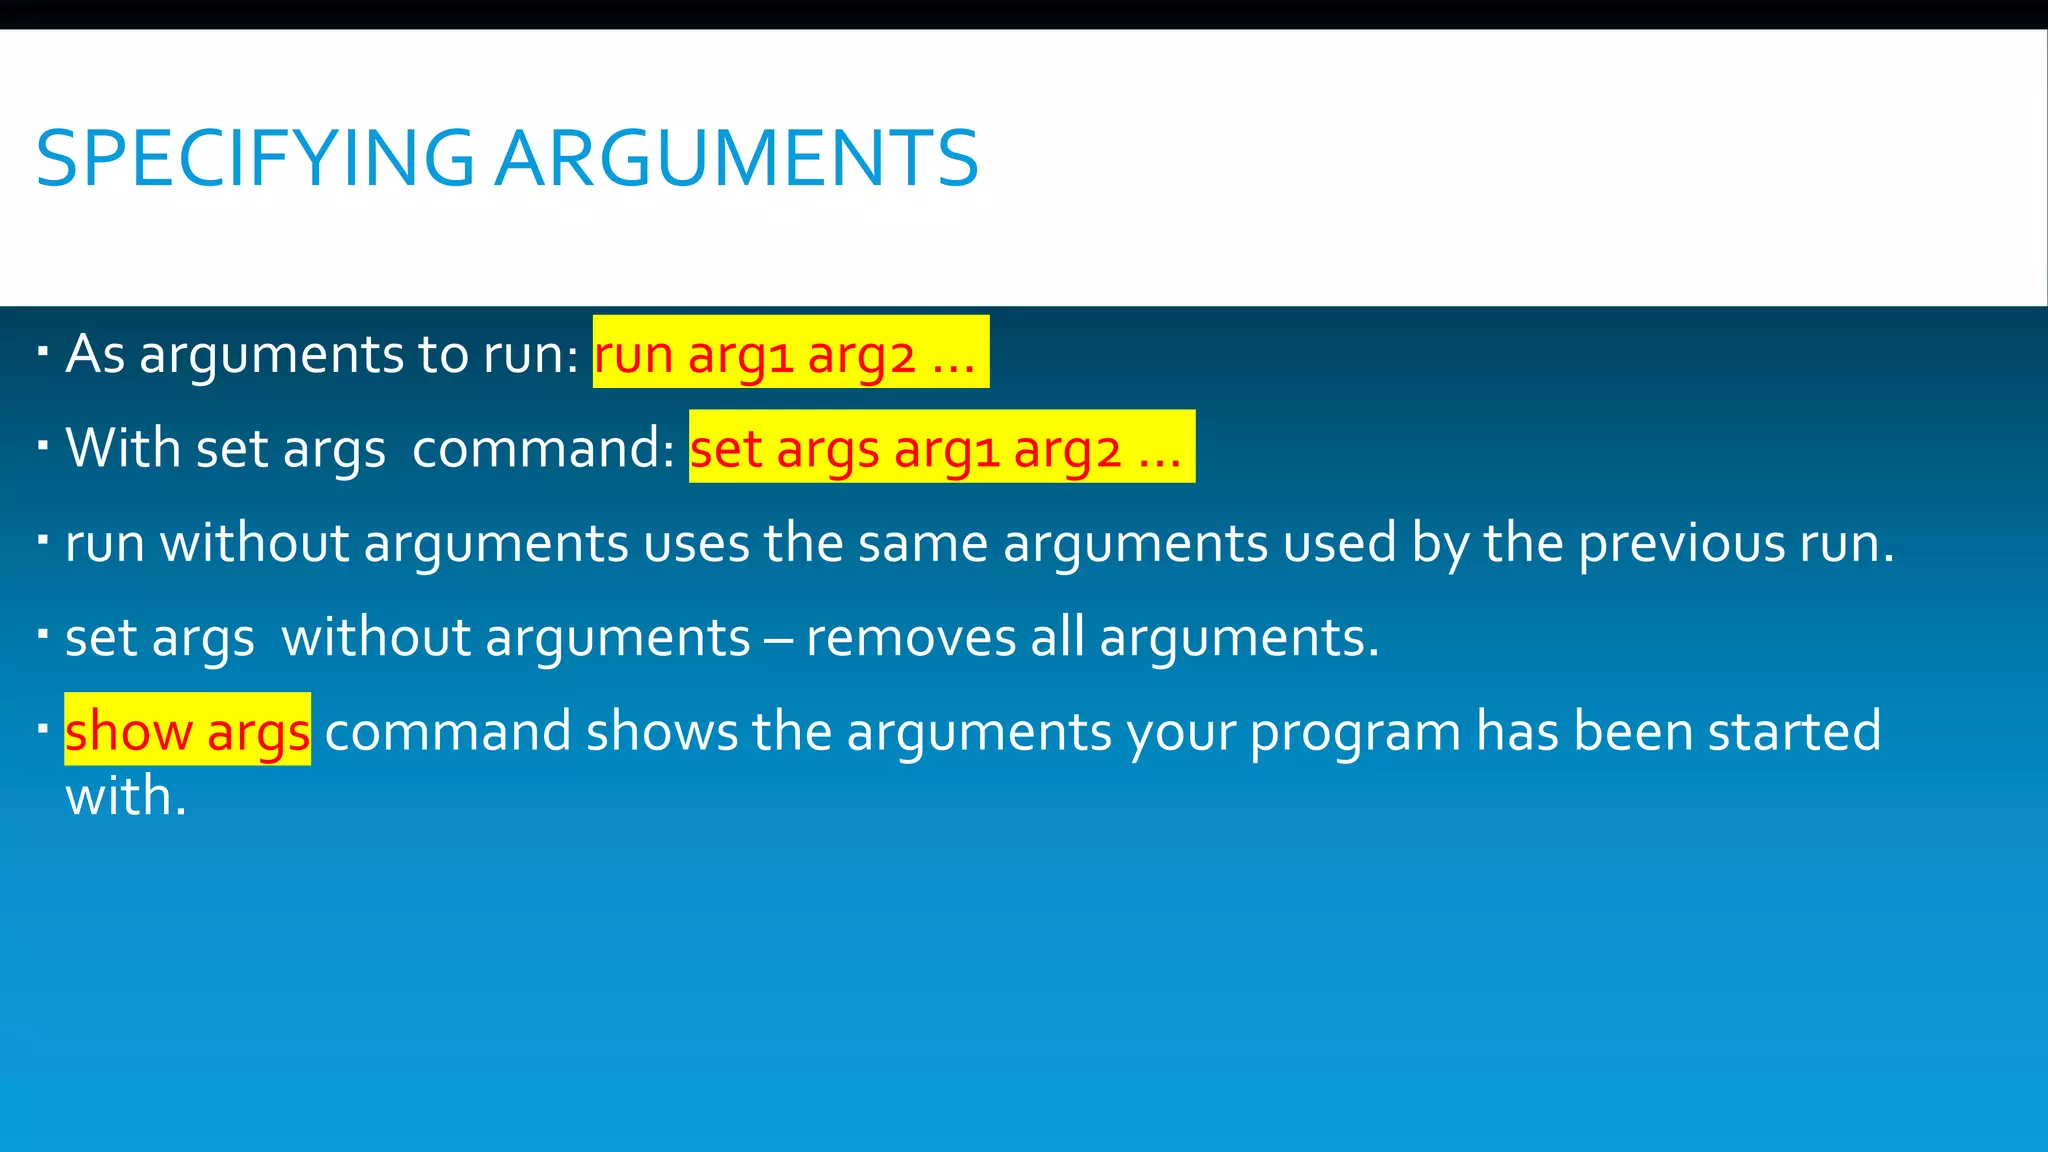
s et args arglist
s et args
show args
use dev as stdin and stdout for next run
specify arglist for next run
specify empty argument list
display argument list
show env
show env var
s et env var string
unset env var
show all environment variables
show value of environment variable var
set environment variable var
remove var from environment
Shell Commands
cd dir
pwd
make . . .
shell cmd
change working directory to dir
Print working directory
call “make”
execute arbitrary shell command string
[ ] surround optional arguments . . . show one or more arguments
§c1998 Free Software Foundation, Inc. Permissions on back
Breakpoints and Watchpoints
set breakpoint at line number [in file]
eg: break main.c:37
set breakpoint at func [in file]
set break at offset lines from current stop
break [file:]line
b [file:]line
break [file:]func
break +offset
break -offset
break *addr
break
break . . . i f expr
cond n [expr]
tbreak . . .
rbreak regex
watch expr
catch event
info break
info watch
set breakpoint at address addr
set breakpoint at next instruction
break conditionally on nonzero expr
new conditional expression on breakpoint
n; make unconditional if no expr
temporary break; disable when reached
break on all functions matching regex
set a watchpoint for expression expr
break at event, which may be catch,
throw, exec, fork, vfork, load, or
unload.
show deftned breakpoints
show deftned watchpoints
clear
clear [file:]fun
clear [file:]line
delete [n]
disable [n]
enable [n]
enable once [n]
enable del [n]
ignore n count
delete breakpoints at next instruction
delete breakpoints at entry to fun()
delete breakpoints on source line
delete breakpoints [or breakpoint n]
disable breakpoints [or breakpoint n]
enable breakpoints [or breakpoint n]
enable breakpoints [or breakpoint n];
disable again when reached
enable breakpoints [or breakpoint n];
delete when reached
ignore breakpoint n, count times
commands n
[silent]
command-list
execute GDB command-list every time
end
breakpoint n is reached. [silent
suppresses default display]
end of command-list
print trace of all frames in stack; or of n
frames—innermost if n>0, outermost if
n<0
select frame number n or frame at address
n; if no n, display current frame
select frame n frames up
select frame n frames down
describe selected frame, or frame at addr
arguments of selected frame
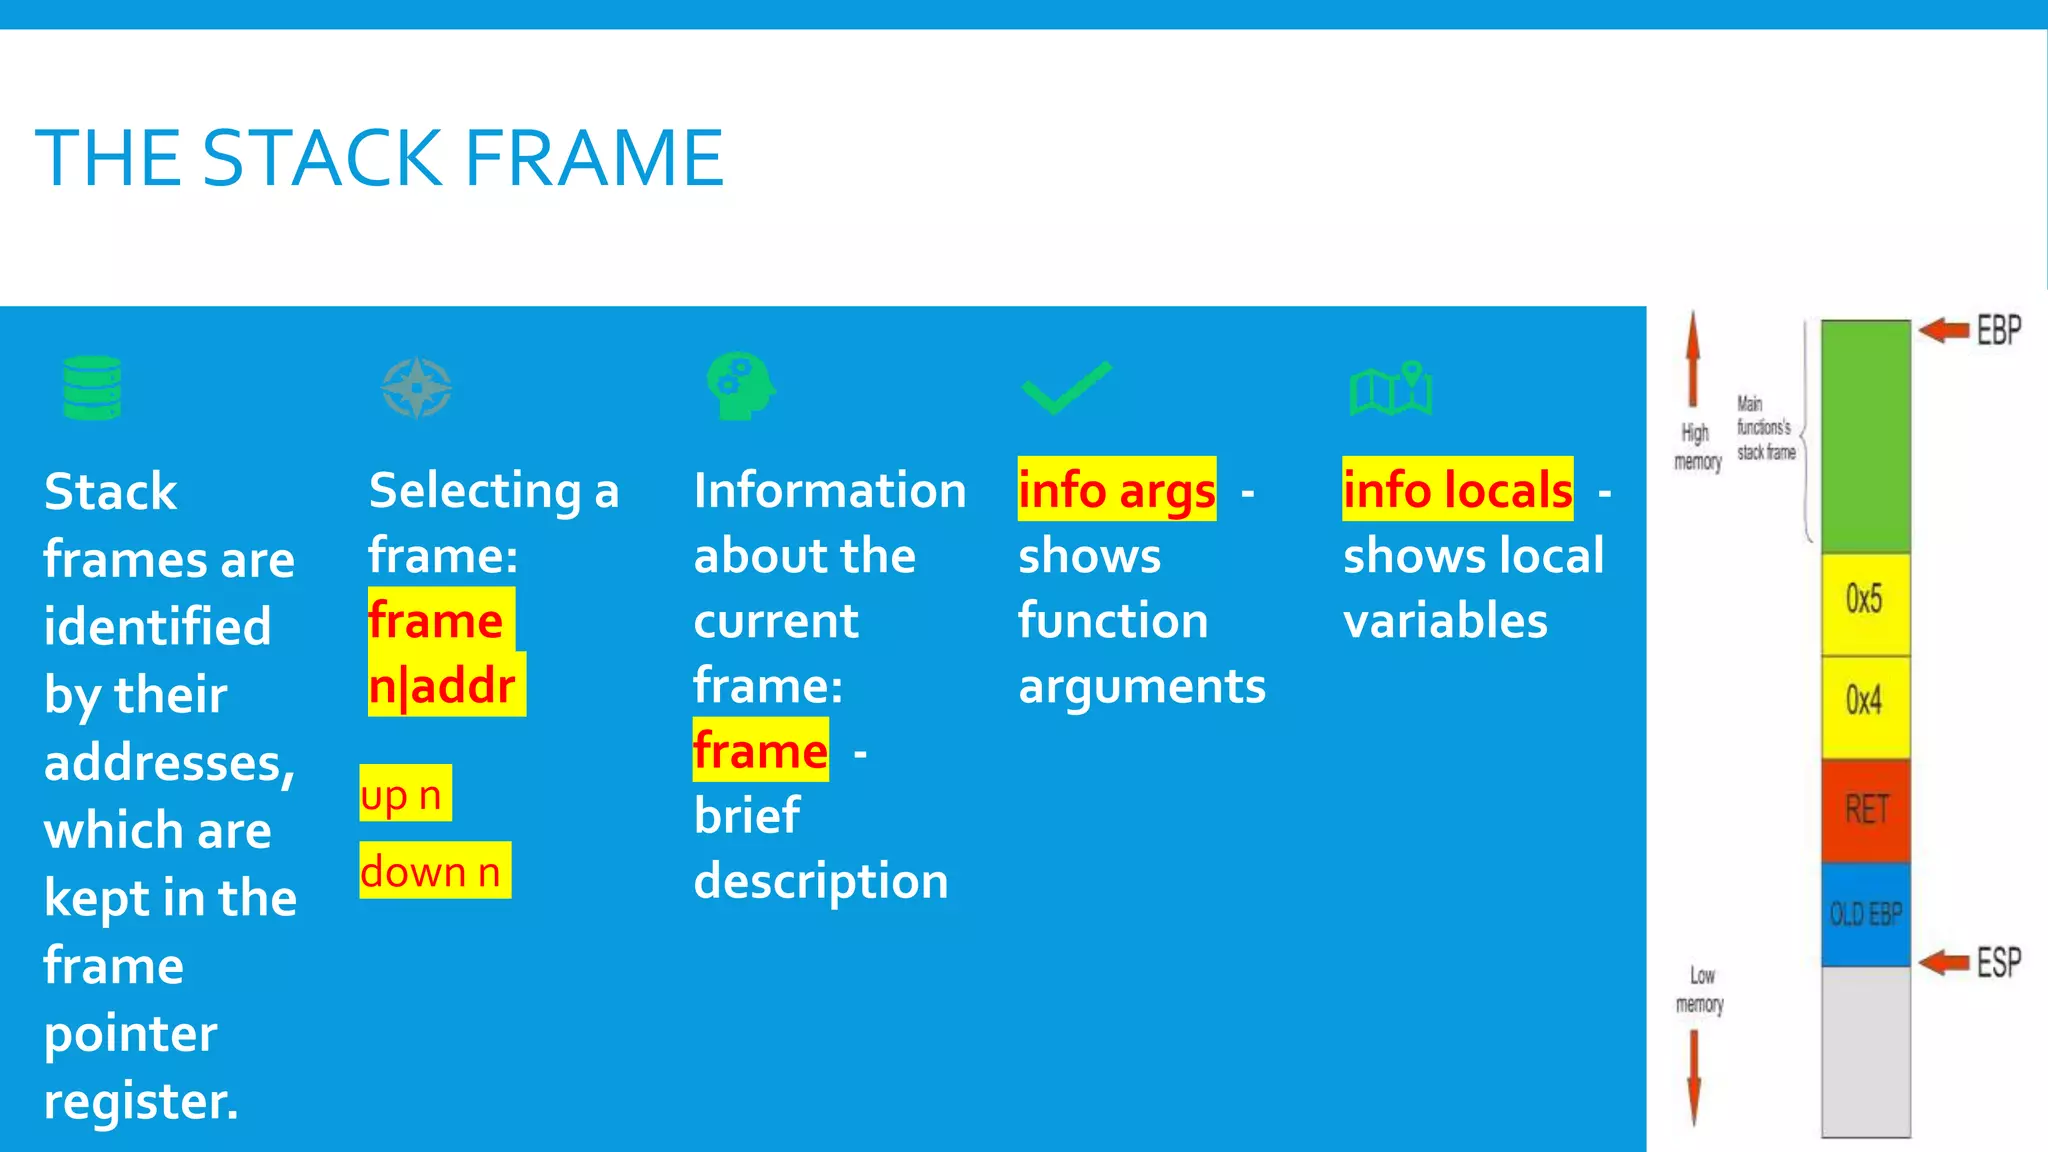
Program Stack
backtrace [n]
bt [n]
frame [n]
up n
down n
info frame [addr]
info args
info locals
info reg [rn]. ..
info all-r eg [rn]
local variables of selected frame register
values [for regs rn] in selected
frame; all-r eg includes floating point
Execution Control
continue running; if count specifted, ignore
this breakpoint next count times
execute until another line reached; repeat
count times if specifted
step by machine instructions rather than
source lines
execute next line, including any function
calls
next machine instruction rather than
source line
run until next instruction (or location)
run until selected stack frame returns
continue [count]
c [count]
step [count]
s [count]
stepi [count]
s i [count]
next [count]
n [count]
nexti [count]
ni [count]
u n til [location]
finish
return [expr] pop selected stack frame without
signal num
jump line
jump *address
s et var=expr
executing [setting return value]
resume execution with signal s (none if 0)
resume execution at specifted line number
or address
evaluate expr without displaying it; use
for altering program variables
Display
print [/f ] [expr]
p [/f ][expr]
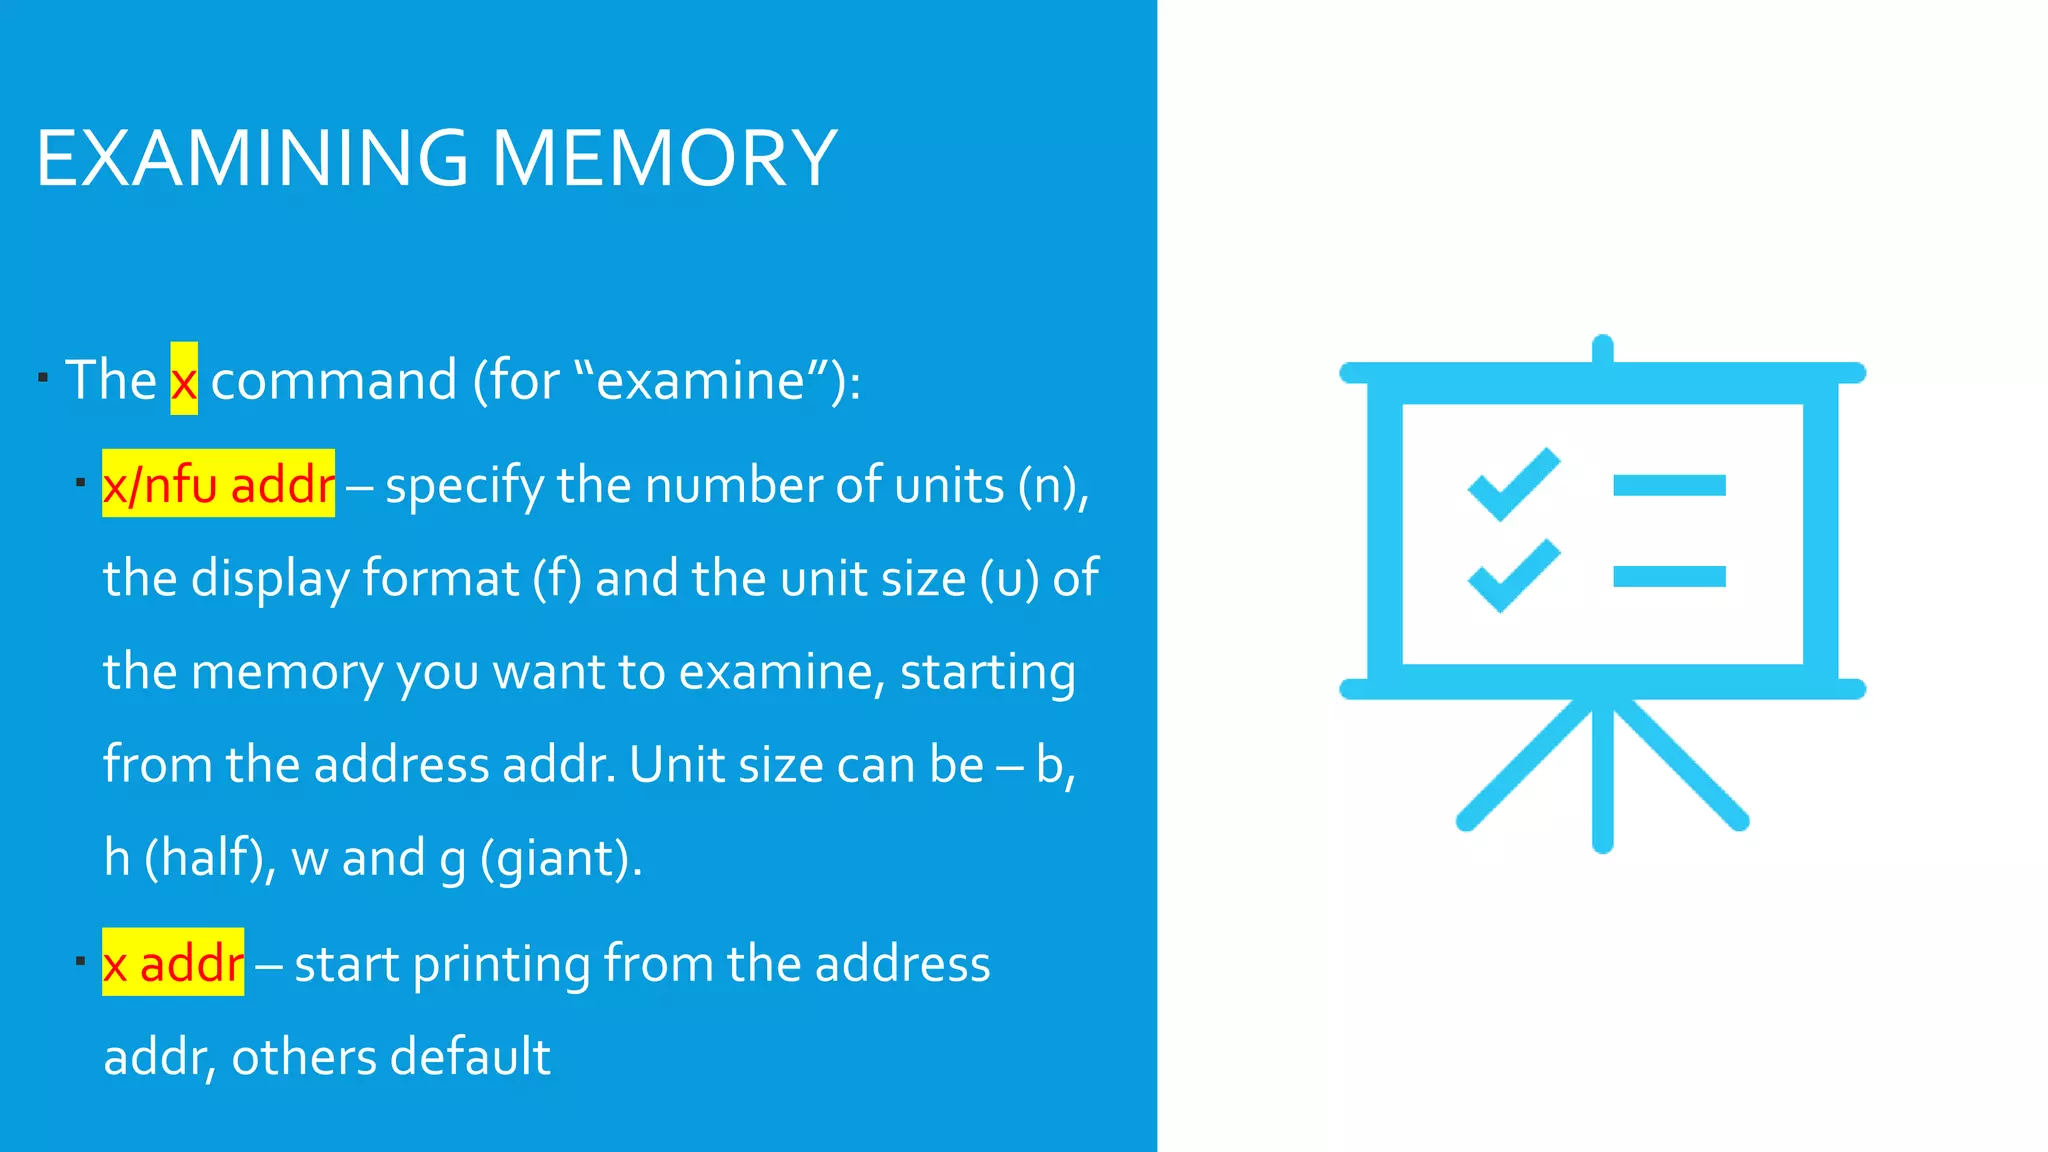
x
d
u
o
t
a
c
f
c a ll [/f ] expr
x [/Nuf ] expr
N
u
f
disassem [addr]
show value of expr [or last value $]
according to format f:
hexadecimal
signed decimal
unsigned decimal
octal
binary
address, absolute and relative
character
floating point
like print but does not display void
examine memory at address expr; optional
format spec follows slash
count of how many units to display
unit size; one of
b individual bytes
h halfwords (two bytes)
wwords (four bytes)
g giant words (eight bytes)
printing format. Any print format, or
s null-terminated string
i machine instructions
display memory as machine instructions
Automatic Display
display [/f ] expr show value of expr each time program
stops [according to format f ]
display
undisplay n
disable disp n
enable disp n
info display
display all enabled expressions on list
remove number(s) n from list of
automatically displayed expressions
disable display for expression(s) number n
enable display for expression(s) number n
numbered list of display expressions](https://image.slidesharecdn.com/gdb-191114221051/75/Debugging-Modern-C-Application-with-Gdb-63-2048.jpg)
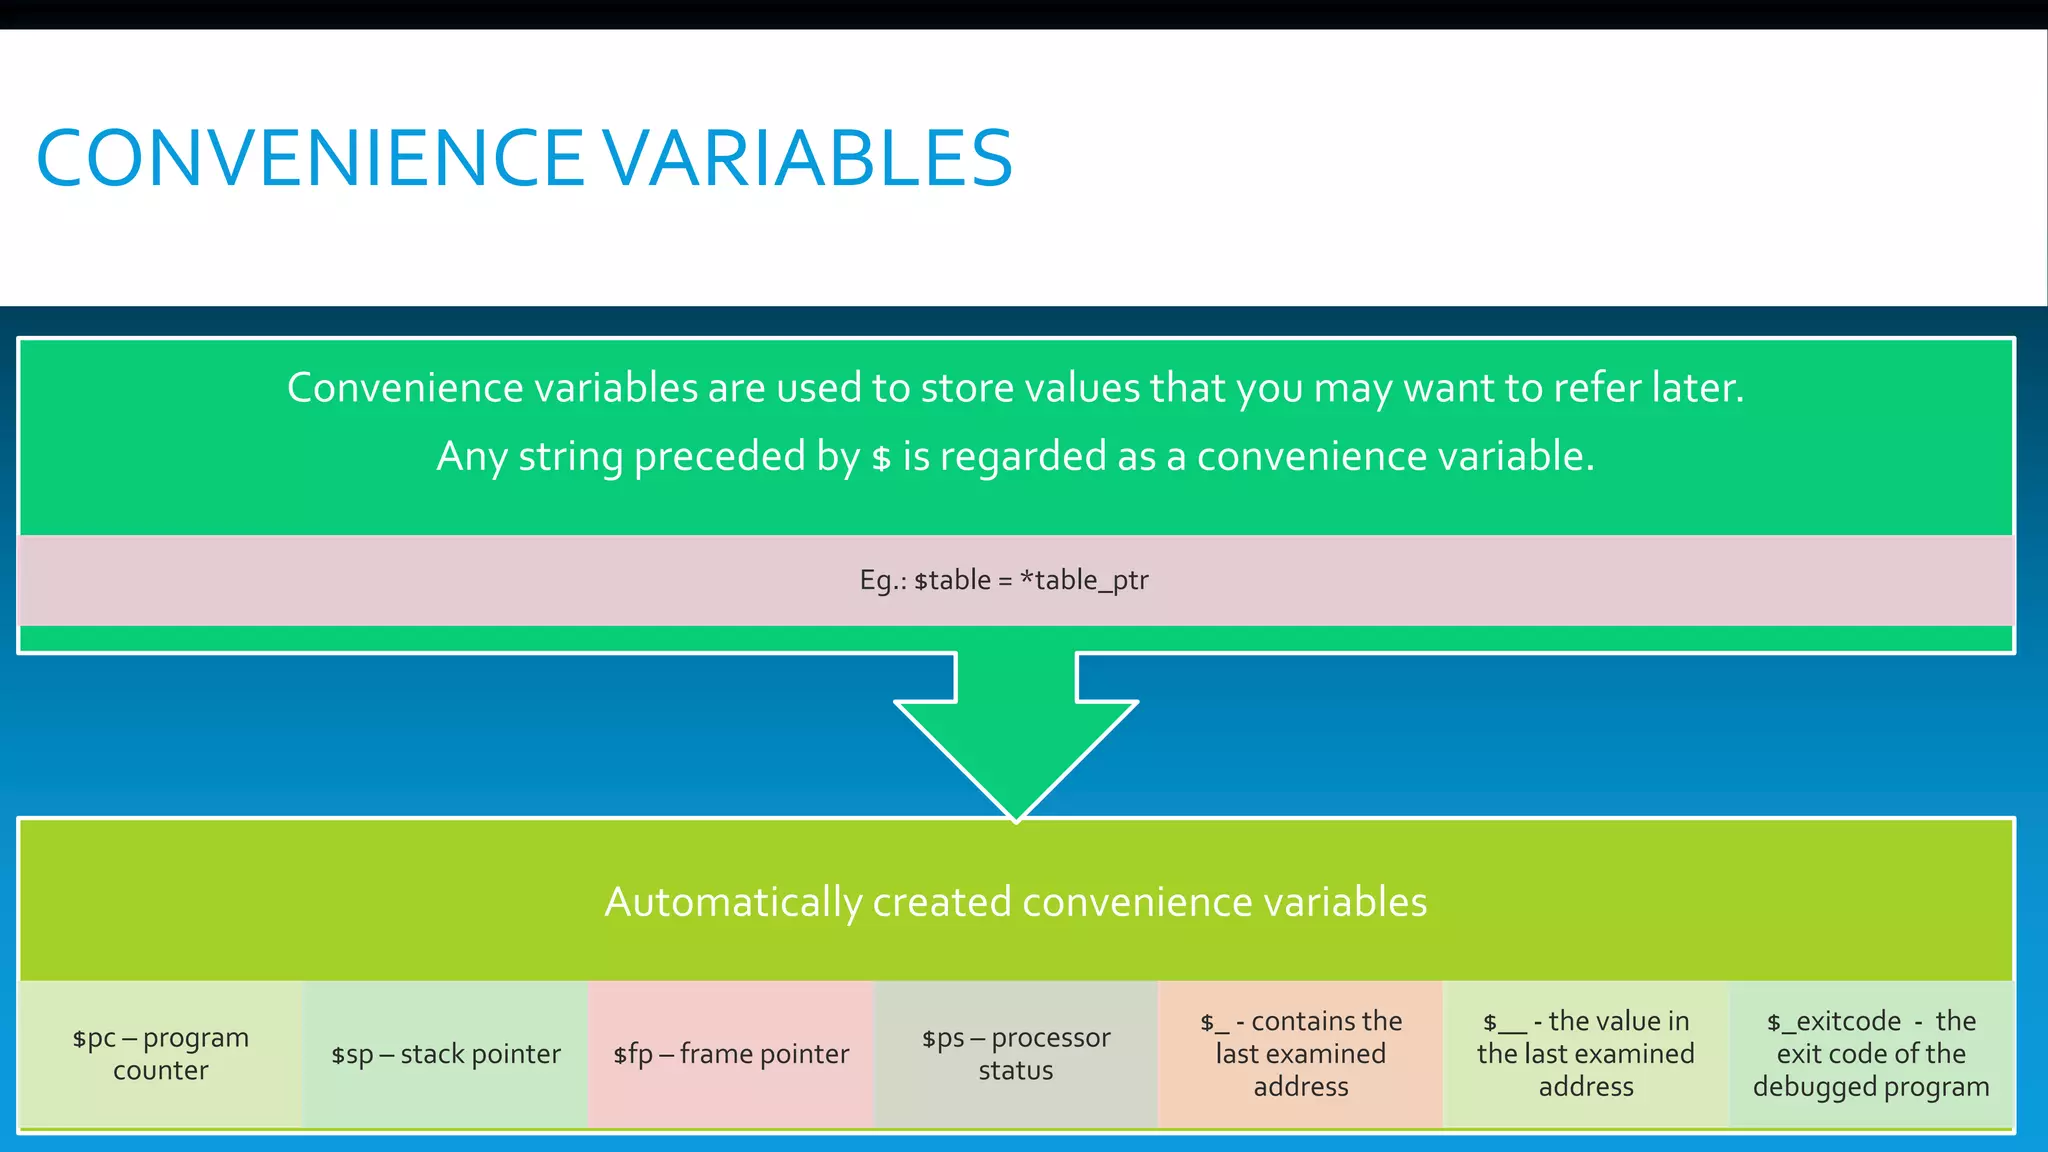
![Expressions
expr
addr@len
file: : nm
{type}addr
$
$n
$$
$$n
$
$
$var
an expression in C, C + + , or Modula-2
(including function calls), or:
an array of len elements beginning at
addr
a variable or function nm deftned in file
read memory at addr as specifted type
most recent displayed value
nth displayed value
displayed value previous to $
nth displayed value back from $
last address examined with x
value at address $
convenience variable; assign any value
show values [n]
show conv
show last 10 values [or surrounding $n]
display all convenience variables
Symbol Table
info address s
info func [regex]
info var [regex]
whatis [expr]
ptype [expr]
ptype type
show where symbol s is stored
show names, types of deftned functions
(all, or matching regex)
show names, types of global variables (all,
or matching regex)
show data type of expr [or $] without
evaluating; ptype gives more detail
describe type, struct, union, or enum
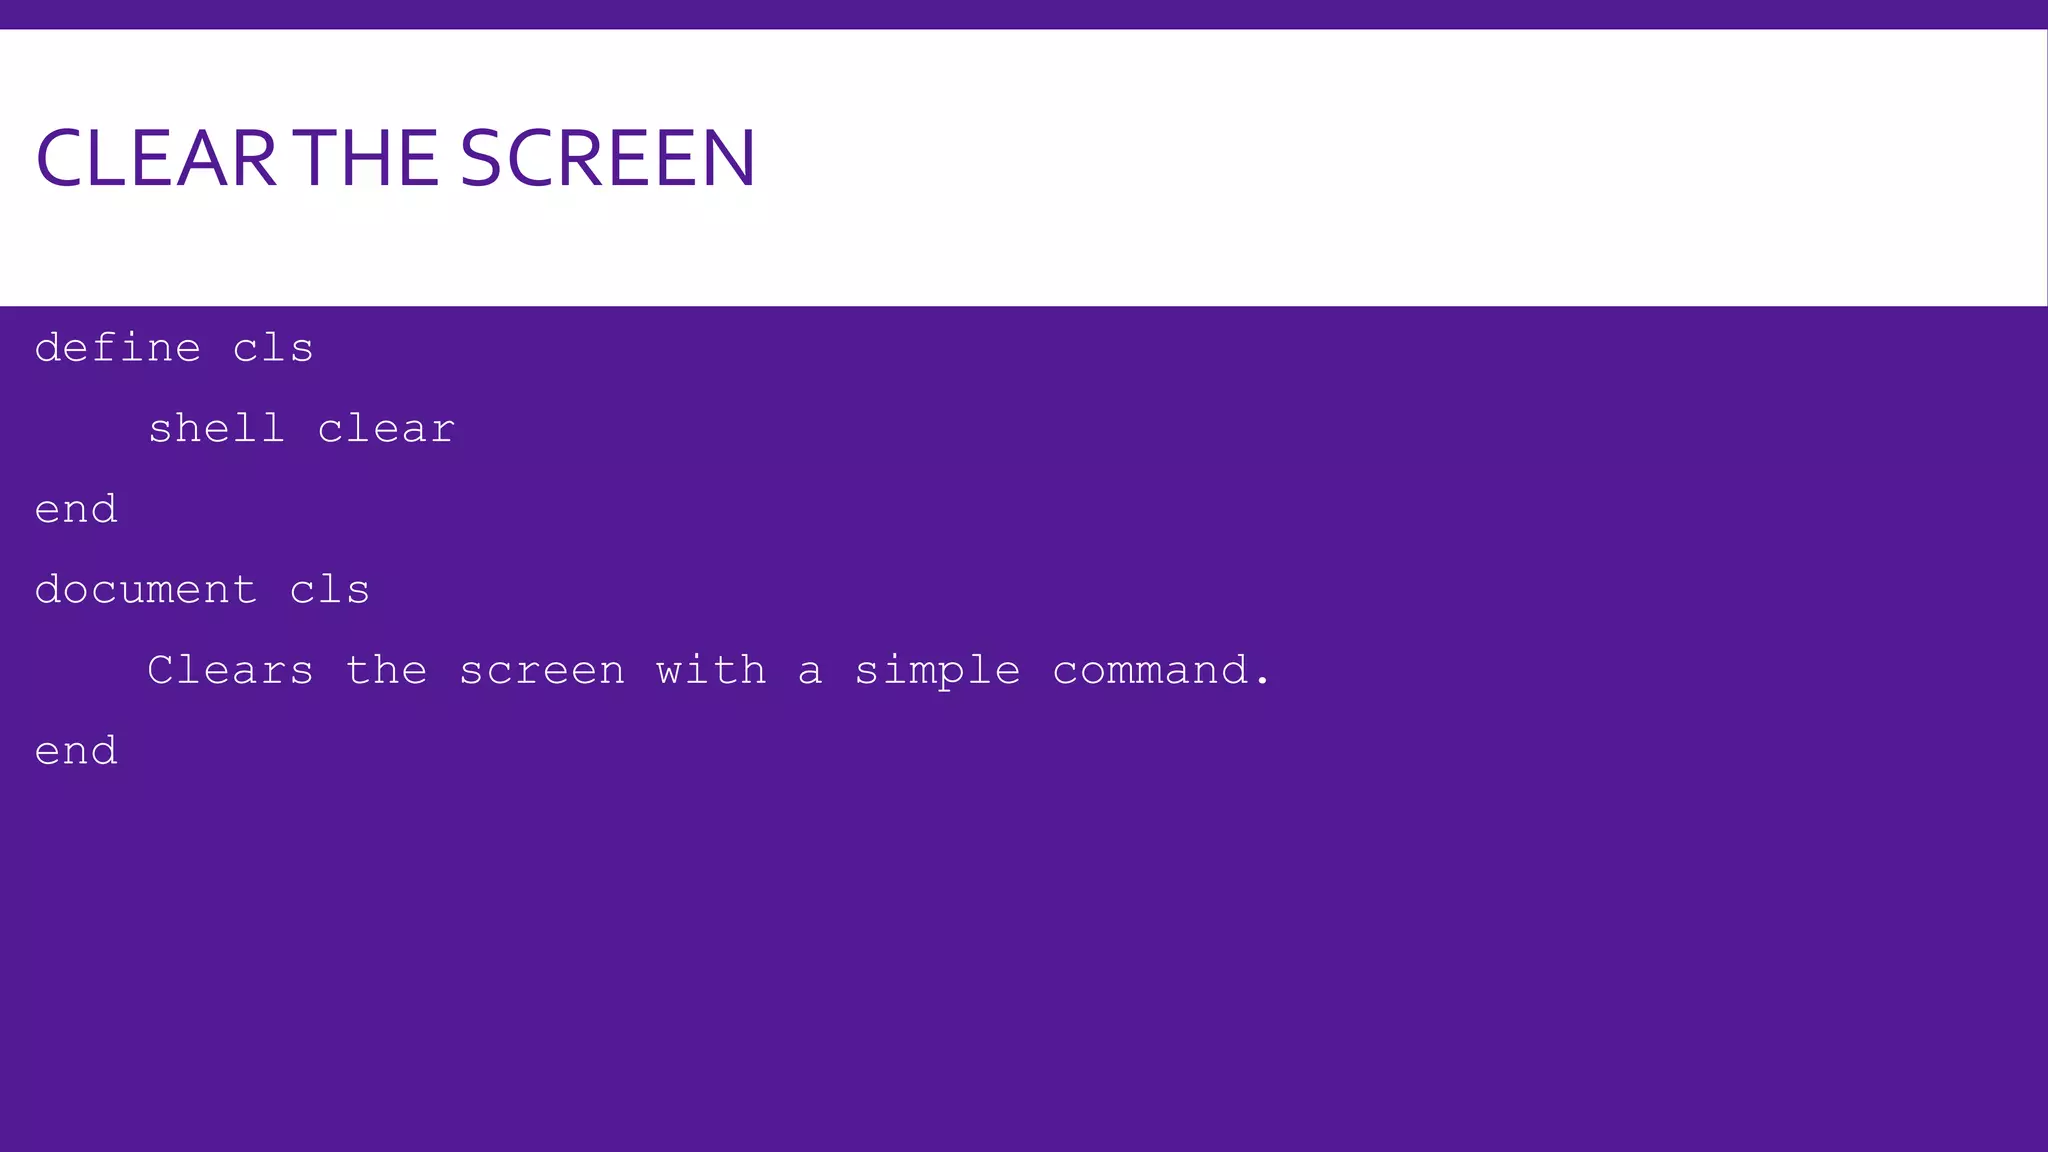
GDB Scripts
source script read, execute GDB commands from ftle
script
define cmd
command-list
end
document cmd
help-text
end
create new GDB command cmd; execute
script deftned by command-list
end of command-list
create online documentation for new GDB
command cmd
end of help-text
Signals
handle signal act
print
noprint
stop
nostop
pass
nopass
info signals
specify GDB actions for signal:
announce signal
be silent for signal
halt execution on signal
do not halt execution
allow your program to handle signal
do not allow your program to see signal
show table of signals, GDB action for each
Debugging Targets
target type param connect to target machine, process, or ftle
help target
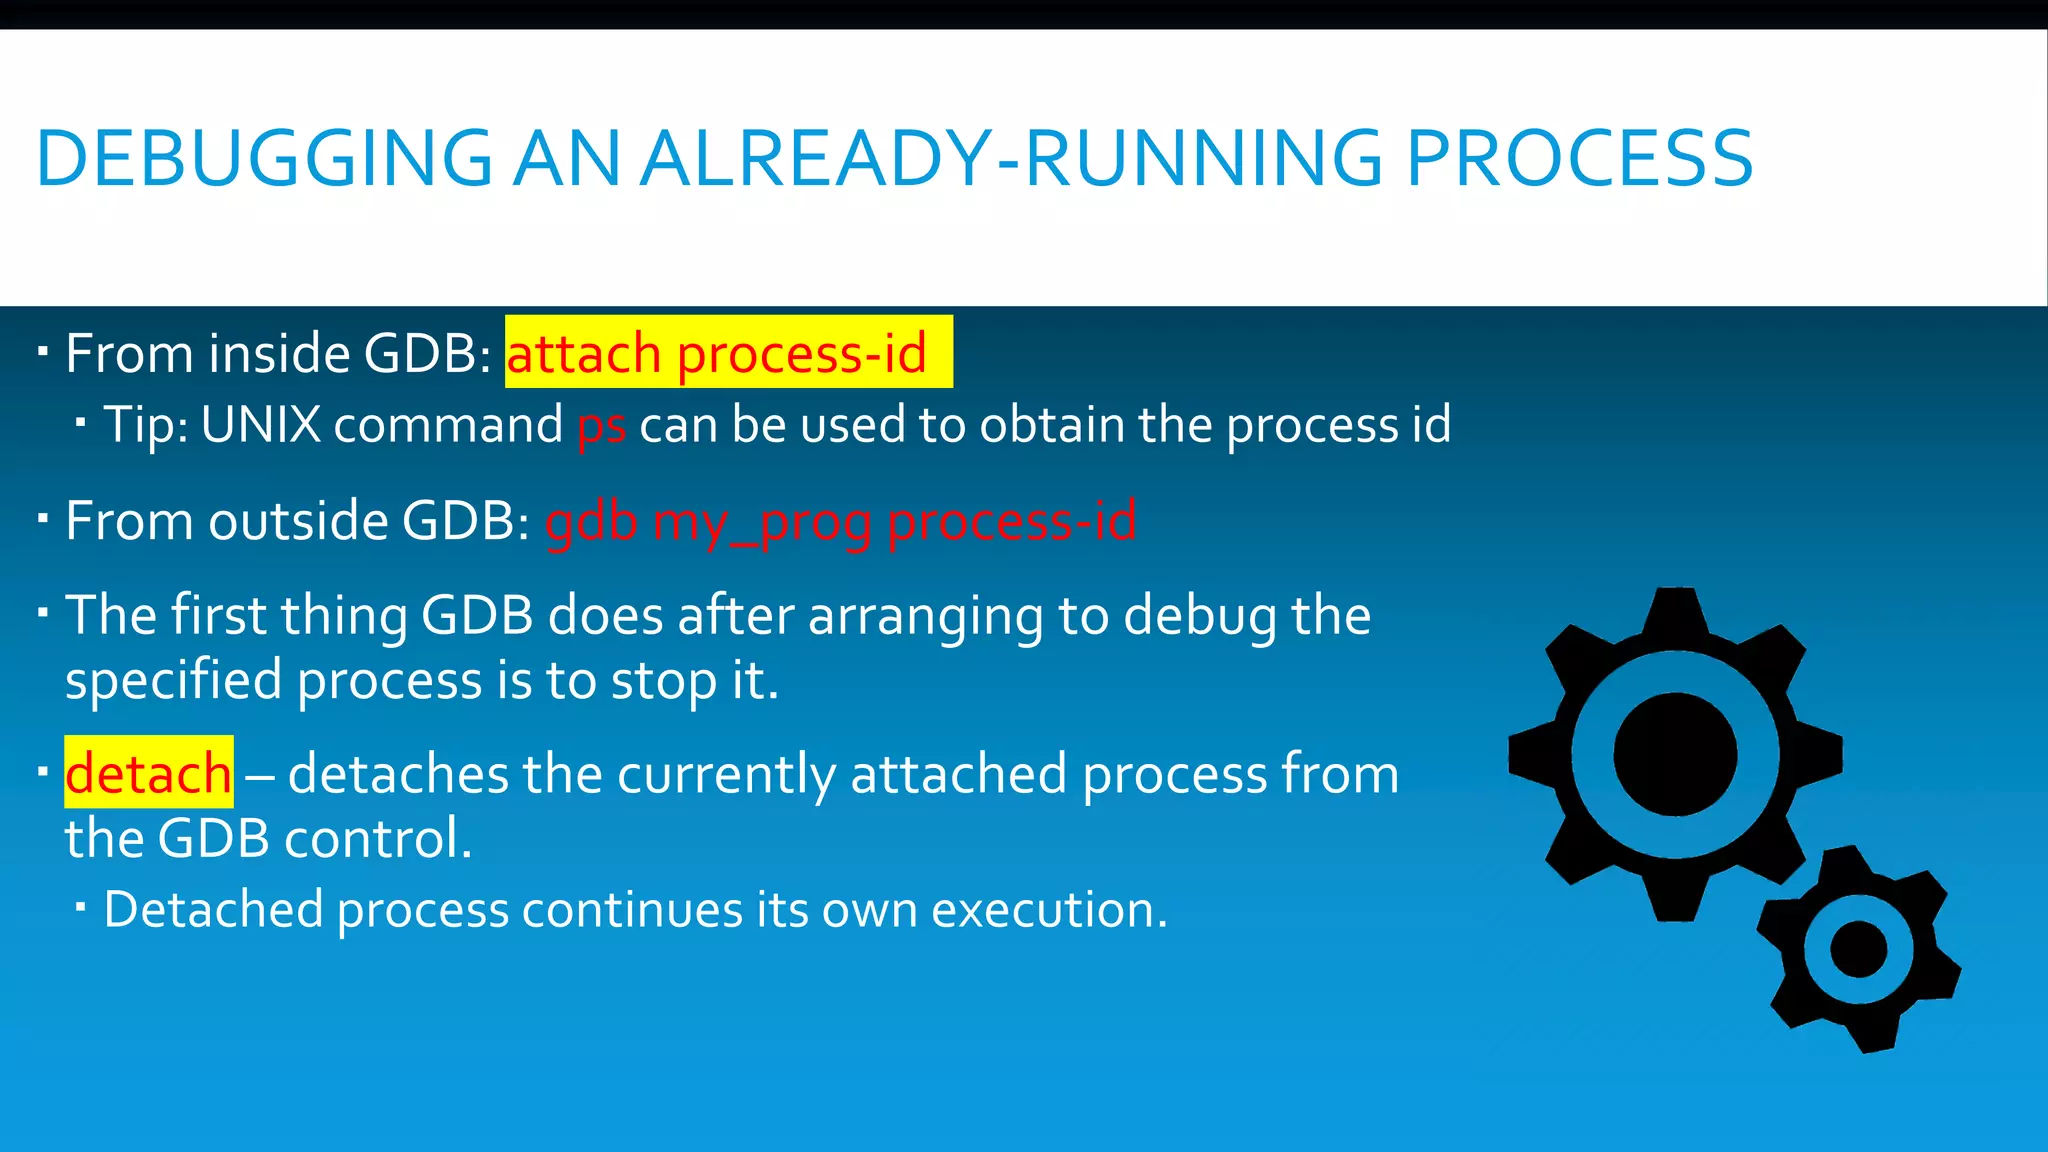
attach param
detach
display available targets
connect to another process
release target from GDB control
Controlling G DB
s et param value
show param
set one of GDB’s internal parameters
display current setting of parameter
Parameters understood by s et and show:
complaint limit
confirm on/off
editing on/off
height lpp
language lang
li s t s i z e n
prompt str
radix base
verbose on/off
width cpl
write on/off
number of messages on unusual symbols
enable or disable cautionary queries control
readline command-line editing number of
lines before pause in display Language for
GDB expressions (auto, c or
modula-2)
number of lines shown by l i s t
use str as GDB prompt
octal, decimal, or hex number
representation
control messages when loading symbols
number of characters before line folded
Allow or forbid patching binary, core ftles
(when reopened with exec or core)
groups with the following options:history . ..
h . ..
h exp off/on
h f i l e filename
h size size
h save off/on
print . ..
p . ..
disable/enable readline history expansion
ftle for recording GDB command history
number of commands kept in history list
control use of external ftle for command
history
groups with the following options:
p address on/off print memory addresses in stacks, values p
array off/on compact or attractive format for arrays p
demangl on/off source (demangled) or internal form for
C + + symbols
p asm-dem on/off demangle C + + symbols in machine-
instruction output
p elements limit number of array elements to display
p object on/off
p pretty off/on
p union on/off
p vtbl off/on
print C + + derived types for objects
struct display: compact or indented
display of union members
display of C + + virtual function tables
show commands
show commands n
show commands +
show last 10 commands
show 10 commands around number n
show next 10 commands
Working Files
f i l e [file]
core [file]
exec [file]
symbol [file]
load file
add-sym file addr
info f i le s
path dirs
show path
info share
use file for both symbols and executable;
with no arg, discard both
read file as coredump; or discard
use file as executable only; or discard
use symbol table from file; or discard
dynamically link file and add its symbols
read additional symbols from file,
dynamically loaded at addr
display working ftles and targets in use
add dirs to front of path searched for
executable and symbol ftles
display executable and symbol ftle path
list names of shared libraries currently
loaded
Source Files
d ir names
d ir
show d ir
add directory names to front of source
path
clear source path
show current source path
l i s t
l i s t -
l i s t lines
[file:]num
[file: ]function
+off
-off
*address
l i s t f,l
info line num
info source
info sources
forw regex
rev regex
show next ten lines of source
show previous ten lines
display source surrounding lines, specifted
as:
line number [in named ftle]
beginning of function [in named ftle]
off lines after last printed
off lines previous to last printed
line containing address
from line f to line l
show starting, ending addresses of
compiled code for source line num
show name of current source ftle
list all source ftles in use
search following source lines for regex
search preceding source lines for regex
G DB under GNU Emacs
M-x gdb
C-h m
M-s
M-n
M-i
C-c C-f
M-c
M-u
M-d
C-x &
C-x SPC
run GDB under Emacs
describe GDB mode
step one line (step)
next line (next)
step one instruction (stepi)
ftnish current stack frame (finish)
continue (cont)
up arg frames (up)
down arg frames (down)
copy number from point, insert at end
(in source ftle) set break at point
G DB License
show copying
show warranty
Display GNU General Public License
There is NO W ARRANTY for GDB.
Display full no-warranty statement.
Copyright §c 1991, ’92, ’93, ’98 Free Software Foundation, Inc.
Rol a nd H. Pesch
The author assumes no responsibility for any errors on this card.
This card ma y b e freely distribut ed under t he t er ms of t he G N U
General Public License.
Please contribute t o development of this card by annotating it.
Improvements can b e sent t o bug-gdb@gnu.org.
G D B itself is free software; you are welcome t o distribute copies of it
under t he t er ms of t he G N U General Public License. There is
absolutely no warranty for G D B.](https://image.slidesharecdn.com/gdb-191114221051/75/Debugging-Modern-C-Application-with-Gdb-64-2048.jpg)


The document provides an overview of using the GNU Debugger (GDB) to debug C/C++ programs. It discusses starting GDB and loading symbol tables, setting breakpoints and watchpoints, running and attaching to programs, and examining variables. The key principles of debugging with GDB are stepping through code, breaking execution at specific points, and inspecting program state to methodically isolate bugs.