SlideShare a Scribd company logo
1 of 33
Download to read offline
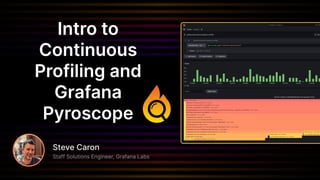
Intro to
Continuous
Profiling and
Grafana
Pyroscope
Steve Caron
Staff Solutions Engineer, Grafana Labs
Once upon a time...
M
L
T
M was relying on Metrics
L was relying on Logs
T was relying on Traces
Image credit: Oliver The Mighty Pig, Penguin Publishing Group ISBN:0803728867
Mighty P was using Profiling
...and spewing out flame graphs
flame graph
Error logs pinpoint
user issue
Traces
Metrics Logs
Unexpected
cpu spike
Profiles
Anomalous span
reveals error cluster
Code level root cause
Profiling completes the story of
why something went wrong and how to fix it
What is Profiling?
“Profiling” is a way to analyze how a program uses resources like CPU or
memory at code-level granularity. It makes use of flamegraphs to help you
pinpoint the parts of your application that use the most resources.
Commonly used during application development, built into popular IDEs.
Challenges:
● The overhead of conventional profiles don’t allow for profiling in
production
● On-demand profiling is a reactive approach
● Development environments don’t accurately mimic production.
What changed?
Profiling technology has advanced. The overhead of today’s profiling
technologies allows for it to run in production, with minimal overhead.
This allows for “Continuous profiling” which is a more powerful version of
profiling which profiles applications periodically, adding the dimension of time.
By understanding your system’s resource usage over time, you can then
locate, debug, and fix issues related to performance.
Cost cutting
Getting a line-level
breakdown of where
resource hotspots are
allows you to optimize
them
The value of Continuous Profiling
Latency
reduction
Incident
resolution
For many businesses
performance impact
revenue
- e-commerce, ads
- gaming, streaming
- HFT, fintech
- rideshare
Pinpoint memory leaks
to specific parts of the
code
See root cause of CPU
spikes
See code level details
when debugging services
How to gather a profile?
● Instrumenting the code base
○ Tooling and formats depending on each language ecosystem
○ Access to more detailed runtime information
○ More flexibility:
■ selectively profile and label specific sections of code
■ send profiles at different intervals
(further read: eBPF pros/cons)
● eBPF based collection
○ No insights into stacktrace runtime information for interpreted languages
(better fit for compiled languages)
○ Focus on CPU profiling
○ Live profiling: doesn’t require code change or even restarts
○ Kernel dependencies (v4.9 or more recent) and requires root access
How to gather a profile? Let’s take a look at Go
● Standard library includes CPU, Memory, Goroutine, Mutex and Block
resources
● Provides profiles using a HTTP interface
○ Profiling data is returned using protobuf definition
● Data meant to be consumed by the pprof CLI
○ # Get a CPU profile over the last 2 seconds
$ pprof "http://localhost:6060/debug/pprof/profile?seconds=2"
# Get the heap memory allocations
$ pprof "http://localhost:6060/debug/pprof/allocs"
○ Common to use the -http parameter to view profiles using the web interface
● Find more on Profiling in Go on https://pkg.go.dev/runtime/pprof#Profile
Instrumentation of Go code
package main
import (
"log"
"net/http"
_ "net/http/pprof"
"time"
)
func main() {
go func() {
log.Println(http.ListenAndServe("localhost:6060", nil))
}()
// spend 3 cpu cycles
doALot()
doLittle()
}
[...]
What is measured in a profile?
package main
func main() {
// work
doALot()
doLittle()
}
func prepare() {
// work
}
func doALot() {
prepare()
// work
}
func doLittle() {
prepare()
// work
}
What is measured in a profile? Time on CPU
Each measurement gets recorded on a stack-trace level
package main
func main() {
// spend 3 cpu cycles
doALot()
doLittle()
}
func prepare() {
// spend 5 cpu cycles
}
func doALot() {
prepare()
// spend 20 cpu cycles
}
func doLittle() {
prepare()
// spend 5 cpu cycles
}
main() 3
main() > doALot() > prepare() 5
main() > doALot() 20
main() > doLittle() > prepare() 5
main() > doLittle()
5
Visualization of Profiles (try it yourself: flamegraph.com)
Flamegraph
● Whole width represent the total resources used (over
the whole measurement duration)
● Ability to spot higher usage nodes
● Colours are grouped based on package
package main
func main() {
// spend 3 cpu cycles
doALot()
doLittle()
}
func prepare(x) {
// spend 5 cpu cycles
}
func doALot(65) {
prepare(65)
// spend 20 cpu cycles
}
func doLittle(26) {
prepare(26)
// spend 5 cpu cycles
}
What does “continuous profiling” look like?
Resource usage
over time
Query
Flamegraph & table
What does “continuous profiling” look like?
Grafana Pyroscope
2023: Pyroscope joined Grafana Labs
+
How Pyroscope works?
Pyroscope architecture
What is our product today
Open Source Project
~10,000 combined GitHub ⭐
Commercial Managed Offering
An open source continuous
profiling platform
Grafana Cloud Profiles available in
Grafana Cloud (available with free tier)
● Fully managed Grafana and observability solution
“Rideshare Company” demo app
Demo
Pyroscope resources: client documentation
● Client documentation - how to send profiles to Grafana
More resources
examples in grafana/pyroscope
#pyroscope on https://grafana.slack.com/
📖 https://grafana.com/docs/pyroscope/latest/
https://play.grafana.org/a/grafana-pyroscope-app
Thank you!
Questions?

More Related Content

Similar to [ CNCF Q1 2024 ] Intro to Continuous Profiling and Grafana Pyroscope.pdf

Linux Server Deep Dives (DrupalCon Amsterdam)
Linux Server Deep Dives (DrupalCon Amsterdam)Linux Server Deep Dives (DrupalCon Amsterdam)
Linux Server Deep Dives (DrupalCon Amsterdam)Amin Astaneh
 
Track A-Compilation guiding and adjusting - IBM
Track A-Compilation guiding and adjusting - IBMTrack A-Compilation guiding and adjusting - IBM
Track A-Compilation guiding and adjusting - IBMchiportal
 
Tracing MariaDB server with bpftrace - MariaDB Server Fest 2021
Tracing MariaDB server with bpftrace - MariaDB Server Fest 2021Tracing MariaDB server with bpftrace - MariaDB Server Fest 2021
Tracing MariaDB server with bpftrace - MariaDB Server Fest 2021Valeriy Kravchuk
 
Deep learning - the conf br 2018
Deep learning - the conf br 2018Deep learning - the conf br 2018
Deep learning - the conf br 2018Fabio Janiszevski
 
TIP1 - Overview of C/C++ Debugging/Tracing/Profiling Tools
TIP1 - Overview of C/C++ Debugging/Tracing/Profiling ToolsTIP1 - Overview of C/C++ Debugging/Tracing/Profiling Tools
TIP1 - Overview of C/C++ Debugging/Tracing/Profiling ToolsXiaozhe Wang
 
0100_Embeded_C_CompilationProcess.pdf
0100_Embeded_C_CompilationProcess.pdf0100_Embeded_C_CompilationProcess.pdf
0100_Embeded_C_CompilationProcess.pdfKhaledIbrahim10923
 
Using R on High Performance Computers
Using R on High Performance ComputersUsing R on High Performance Computers
Using R on High Performance ComputersDave Hiltbrand
 
Dynamic tracing of MariaDB on Linux - problems and solutions (MariaDB Server ...
Dynamic tracing of MariaDB on Linux - problems and solutions (MariaDB Server ...Dynamic tracing of MariaDB on Linux - problems and solutions (MariaDB Server ...
Dynamic tracing of MariaDB on Linux - problems and solutions (MariaDB Server ...Valeriy Kravchuk
 
Using eBPF to Measure the k8s Cluster Health
Using eBPF to Measure the k8s Cluster HealthUsing eBPF to Measure the k8s Cluster Health
Using eBPF to Measure the k8s Cluster HealthScyllaDB
 
eBPF Debugging Infrastructure - Current Techniques
eBPF Debugging Infrastructure - Current TechniqueseBPF Debugging Infrastructure - Current Techniques
eBPF Debugging Infrastructure - Current TechniquesNetronome
 
May2010 hex-core-opt
May2010 hex-core-optMay2010 hex-core-opt
May2010 hex-core-optJeff Larkin
 
Fletcher Framework for Programming FPGA
Fletcher Framework for Programming FPGAFletcher Framework for Programming FPGA
Fletcher Framework for Programming FPGAGanesan Narayanasamy
 
Performance Optimization of SPH Algorithms for Multi/Many-Core Architectures
Performance Optimization of SPH Algorithms for Multi/Many-Core ArchitecturesPerformance Optimization of SPH Algorithms for Multi/Many-Core Architectures
Performance Optimization of SPH Algorithms for Multi/Many-Core ArchitecturesDr. Fabio Baruffa
 
Measurement .Net Performance with BenchmarkDotNet
Measurement .Net Performance with BenchmarkDotNetMeasurement .Net Performance with BenchmarkDotNet
Measurement .Net Performance with BenchmarkDotNetVasyl Senko
 
Guider: An Integrated Runtime Performance Analyzer on AGL
Guider: An Integrated Runtime Performance Analyzer on AGLGuider: An Integrated Runtime Performance Analyzer on AGL
Guider: An Integrated Runtime Performance Analyzer on AGLPeace Lee
 
Virtual platform
Virtual platformVirtual platform
Virtual platformsean chen
 
Hands-on go profiling
Hands-on go profilingHands-on go profiling
Hands-on go profilingDaniel Ammar
 

Similar to [ CNCF Q1 2024 ] Intro to Continuous Profiling and Grafana Pyroscope.pdf (20)

Linux Server Deep Dives (DrupalCon Amsterdam)
Linux Server Deep Dives (DrupalCon Amsterdam)Linux Server Deep Dives (DrupalCon Amsterdam)
Linux Server Deep Dives (DrupalCon Amsterdam)
 
Track A-Compilation guiding and adjusting - IBM
Track A-Compilation guiding and adjusting - IBMTrack A-Compilation guiding and adjusting - IBM
Track A-Compilation guiding and adjusting - IBM
 
Multicore
MulticoreMulticore
Multicore
 
Tracing MariaDB server with bpftrace - MariaDB Server Fest 2021
Tracing MariaDB server with bpftrace - MariaDB Server Fest 2021Tracing MariaDB server with bpftrace - MariaDB Server Fest 2021
Tracing MariaDB server with bpftrace - MariaDB Server Fest 2021
 
Deep learning - the conf br 2018
Deep learning - the conf br 2018Deep learning - the conf br 2018
Deep learning - the conf br 2018
 
TIP1 - Overview of C/C++ Debugging/Tracing/Profiling Tools
TIP1 - Overview of C/C++ Debugging/Tracing/Profiling ToolsTIP1 - Overview of C/C++ Debugging/Tracing/Profiling Tools
TIP1 - Overview of C/C++ Debugging/Tracing/Profiling Tools
 
BioMake BOSC 2004
BioMake BOSC 2004BioMake BOSC 2004
BioMake BOSC 2004
 
TAU on Power 9
TAU on Power 9TAU on Power 9
TAU on Power 9
 
0100_Embeded_C_CompilationProcess.pdf
0100_Embeded_C_CompilationProcess.pdf0100_Embeded_C_CompilationProcess.pdf
0100_Embeded_C_CompilationProcess.pdf
 
Using R on High Performance Computers
Using R on High Performance ComputersUsing R on High Performance Computers
Using R on High Performance Computers
 
Dynamic tracing of MariaDB on Linux - problems and solutions (MariaDB Server ...
Dynamic tracing of MariaDB on Linux - problems and solutions (MariaDB Server ...Dynamic tracing of MariaDB on Linux - problems and solutions (MariaDB Server ...
Dynamic tracing of MariaDB on Linux - problems and solutions (MariaDB Server ...
 
Using eBPF to Measure the k8s Cluster Health
Using eBPF to Measure the k8s Cluster HealthUsing eBPF to Measure the k8s Cluster Health
Using eBPF to Measure the k8s Cluster Health
 
eBPF Debugging Infrastructure - Current Techniques
eBPF Debugging Infrastructure - Current TechniqueseBPF Debugging Infrastructure - Current Techniques
eBPF Debugging Infrastructure - Current Techniques
 
May2010 hex-core-opt
May2010 hex-core-optMay2010 hex-core-opt
May2010 hex-core-opt
 
Fletcher Framework for Programming FPGA
Fletcher Framework for Programming FPGAFletcher Framework for Programming FPGA
Fletcher Framework for Programming FPGA
 
Performance Optimization of SPH Algorithms for Multi/Many-Core Architectures
Performance Optimization of SPH Algorithms for Multi/Many-Core ArchitecturesPerformance Optimization of SPH Algorithms for Multi/Many-Core Architectures
Performance Optimization of SPH Algorithms for Multi/Many-Core Architectures
 
Measurement .Net Performance with BenchmarkDotNet
Measurement .Net Performance with BenchmarkDotNetMeasurement .Net Performance with BenchmarkDotNet
Measurement .Net Performance with BenchmarkDotNet
 
Guider: An Integrated Runtime Performance Analyzer on AGL
Guider: An Integrated Runtime Performance Analyzer on AGLGuider: An Integrated Runtime Performance Analyzer on AGL
Guider: An Integrated Runtime Performance Analyzer on AGL
 
Virtual platform
Virtual platformVirtual platform
Virtual platform
 
Hands-on go profiling
Hands-on go profilingHands-on go profiling
Hands-on go profiling
 

Recently uploaded

KnowAPIs-UnknownPerf-jaxMainz-2024 (1).pptx
KnowAPIs-UnknownPerf-jaxMainz-2024 (1).pptxKnowAPIs-UnknownPerf-jaxMainz-2024 (1).pptx
KnowAPIs-UnknownPerf-jaxMainz-2024 (1).pptxTier1 app
 
Salesforce Certified Field Service Consultant
Salesforce Certified Field Service ConsultantSalesforce Certified Field Service Consultant
Salesforce Certified Field Service ConsultantAxelRicardoTrocheRiq
 
Unveiling Design Patterns: A Visual Guide with UML Diagrams
Unveiling Design Patterns: A Visual Guide with UML DiagramsUnveiling Design Patterns: A Visual Guide with UML Diagrams
Unveiling Design Patterns: A Visual Guide with UML DiagramsAhmed Mohamed
 
Intelligent Home Wi-Fi Solutions | ThinkPalm
Intelligent Home Wi-Fi Solutions | ThinkPalmIntelligent Home Wi-Fi Solutions | ThinkPalm
Intelligent Home Wi-Fi Solutions | ThinkPalmSujith Sukumaran
 
Cloud Data Center Network Construction - IEEE
Cloud Data Center Network Construction - IEEECloud Data Center Network Construction - IEEE
Cloud Data Center Network Construction - IEEEVICTOR MAESTRE RAMIREZ
 
Building Real-Time Data Pipelines: Stream & Batch Processing workshop Slide
Building Real-Time Data Pipelines: Stream & Batch Processing workshop SlideBuilding Real-Time Data Pipelines: Stream & Batch Processing workshop Slide
Building Real-Time Data Pipelines: Stream & Batch Processing workshop SlideChristina Lin
 
(Genuine) Escort Service Lucknow | Starting ₹,5K To @25k with A/C 🧑🏽‍❤️‍🧑🏻 89...
(Genuine) Escort Service Lucknow | Starting ₹,5K To @25k with A/C 🧑🏽‍❤️‍🧑🏻 89...(Genuine) Escort Service Lucknow | Starting ₹,5K To @25k with A/C 🧑🏽‍❤️‍🧑🏻 89...
(Genuine) Escort Service Lucknow | Starting ₹,5K To @25k with A/C 🧑🏽‍❤️‍🧑🏻 89...gurkirankumar98700
 
ODSC - Batch to Stream workshop - integration of Apache Spark, Cassandra, Pos...
ODSC - Batch to Stream workshop - integration of Apache Spark, Cassandra, Pos...ODSC - Batch to Stream workshop - integration of Apache Spark, Cassandra, Pos...
ODSC - Batch to Stream workshop - integration of Apache Spark, Cassandra, Pos...Christina Lin
 
Professional Resume Template for Software Developers
Professional Resume Template for Software DevelopersProfessional Resume Template for Software Developers
Professional Resume Template for Software DevelopersVinodh Ram
 
办理学位证(UQ文凭证书)昆士兰大学毕业证成绩单原版一模一样
办理学位证(UQ文凭证书)昆士兰大学毕业证成绩单原版一模一样办理学位证(UQ文凭证书)昆士兰大学毕业证成绩单原版一模一样
办理学位证(UQ文凭证书)昆士兰大学毕业证成绩单原版一模一样umasea
 
GOING AOT WITH GRAALVM – DEVOXX GREECE.pdf
GOING AOT WITH GRAALVM – DEVOXX GREECE.pdfGOING AOT WITH GRAALVM – DEVOXX GREECE.pdf
GOING AOT WITH GRAALVM – DEVOXX GREECE.pdfAlina Yurenko
 
EY_Graph Database Powered Sustainability
EY_Graph Database Powered SustainabilityEY_Graph Database Powered Sustainability
EY_Graph Database Powered SustainabilityNeo4j
 
software engineering Chapter 5 System modeling.pptx
software engineering Chapter 5 System modeling.pptxsoftware engineering Chapter 5 System modeling.pptx
software engineering Chapter 5 System modeling.pptxnada99848
 
Der Spagat zwischen BIAS und FAIRNESS (2024)
Der Spagat zwischen BIAS und FAIRNESS (2024)Der Spagat zwischen BIAS und FAIRNESS (2024)
Der Spagat zwischen BIAS und FAIRNESS (2024)OPEN KNOWLEDGE GmbH
 
BATTLEFIELD ORM: TIPS, TACTICS AND STRATEGIES FOR CONQUERING YOUR DATABASE
BATTLEFIELD ORM: TIPS, TACTICS AND STRATEGIES FOR CONQUERING YOUR DATABASEBATTLEFIELD ORM: TIPS, TACTICS AND STRATEGIES FOR CONQUERING YOUR DATABASE
BATTLEFIELD ORM: TIPS, TACTICS AND STRATEGIES FOR CONQUERING YOUR DATABASEOrtus Solutions, Corp
 
Try MyIntelliAccount Cloud Accounting Software As A Service Solution Risk Fre...
Try MyIntelliAccount Cloud Accounting Software As A Service Solution Risk Fre...Try MyIntelliAccount Cloud Accounting Software As A Service Solution Risk Fre...
Try MyIntelliAccount Cloud Accounting Software As A Service Solution Risk Fre...MyIntelliSource, Inc.
 
Russian Call Girls in Karol Bagh Aasnvi ➡️ 8264348440 💋📞 Independent Escort S...
Russian Call Girls in Karol Bagh Aasnvi ➡️ 8264348440 💋📞 Independent Escort S...Russian Call Girls in Karol Bagh Aasnvi ➡️ 8264348440 💋📞 Independent Escort S...
Russian Call Girls in Karol Bagh Aasnvi ➡️ 8264348440 💋📞 Independent Escort S...soniya singh
 
Automate your Kamailio Test Calls - Kamailio World 2024
Automate your Kamailio Test Calls - Kamailio World 2024Automate your Kamailio Test Calls - Kamailio World 2024
Automate your Kamailio Test Calls - Kamailio World 2024Andreas Granig
 

Recently uploaded (20)

KnowAPIs-UnknownPerf-jaxMainz-2024 (1).pptx
KnowAPIs-UnknownPerf-jaxMainz-2024 (1).pptxKnowAPIs-UnknownPerf-jaxMainz-2024 (1).pptx
KnowAPIs-UnknownPerf-jaxMainz-2024 (1).pptx
 
Salesforce Certified Field Service Consultant
Salesforce Certified Field Service ConsultantSalesforce Certified Field Service Consultant
Salesforce Certified Field Service Consultant
 
Unveiling Design Patterns: A Visual Guide with UML Diagrams
Unveiling Design Patterns: A Visual Guide with UML DiagramsUnveiling Design Patterns: A Visual Guide with UML Diagrams
Unveiling Design Patterns: A Visual Guide with UML Diagrams
 
Intelligent Home Wi-Fi Solutions | ThinkPalm
Intelligent Home Wi-Fi Solutions | ThinkPalmIntelligent Home Wi-Fi Solutions | ThinkPalm
Intelligent Home Wi-Fi Solutions | ThinkPalm
 
Cloud Data Center Network Construction - IEEE
Cloud Data Center Network Construction - IEEECloud Data Center Network Construction - IEEE
Cloud Data Center Network Construction - IEEE
 
Building Real-Time Data Pipelines: Stream & Batch Processing workshop Slide
Building Real-Time Data Pipelines: Stream & Batch Processing workshop SlideBuilding Real-Time Data Pipelines: Stream & Batch Processing workshop Slide
Building Real-Time Data Pipelines: Stream & Batch Processing workshop Slide
 
(Genuine) Escort Service Lucknow | Starting ₹,5K To @25k with A/C 🧑🏽‍❤️‍🧑🏻 89...
(Genuine) Escort Service Lucknow | Starting ₹,5K To @25k with A/C 🧑🏽‍❤️‍🧑🏻 89...(Genuine) Escort Service Lucknow | Starting ₹,5K To @25k with A/C 🧑🏽‍❤️‍🧑🏻 89...
(Genuine) Escort Service Lucknow | Starting ₹,5K To @25k with A/C 🧑🏽‍❤️‍🧑🏻 89...
 
ODSC - Batch to Stream workshop - integration of Apache Spark, Cassandra, Pos...
ODSC - Batch to Stream workshop - integration of Apache Spark, Cassandra, Pos...ODSC - Batch to Stream workshop - integration of Apache Spark, Cassandra, Pos...
ODSC - Batch to Stream workshop - integration of Apache Spark, Cassandra, Pos...
 
Professional Resume Template for Software Developers
Professional Resume Template for Software DevelopersProfessional Resume Template for Software Developers
Professional Resume Template for Software Developers
 
办理学位证(UQ文凭证书)昆士兰大学毕业证成绩单原版一模一样
办理学位证(UQ文凭证书)昆士兰大学毕业证成绩单原版一模一样办理学位证(UQ文凭证书)昆士兰大学毕业证成绩单原版一模一样
办理学位证(UQ文凭证书)昆士兰大学毕业证成绩单原版一模一样
 
Call Girls In Mukherjee Nagar 📱 9999965857 🤩 Delhi 🫦 HOT AND SEXY VVIP 🍎 SE...
Call Girls In Mukherjee Nagar 📱  9999965857  🤩 Delhi 🫦 HOT AND SEXY VVIP 🍎 SE...Call Girls In Mukherjee Nagar 📱  9999965857  🤩 Delhi 🫦 HOT AND SEXY VVIP 🍎 SE...
Call Girls In Mukherjee Nagar 📱 9999965857 🤩 Delhi 🫦 HOT AND SEXY VVIP 🍎 SE...
 
GOING AOT WITH GRAALVM – DEVOXX GREECE.pdf
GOING AOT WITH GRAALVM – DEVOXX GREECE.pdfGOING AOT WITH GRAALVM – DEVOXX GREECE.pdf
GOING AOT WITH GRAALVM – DEVOXX GREECE.pdf
 
EY_Graph Database Powered Sustainability
EY_Graph Database Powered SustainabilityEY_Graph Database Powered Sustainability
EY_Graph Database Powered Sustainability
 
software engineering Chapter 5 System modeling.pptx
software engineering Chapter 5 System modeling.pptxsoftware engineering Chapter 5 System modeling.pptx
software engineering Chapter 5 System modeling.pptx
 
Der Spagat zwischen BIAS und FAIRNESS (2024)
Der Spagat zwischen BIAS und FAIRNESS (2024)Der Spagat zwischen BIAS und FAIRNESS (2024)
Der Spagat zwischen BIAS und FAIRNESS (2024)
 
BATTLEFIELD ORM: TIPS, TACTICS AND STRATEGIES FOR CONQUERING YOUR DATABASE
BATTLEFIELD ORM: TIPS, TACTICS AND STRATEGIES FOR CONQUERING YOUR DATABASEBATTLEFIELD ORM: TIPS, TACTICS AND STRATEGIES FOR CONQUERING YOUR DATABASE
BATTLEFIELD ORM: TIPS, TACTICS AND STRATEGIES FOR CONQUERING YOUR DATABASE
 
Try MyIntelliAccount Cloud Accounting Software As A Service Solution Risk Fre...
Try MyIntelliAccount Cloud Accounting Software As A Service Solution Risk Fre...Try MyIntelliAccount Cloud Accounting Software As A Service Solution Risk Fre...
Try MyIntelliAccount Cloud Accounting Software As A Service Solution Risk Fre...
 
Hot Sexy call girls in Patel Nagar🔝 9953056974 🔝 escort Service
Hot Sexy call girls in Patel Nagar🔝 9953056974 🔝 escort ServiceHot Sexy call girls in Patel Nagar🔝 9953056974 🔝 escort Service
Hot Sexy call girls in Patel Nagar🔝 9953056974 🔝 escort Service
 
Russian Call Girls in Karol Bagh Aasnvi ➡️ 8264348440 💋📞 Independent Escort S...
Russian Call Girls in Karol Bagh Aasnvi ➡️ 8264348440 💋📞 Independent Escort S...Russian Call Girls in Karol Bagh Aasnvi ➡️ 8264348440 💋📞 Independent Escort S...
Russian Call Girls in Karol Bagh Aasnvi ➡️ 8264348440 💋📞 Independent Escort S...
 
Automate your Kamailio Test Calls - Kamailio World 2024
Automate your Kamailio Test Calls - Kamailio World 2024Automate your Kamailio Test Calls - Kamailio World 2024
Automate your Kamailio Test Calls - Kamailio World 2024
 

[ CNCF Q1 2024 ] Intro to Continuous Profiling and Grafana Pyroscope.pdf

  • 1. Intro to Continuous Profiling and Grafana Pyroscope Steve Caron Staff Solutions Engineer, Grafana Labs
  • 2. Once upon a time... M L T
  • 3. M was relying on Metrics
  • 4. L was relying on Logs
  • 5. T was relying on Traces
  • 6. Image credit: Oliver The Mighty Pig, Penguin Publishing Group ISBN:0803728867 Mighty P was using Profiling ...and spewing out flame graphs flame graph
  • 7. Error logs pinpoint user issue Traces Metrics Logs Unexpected cpu spike Profiles Anomalous span reveals error cluster Code level root cause Profiling completes the story of why something went wrong and how to fix it
  • 8.
  • 9. What is Profiling? “Profiling” is a way to analyze how a program uses resources like CPU or memory at code-level granularity. It makes use of flamegraphs to help you pinpoint the parts of your application that use the most resources. Commonly used during application development, built into popular IDEs. Challenges: ● The overhead of conventional profiles don’t allow for profiling in production ● On-demand profiling is a reactive approach ● Development environments don’t accurately mimic production.
  • 10. What changed? Profiling technology has advanced. The overhead of today’s profiling technologies allows for it to run in production, with minimal overhead. This allows for “Continuous profiling” which is a more powerful version of profiling which profiles applications periodically, adding the dimension of time. By understanding your system’s resource usage over time, you can then locate, debug, and fix issues related to performance.
  • 11. Cost cutting Getting a line-level breakdown of where resource hotspots are allows you to optimize them The value of Continuous Profiling Latency reduction Incident resolution For many businesses performance impact revenue - e-commerce, ads - gaming, streaming - HFT, fintech - rideshare Pinpoint memory leaks to specific parts of the code See root cause of CPU spikes See code level details when debugging services
  • 12. How to gather a profile? ● Instrumenting the code base ○ Tooling and formats depending on each language ecosystem ○ Access to more detailed runtime information ○ More flexibility: ■ selectively profile and label specific sections of code ■ send profiles at different intervals (further read: eBPF pros/cons) ● eBPF based collection ○ No insights into stacktrace runtime information for interpreted languages (better fit for compiled languages) ○ Focus on CPU profiling ○ Live profiling: doesn’t require code change or even restarts ○ Kernel dependencies (v4.9 or more recent) and requires root access
  • 13. How to gather a profile? Let’s take a look at Go ● Standard library includes CPU, Memory, Goroutine, Mutex and Block resources ● Provides profiles using a HTTP interface ○ Profiling data is returned using protobuf definition ● Data meant to be consumed by the pprof CLI ○ # Get a CPU profile over the last 2 seconds $ pprof "http://localhost:6060/debug/pprof/profile?seconds=2" # Get the heap memory allocations $ pprof "http://localhost:6060/debug/pprof/allocs" ○ Common to use the -http parameter to view profiles using the web interface ● Find more on Profiling in Go on https://pkg.go.dev/runtime/pprof#Profile
  • 14. Instrumentation of Go code package main import ( "log" "net/http" _ "net/http/pprof" "time" ) func main() { go func() { log.Println(http.ListenAndServe("localhost:6060", nil)) }() // spend 3 cpu cycles doALot() doLittle() } [...]
  • 15. What is measured in a profile? package main func main() { // work doALot() doLittle() } func prepare() { // work } func doALot() { prepare() // work } func doLittle() { prepare() // work }
  • 16. What is measured in a profile? Time on CPU Each measurement gets recorded on a stack-trace level package main func main() { // spend 3 cpu cycles doALot() doLittle() } func prepare() { // spend 5 cpu cycles } func doALot() { prepare() // spend 20 cpu cycles } func doLittle() { prepare() // spend 5 cpu cycles } main() 3 main() > doALot() > prepare() 5 main() > doALot() 20 main() > doLittle() > prepare() 5 main() > doLittle() 5
  • 17. Visualization of Profiles (try it yourself: flamegraph.com) Flamegraph ● Whole width represent the total resources used (over the whole measurement duration) ● Ability to spot higher usage nodes ● Colours are grouped based on package package main func main() { // spend 3 cpu cycles doALot() doLittle() } func prepare(x) { // spend 5 cpu cycles } func doALot(65) { prepare(65) // spend 20 cpu cycles } func doLittle(26) { prepare(26) // spend 5 cpu cycles }
  • 18. What does “continuous profiling” look like? Resource usage over time Query Flamegraph & table
  • 19. What does “continuous profiling” look like?
  • 20. What does “continuous profiling” look like?
  • 21. What does “continuous profiling” look like?
  • 22. What does “continuous profiling” look like?
  • 23. What does “continuous profiling” look like?
  • 25. 2023: Pyroscope joined Grafana Labs +
  • 28. What is our product today Open Source Project ~10,000 combined GitHub ⭐ Commercial Managed Offering An open source continuous profiling platform Grafana Cloud Profiles available in Grafana Cloud (available with free tier) ● Fully managed Grafana and observability solution
  • 30. Demo
  • 31. Pyroscope resources: client documentation ● Client documentation - how to send profiles to Grafana
  • 32. More resources examples in grafana/pyroscope #pyroscope on https://grafana.slack.com/ 📖 https://grafana.com/docs/pyroscope/latest/ https://play.grafana.org/a/grafana-pyroscope-app