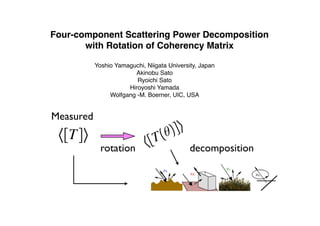
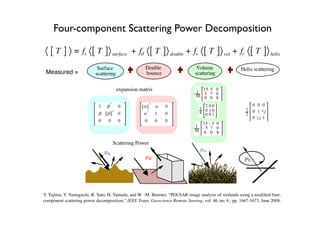
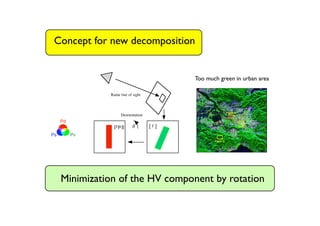
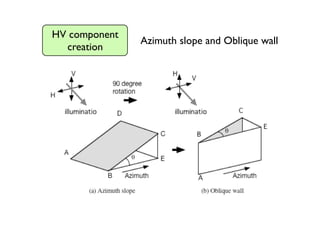
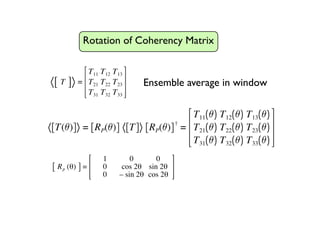
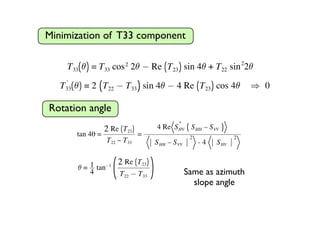
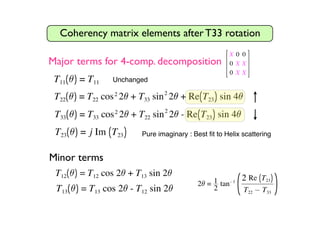
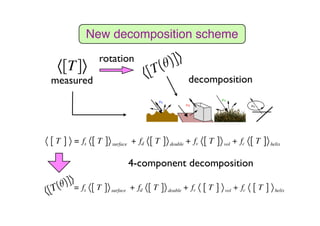
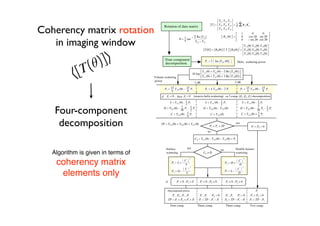
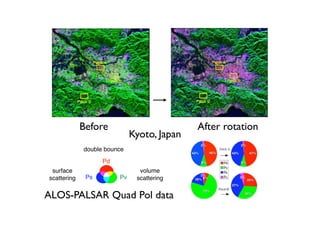
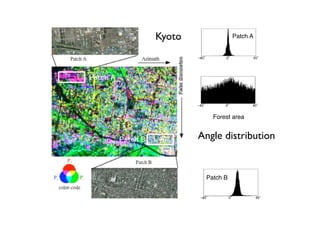
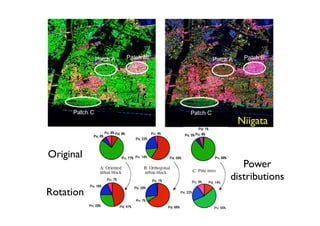
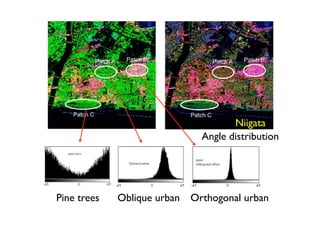
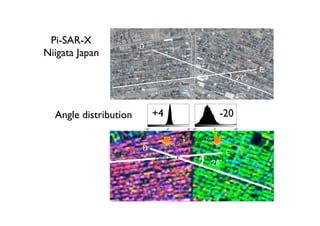
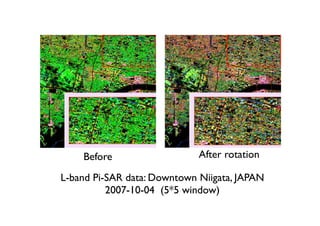
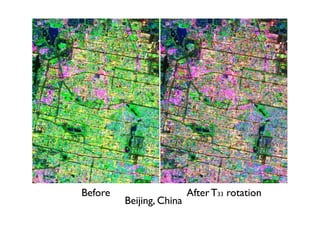
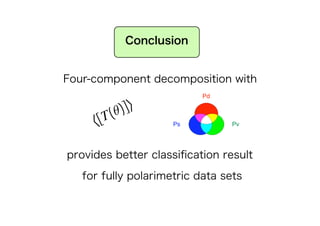
The document proposes a four-component scattering power decomposition method with rotation of the coherency matrix. This improves upon existing decomposition methods by minimizing the HV component through rotation, resulting in better separation of surface, double bounce, volume, and helix scattering mechanisms. The new method is applied to fully polarimetric SAR data sets to provide improved classification results.
A ~25 slide presentation that explains the underlying principles and some applications of InSAR, with a particular focus on the measurement of deformation due to earthquakes. The presentation could be used in a lecture or lab setting, or provided to students for review out of class. The slides are annotated with additional background information designed to assist instructors.
Urban Land Cover Change Detection Analysis and Modelling Spatio-Temporal Grow...Bayes Ahmed
This is my final Mater thesis presentation. The thesis defense was held on March' 07, 2011 at 15:30 in the seminar room of Universitat Jaume I (UJI), Castellón, Spain.
"Wavelet Signal Processing",graduate course.
Lecture notes of Prof. H. Amindavar.
Professor of Electrical engineering, Amirkabir university of technology
This presentation consist of remote sensing, types of remote sensing and also about the radiometers systems. I have also discussed about the types of radiometers system and how it work. I have also discussed about the principle on which it works. Also I have discussed about the applications .
SBAS-DInSAR processing on the ESA Geohazards Exploitation PlatformEmmanuel Mathot
In the context of space-borne geodetic techniques, Differential Synthetic Aperture Radar Interferometry (DInSAR) has demonstrated its high performance in measuring surface displacements in different conditions and scenarios, both natural and anthropic. In particular, the advanced DInSAR time series processing method referred to as Small BAseline Subset (SBAS), that allows studying both the spatial and temporal variability of the surface displacements, has proven to be particularly suitable in different contexts, as for natural hazards (volcanoes, earthquakes and landslides) and human-induced deformation (subsidence due to aquifer exploitation, mining operations, and building of large infrastructures). Recently, an efficient implementation of this algorithm (referred to as P-SBAS approach) has been fully integrated within the ESA’s Grid Processing on Demand (G-POD) environment, which is part of the [Geohazards Thematic Exploitation Platform (GEP)](https://geohazards-tep.eo.esa.int/#!) of ESA. The GEP is devoted to the exploitation of EO data resources in the context of the Geohazard Supersites & Natural Laboratories as well as on the CEOS Pilots on Seismic Hazards and Volcanoes. The GEP is sourced with elements, data and processing, including P-SBAS, relevant to the geohazards theme. The integration of the P-SBAS algorithm within GEP resulted in a web-based tool freely available to the scientific community. This tool allows users to process, from their own laptops, the European SAR data archives (ERS, ENVISAT and Sentinel-1) for obtaining surface displacement maps and time series in a completely unsupervised way, without caring about data download and processing facility procurements. The workshop is organized in four parts. First, a short overview on the DInSAR processing methods allowing retrieving mean surface deformation maps and displacement time series will be provided, with a specific focus on the SBAS-DInSAR technique. Secondly, the GEP and G-POD environments will be introduced and the P-SBAS web tool will be presented. The third and the fourth parts are dedicated to the advanced features and to case studies and results achieved via the web tool, respectively.
drought monitoring and management using remote sensingveerendra manduri
Monitoring drought and its management became easier with the help of remote sensing..several drought monitoring indices can be used to monitor drought condition. this ppt consists of information regarding droughts in relation to agriculture and their monitoring with the help of remotely sense based indices.
LIDAR is an acronym for LIght Detection And Ranging. It is an optical remote sensing technology that can measure the distance to or other properties of a target by illuminating the target with light pulse to form an image.
This content presents for basic of Synthetic Aperture Radar (SAR) including its geometry, how the image is created, essential parameters, interpretation, SAR sensor specification, and advantages and disadvantages.
SCRUTINY TO THE NON-AXIALLY DEFORMATIONS OF AN ELASTIC FOUNDATION ON A CYLIND...P singh
This paper is devoted to homogenization of partial differential operators to use in special structure that is a plate allied to an elastic foundation when it is situated through the basic loads (especially with the harmonic forces) with a Non-axially deformation of the cantilever. Furthermore, it contains the Equations of motion that they can be derived from degenerate Non-linear elliptic ones. Through the mentioned processes, there exists many excess works related to computing the bounded conditions for this special application form of study (when the deformation phenomenon has occurred). At the end of the article whole results of the study on a circular plate are debated and new ways assigned to them are discussed. Afterwards all the processes are formulised with the collection of contracting sequences and expanding sequences integrable functions that are intrinsically joints with the characteristic functions to expanding the behaviour of an elastic foundation. Thenceforth all the resultant functions are sets and compared with the other ones (without the loads). Sample pictures and analysis of the study were employed with the ANSYS software to obtain the better observations and conclusions.
TU4.L09 - FOUR-COMPONENT SCATTERING POWER DECOMPOSITION WITH ROTATION OF COHERENCY MATRIX
1. Four-component Scattering Power Decomposition
with Rotation of Coherency Matrix
Yoshio Yamaguchi, Niigata University, Japan
Akinobu Sato
Ryoichi Sato
Hiroyoshi Yamada
Wolfgang -M. Boerner, UIC, USA
Measured
rotation decomposition
2. Four-component Scattering Power Decomposition
Surface Double Volume Helix scattering
Measured = scattering bounce scattering
expansion matrix 15 5 0
1 5 7 0
30 0 0 8
* 2
1 0 0 2 00 0 0 0
2
1 0 10 1 0 1 +j
0 *
1 0 4 0 01 2
0 +j 1
0 0 0 0 0 0
15 - 5 0
1 -5 7 0
30 0 0 8
Scattering Power
Y. Yajima, Y. Yamaguchi, R. Sato, H. Yamada, and W. -M. Boerner, “POLSAR image analysis of wetlands using a modified four-
component scattering power decomposition,” IEEE Trans. Geoscience Remote Sensing, vol. 46, no. 6 , pp. 1667-1673, June 2008.
4. Concept for new decomposition
Too much green in urban area
Radar line of sight
Deorientation
S
Pd
T T
Ps Pv
Minimization of the HV component by rotation
5. HV component
Azimuth slope and Oblique wall
creation
6. Rotation of Coherency Matrix
Ensemble average in window
1 0 0
Rp ( ) = 0 cos 2 sin 2
0 – sin 2 cos 2
7. Minimization of T33 component
T 33 = T 33 cos 2 2 Re T 23 sin 4 + T 22 sin 22
Rotation angle
2 Re T23
= 1 tan - 1
4 T 22 T 33 Same as azimuth
slope angle
8. Coherency matrix elements after T33 rotation
Major terms for 4-comp. decomposition
Unchanged
Pure imaginary : Best fit to Helix scattering
Minor terms
2 = 1 tan - 1 2 Re T23
2 T22 T33
10. T11 T12 T 13 n
T = T21 T22 T 23 = 1
†
Coherency matrix rotation
n kp kp
Rotation of data matrix
T31 T32 T 33
1 0 0
- 1 2 Re T 23 Rp ( ) = 0 cos 2 sin 2
in imaging window
= 1 tan 0 – sin 2 cos 2
4 T 22 T 33
T 11 T 12 T 13
†
T = R P( ) T RP( ) = T 21 T 22 T 23
T 31 T 32 T 33
Four-component Pc = 2 Im T 23 ( )
decomposition Helix scattering power
T 11 ( ) + T 22 ( ) – 2 Re T12( )
10 log
Volume scattering T11 ( ) + T 22 ( ) + 2 Re T 12( )
power 2 dB
- 2 dB
Pv = 15 T 33 ( ) – 15 Pc Pv = 4 T 33 ( ) – 2 Pc Pv = 15 T 33 ( ) – 15 Pc
4 8 4 8
if Pv < 0 , then Pc = 0 (remove helix scattering) 3 comp. (Ps, Pd, Pv ) decomposition
S = T 11 ( ) - 1 Pv S = T 11 ( ) - 1 Pv S = T 11 ( ) - 1 Pv
2 2 2
Four-component D = T 22 ( ) - 7 Pv - 1 Pc
30 2
C = T 12 ( ) - 1 Pv
6
D = T 22 ( ) - T 33 ( )
C = T 12 ( )
D = T 22 ( ) - 7 Pv - 1 Pc
30
C = T 12 ( ) + 1 Pv
6
2
decomposition TP = T 11 ( ) + T 22 ( ) + T 33 ( )
Pv + Pc > TP
yes
Ps = Pd = 0
no
C 0 = T 11 ( ) – T 22 ( ) – T33 ( ) + Pc
Surface yes Double bounce
no
Algorithm is given in terms of scattering C0 > 0 scattering
coherency matrix
2 2
C C
Ps = S + Pd = D +
S D
2 2
C C
elements only Pd = D –
S
Ps = S –
D
if Ps > 0 , Pd > 0 Ps > 0 , Pd < 0 Ps < 0 , Pd > 0
Decomposed power Pc
Ps , Pd , Pv , Pc Pv , Pc Pd = 0 Pv , Pc Ps = 0 Ps = Pd = 0
TP = Ps + Pd + Pv + Pc Ps = TP – Pv – Pc Pd = TP – Pv – Pc Pv = TP – Pc
Four comp. Three comp. Three comp. Two comp.
11. Before After rotation
Kyoto, Japan
double bounce
Pd
surface volume
scattering Ps Pv scattering
ALOS-PALSAR Quad Pol data
12. Kyoto Patch A
Forest area
Angle distribution
Patch B