Download to read offline


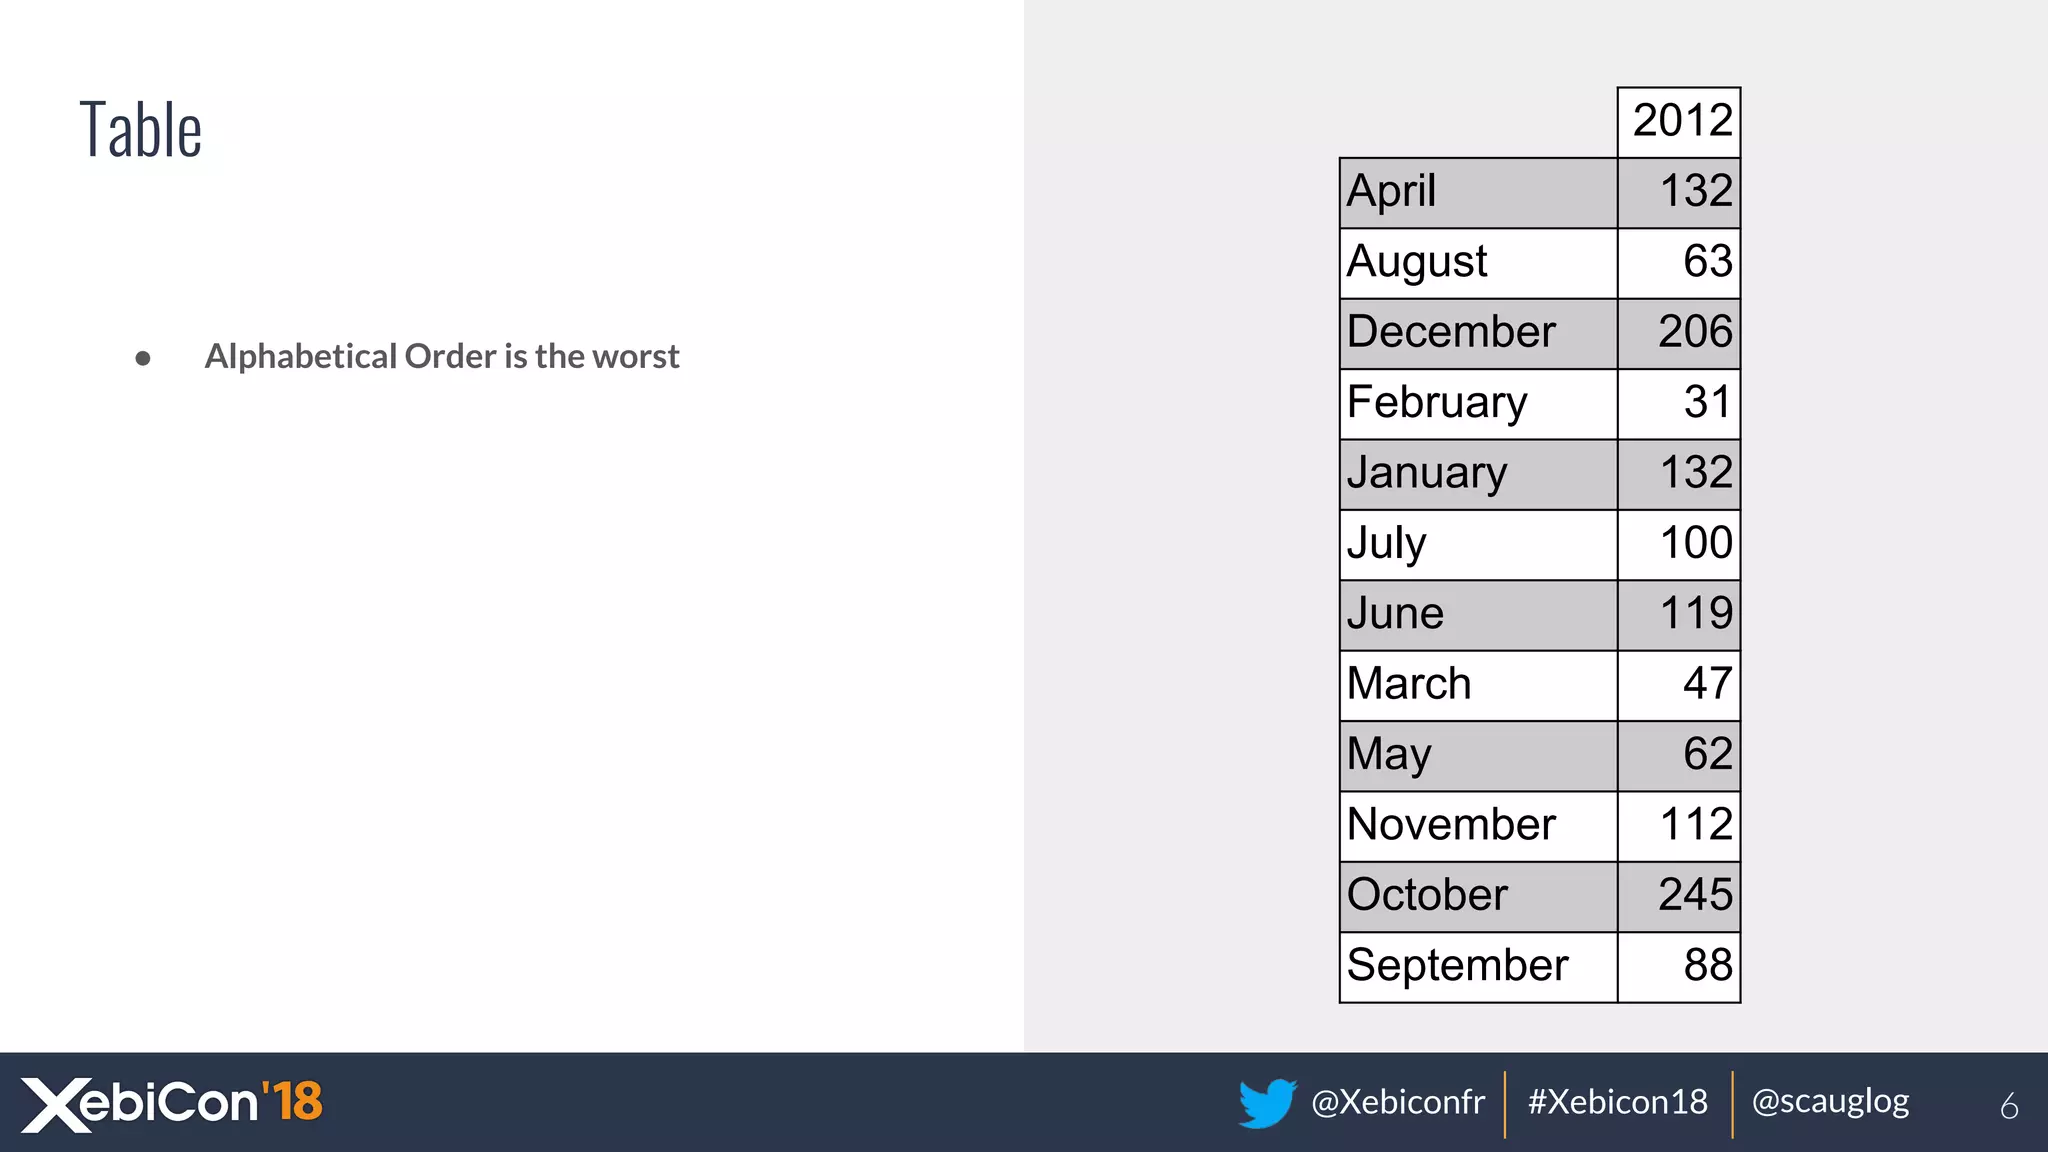
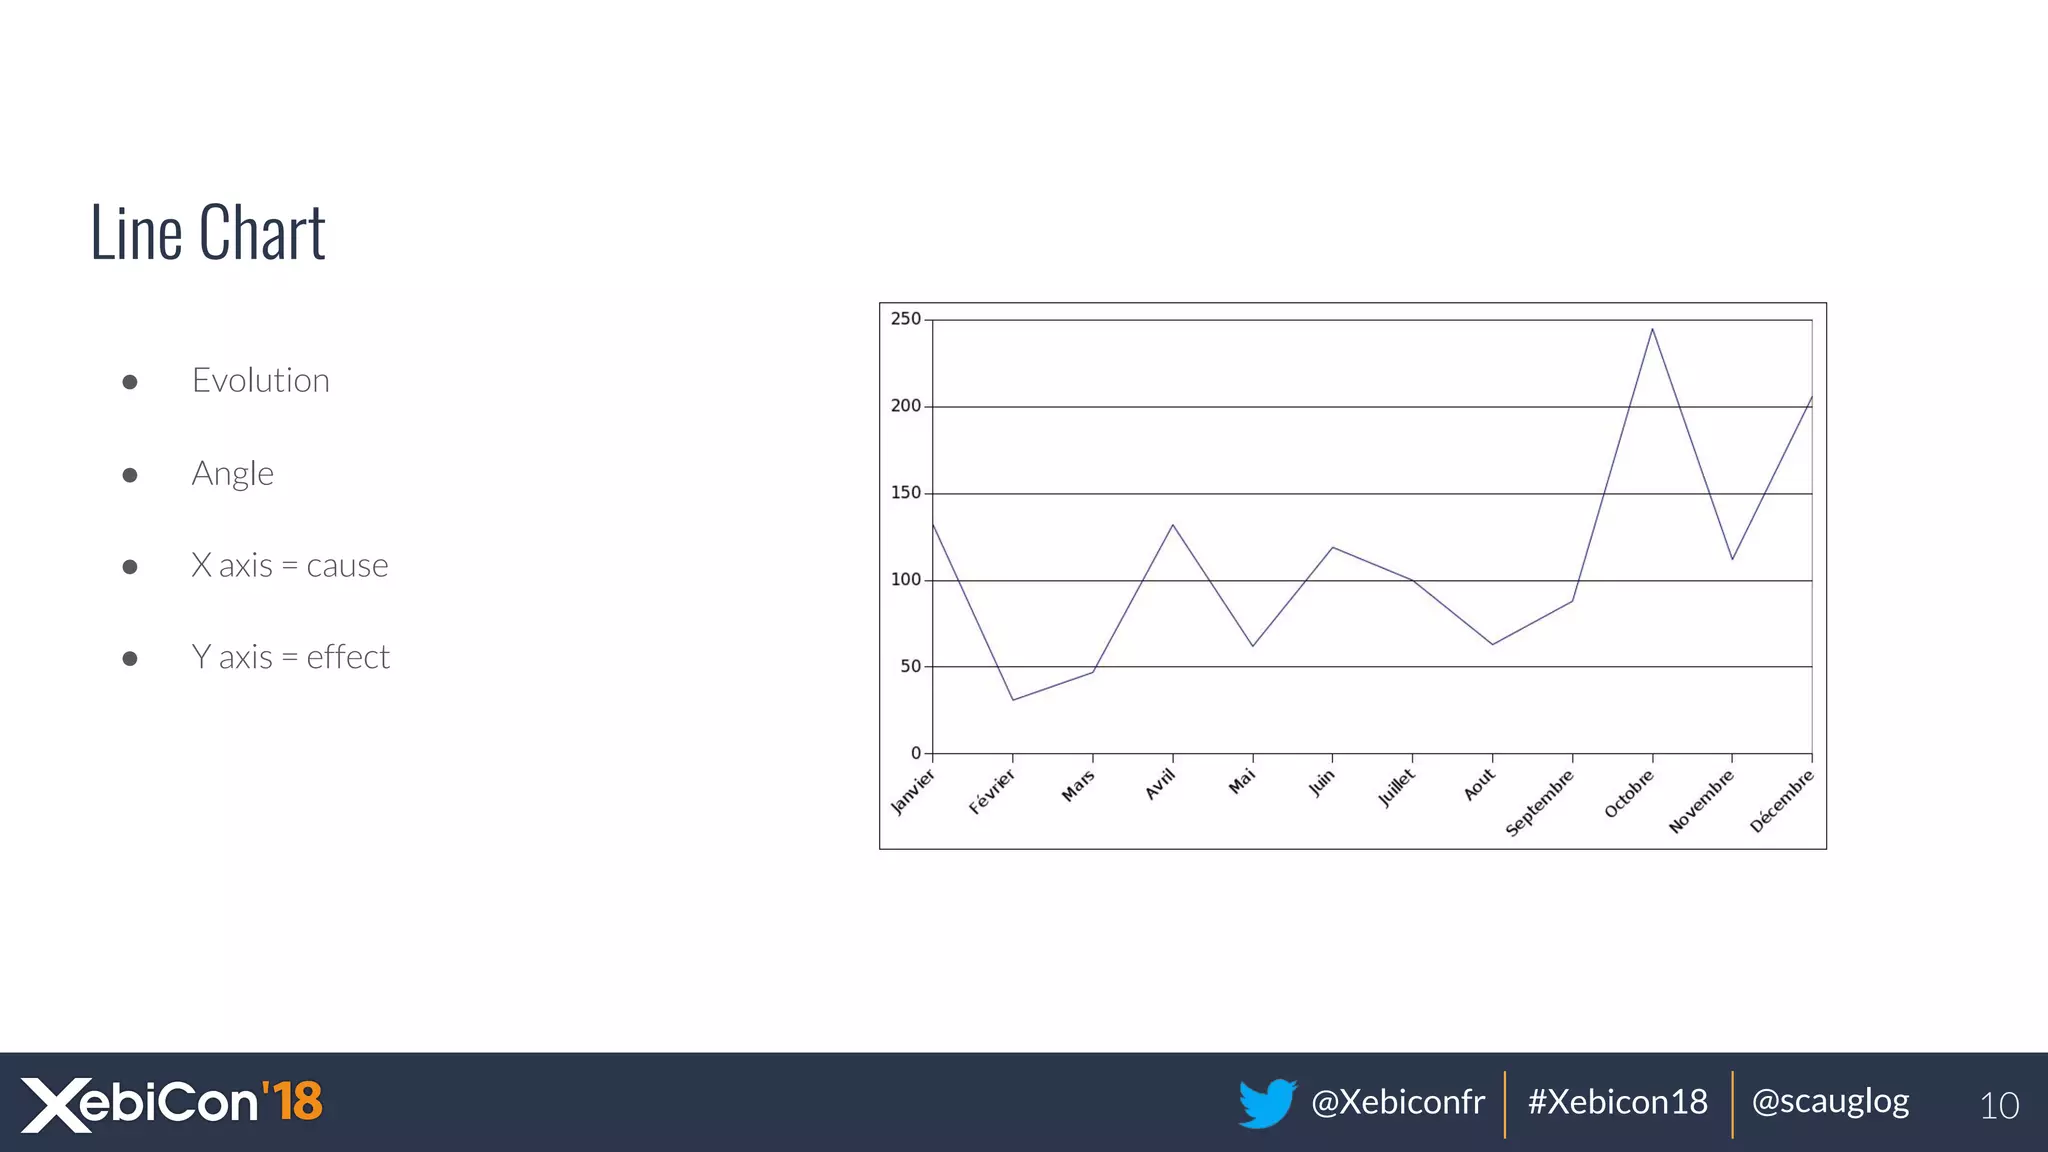

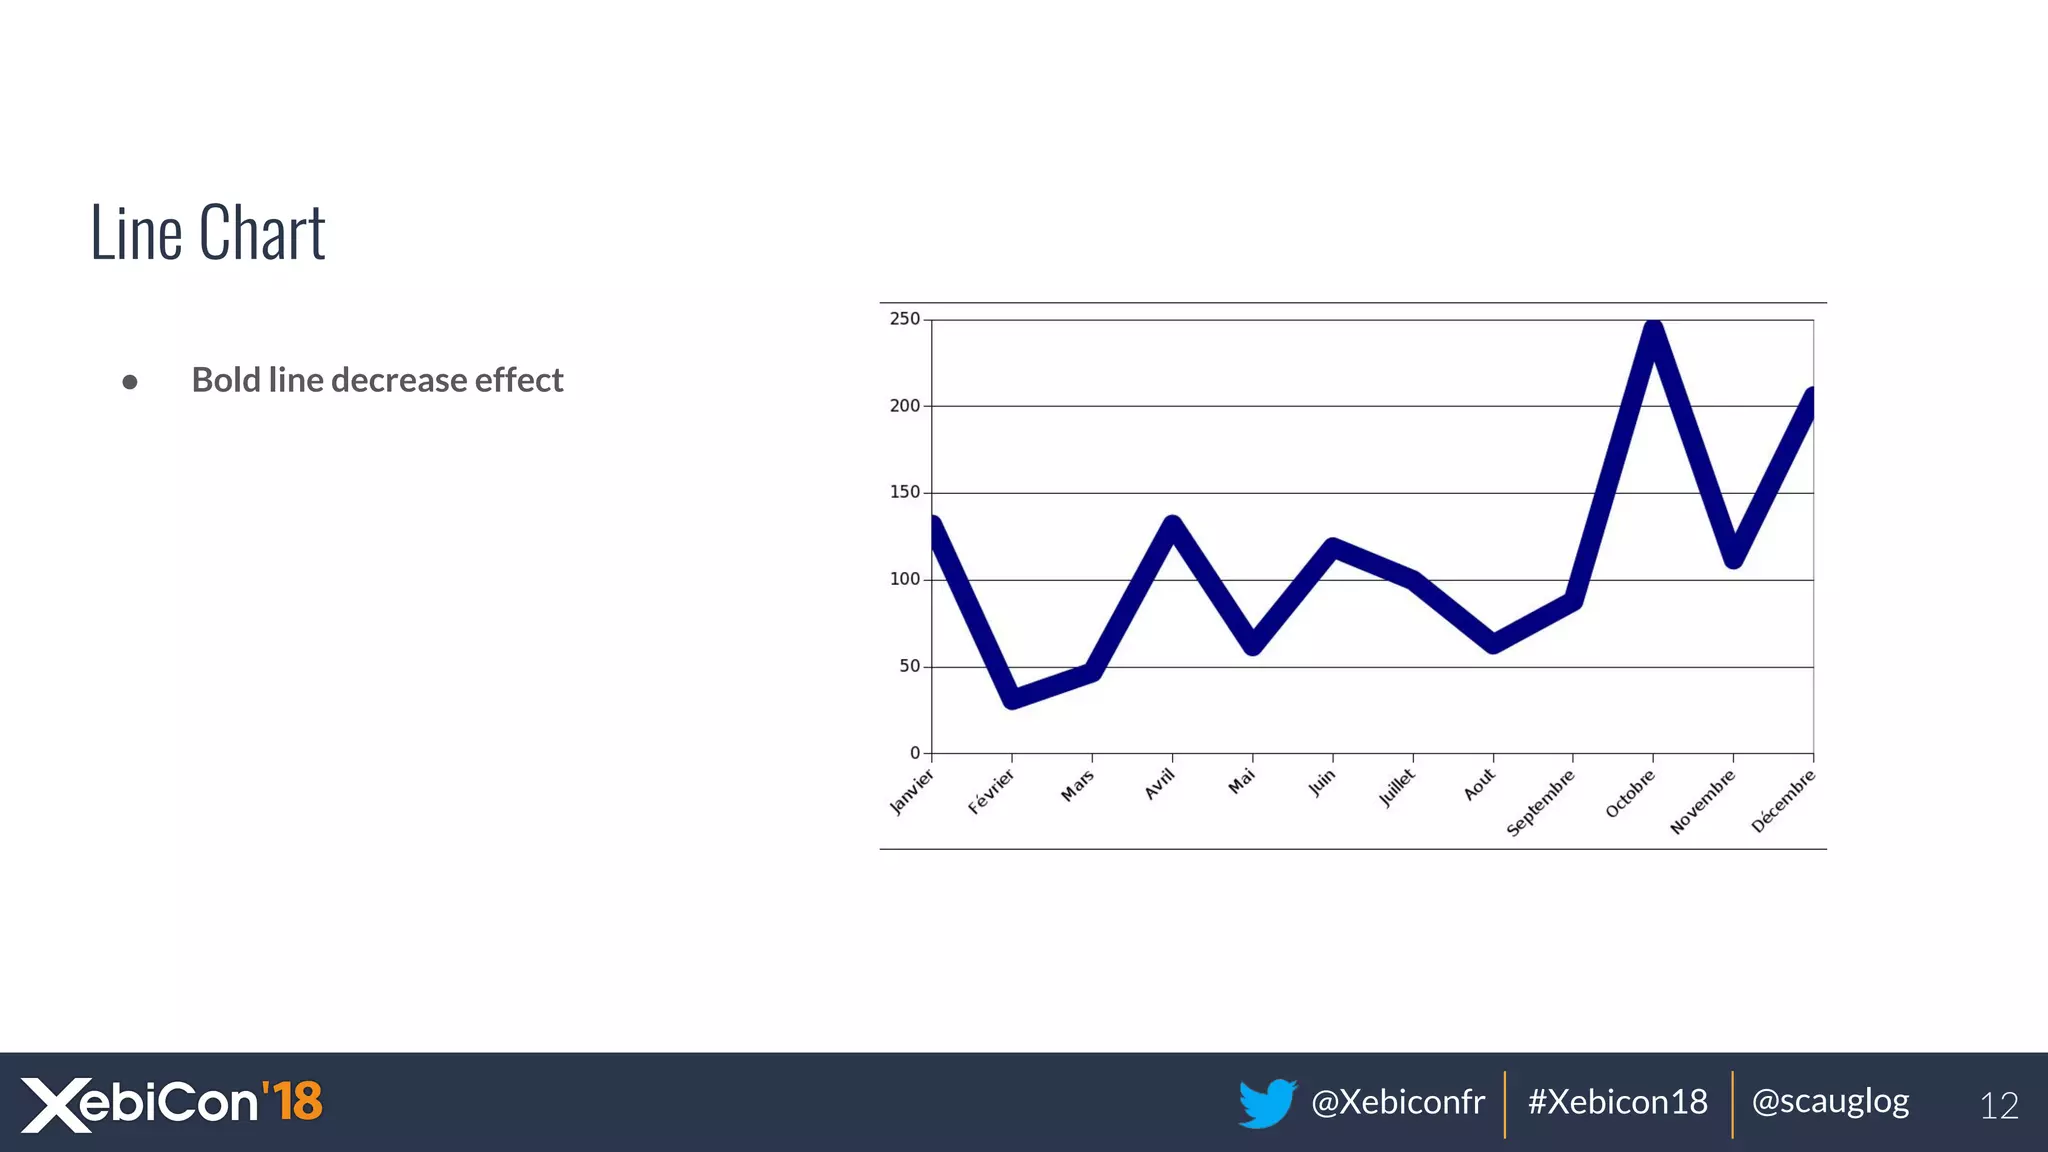
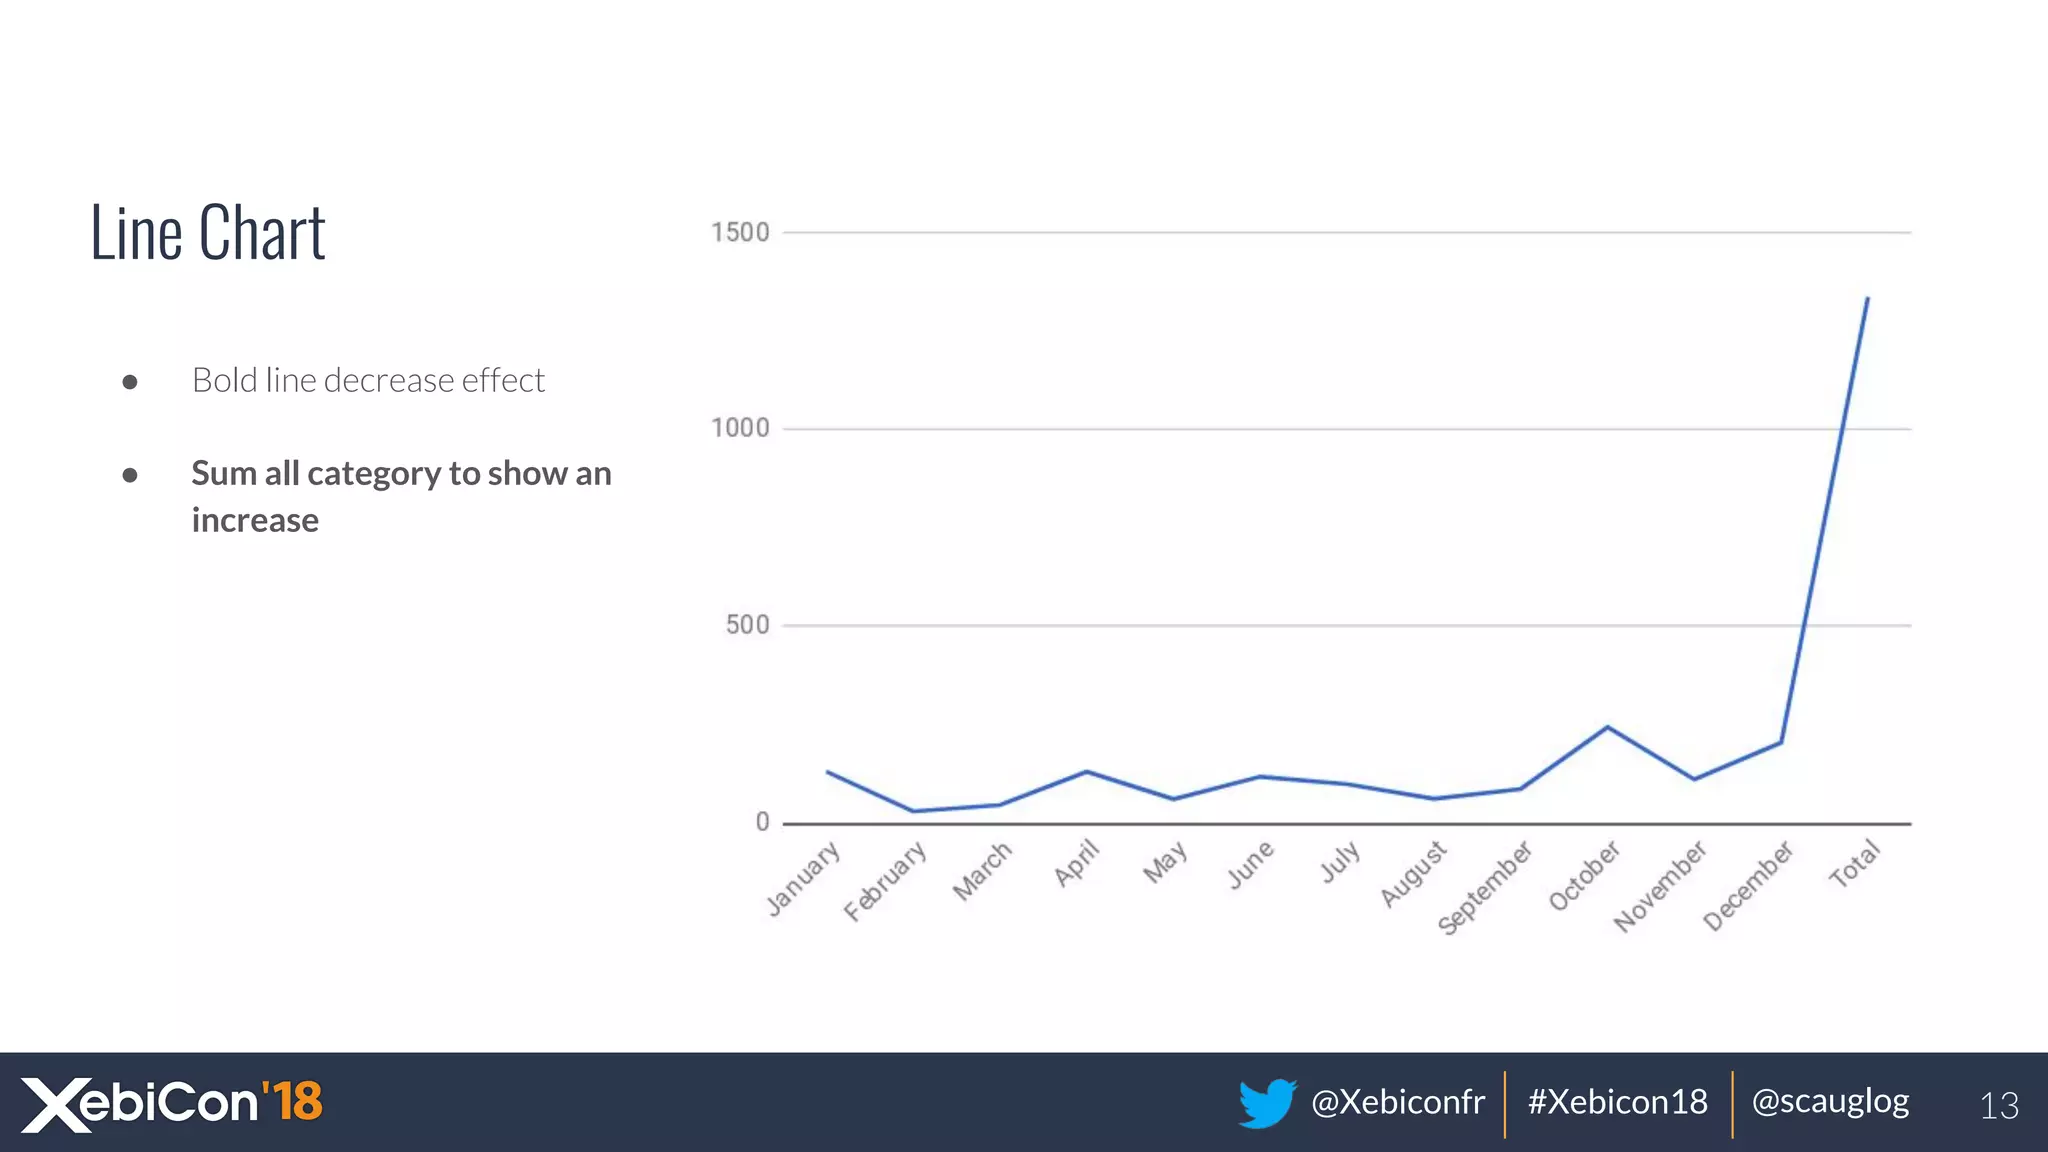
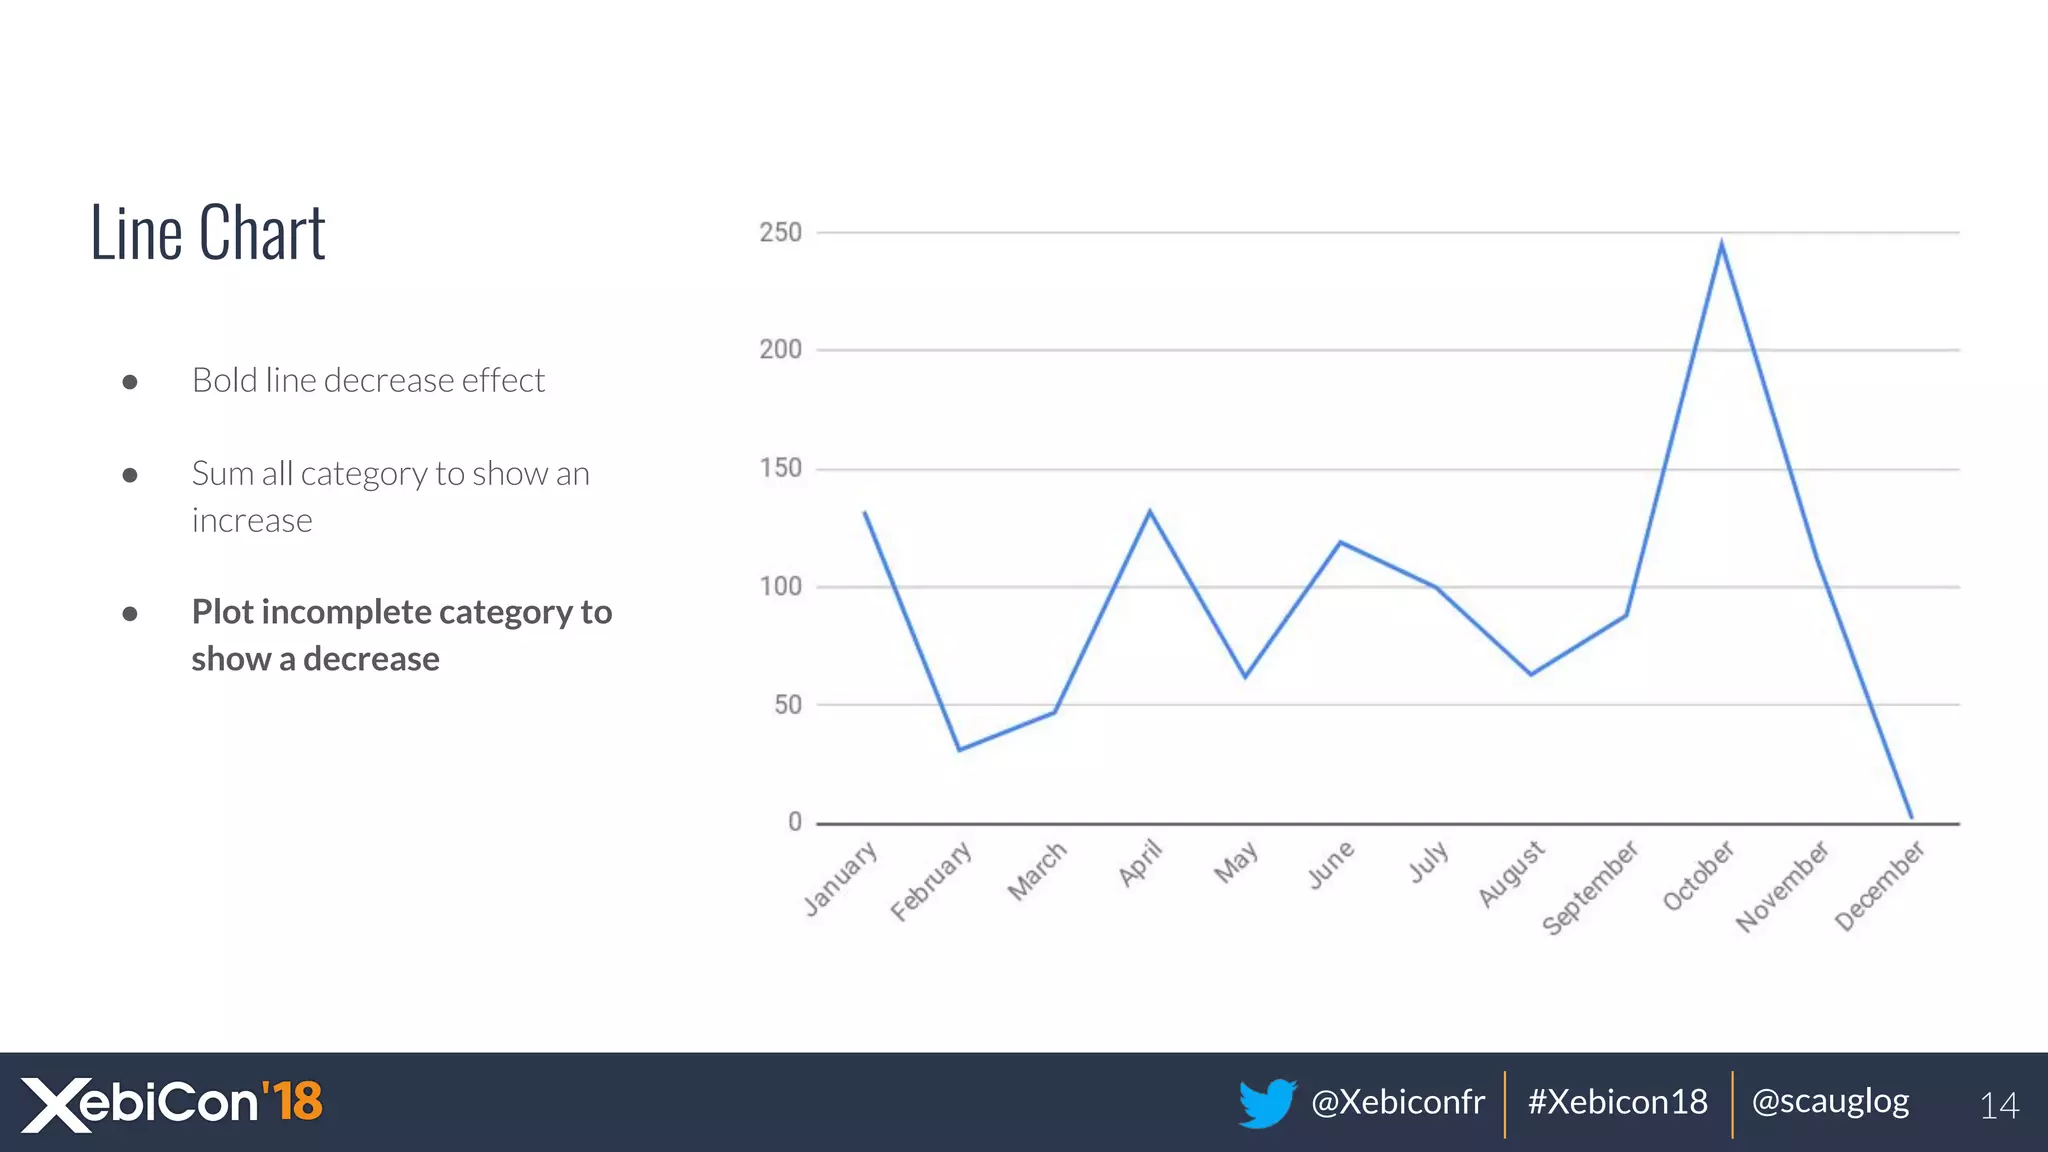
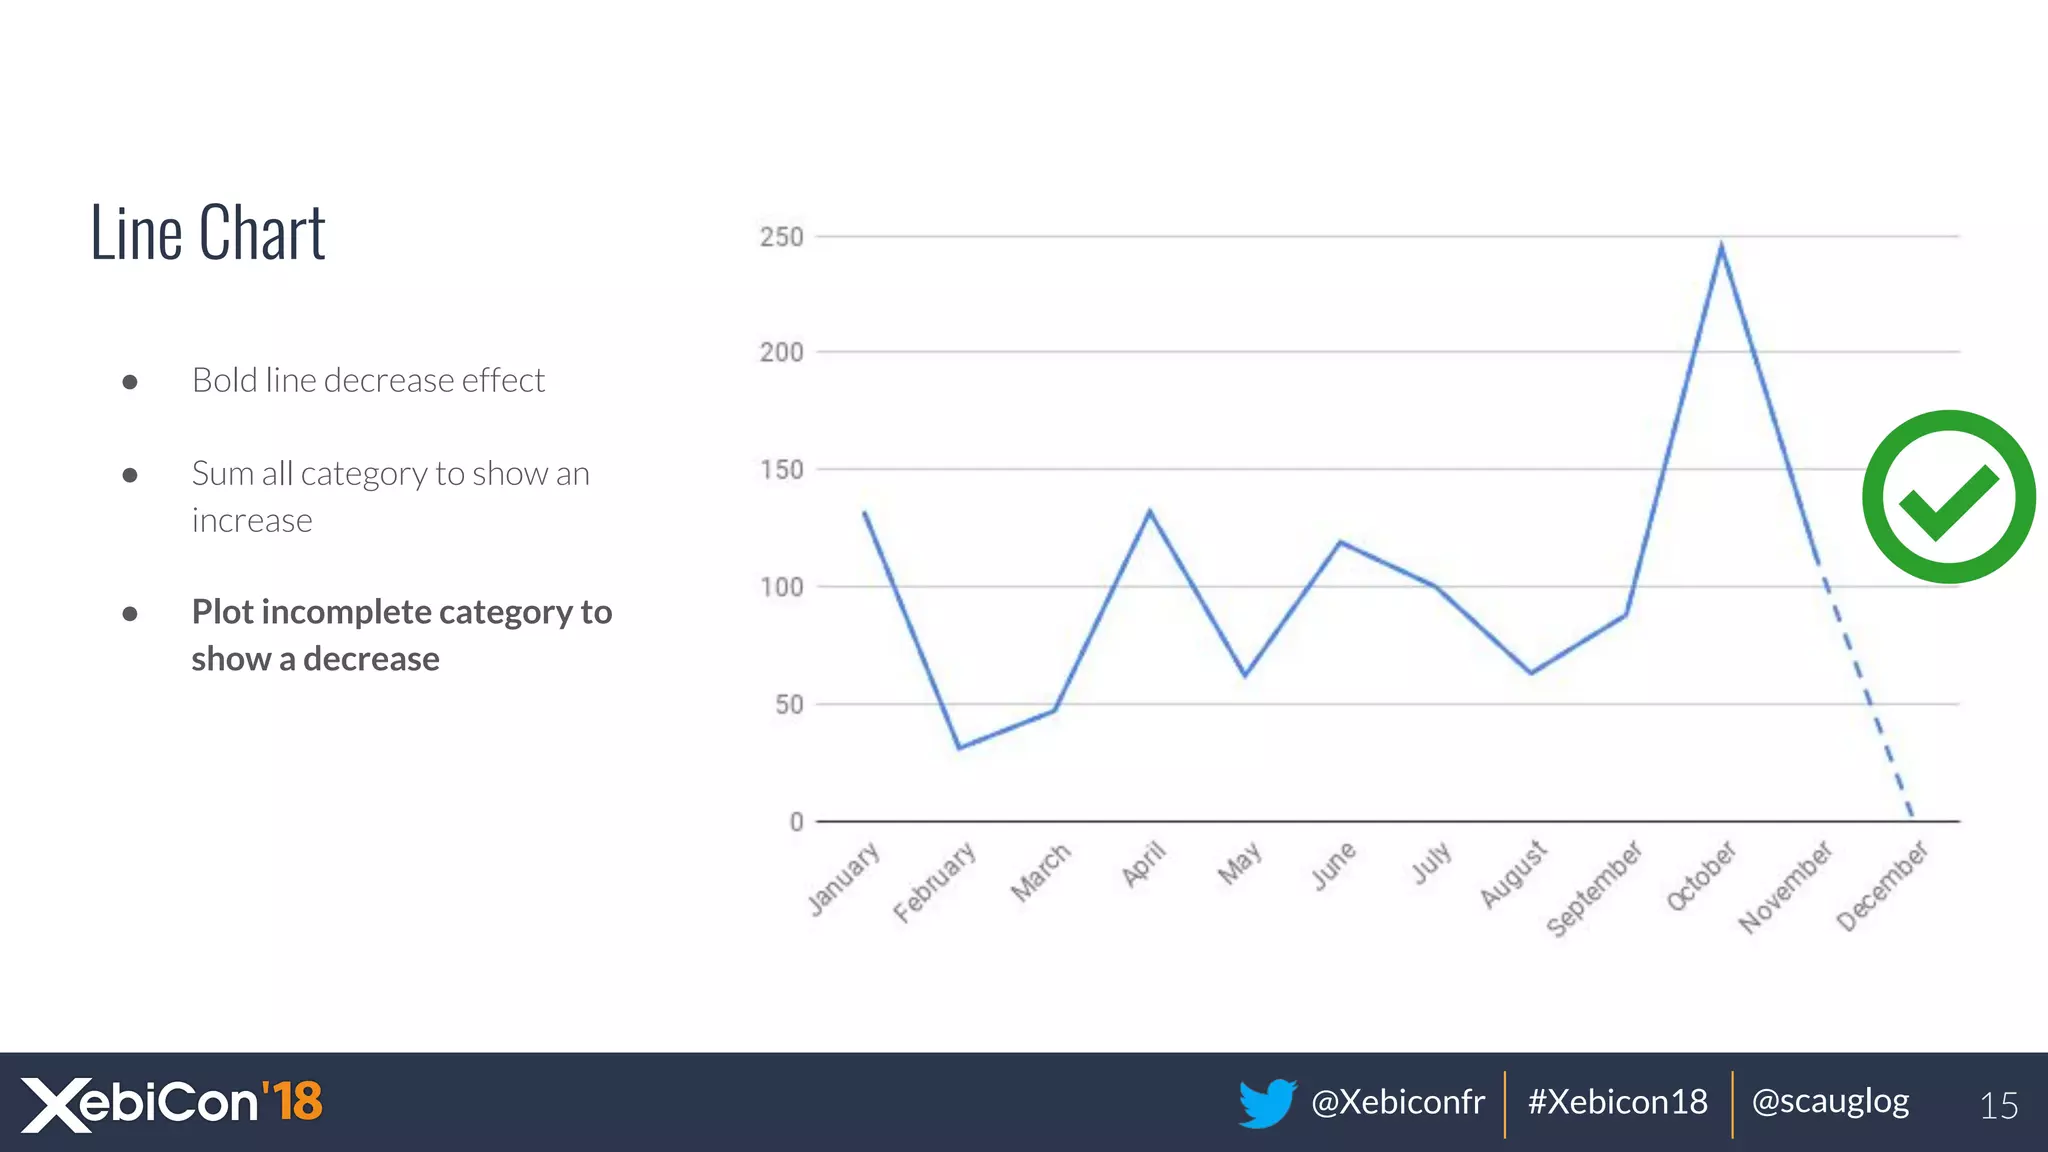
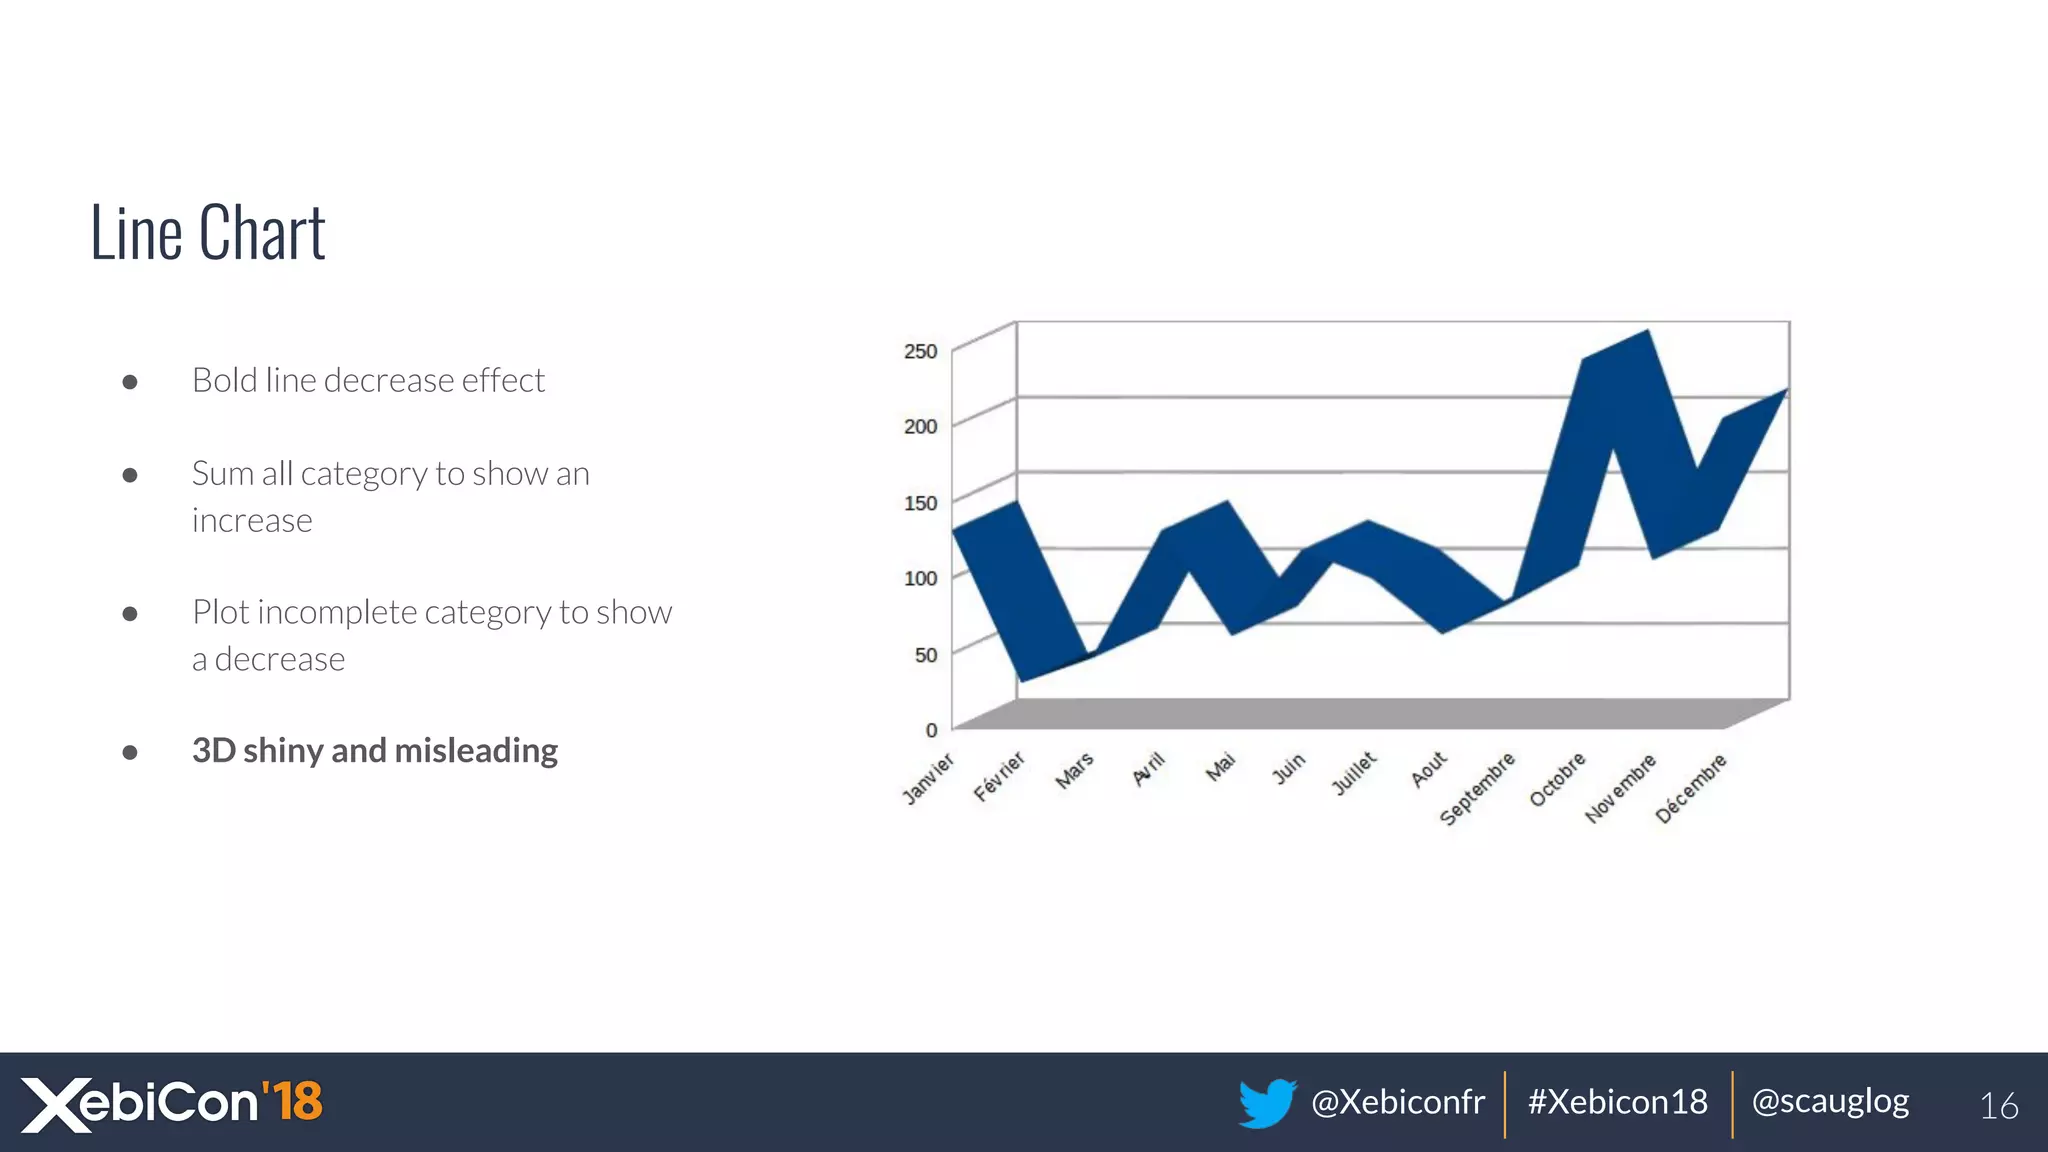
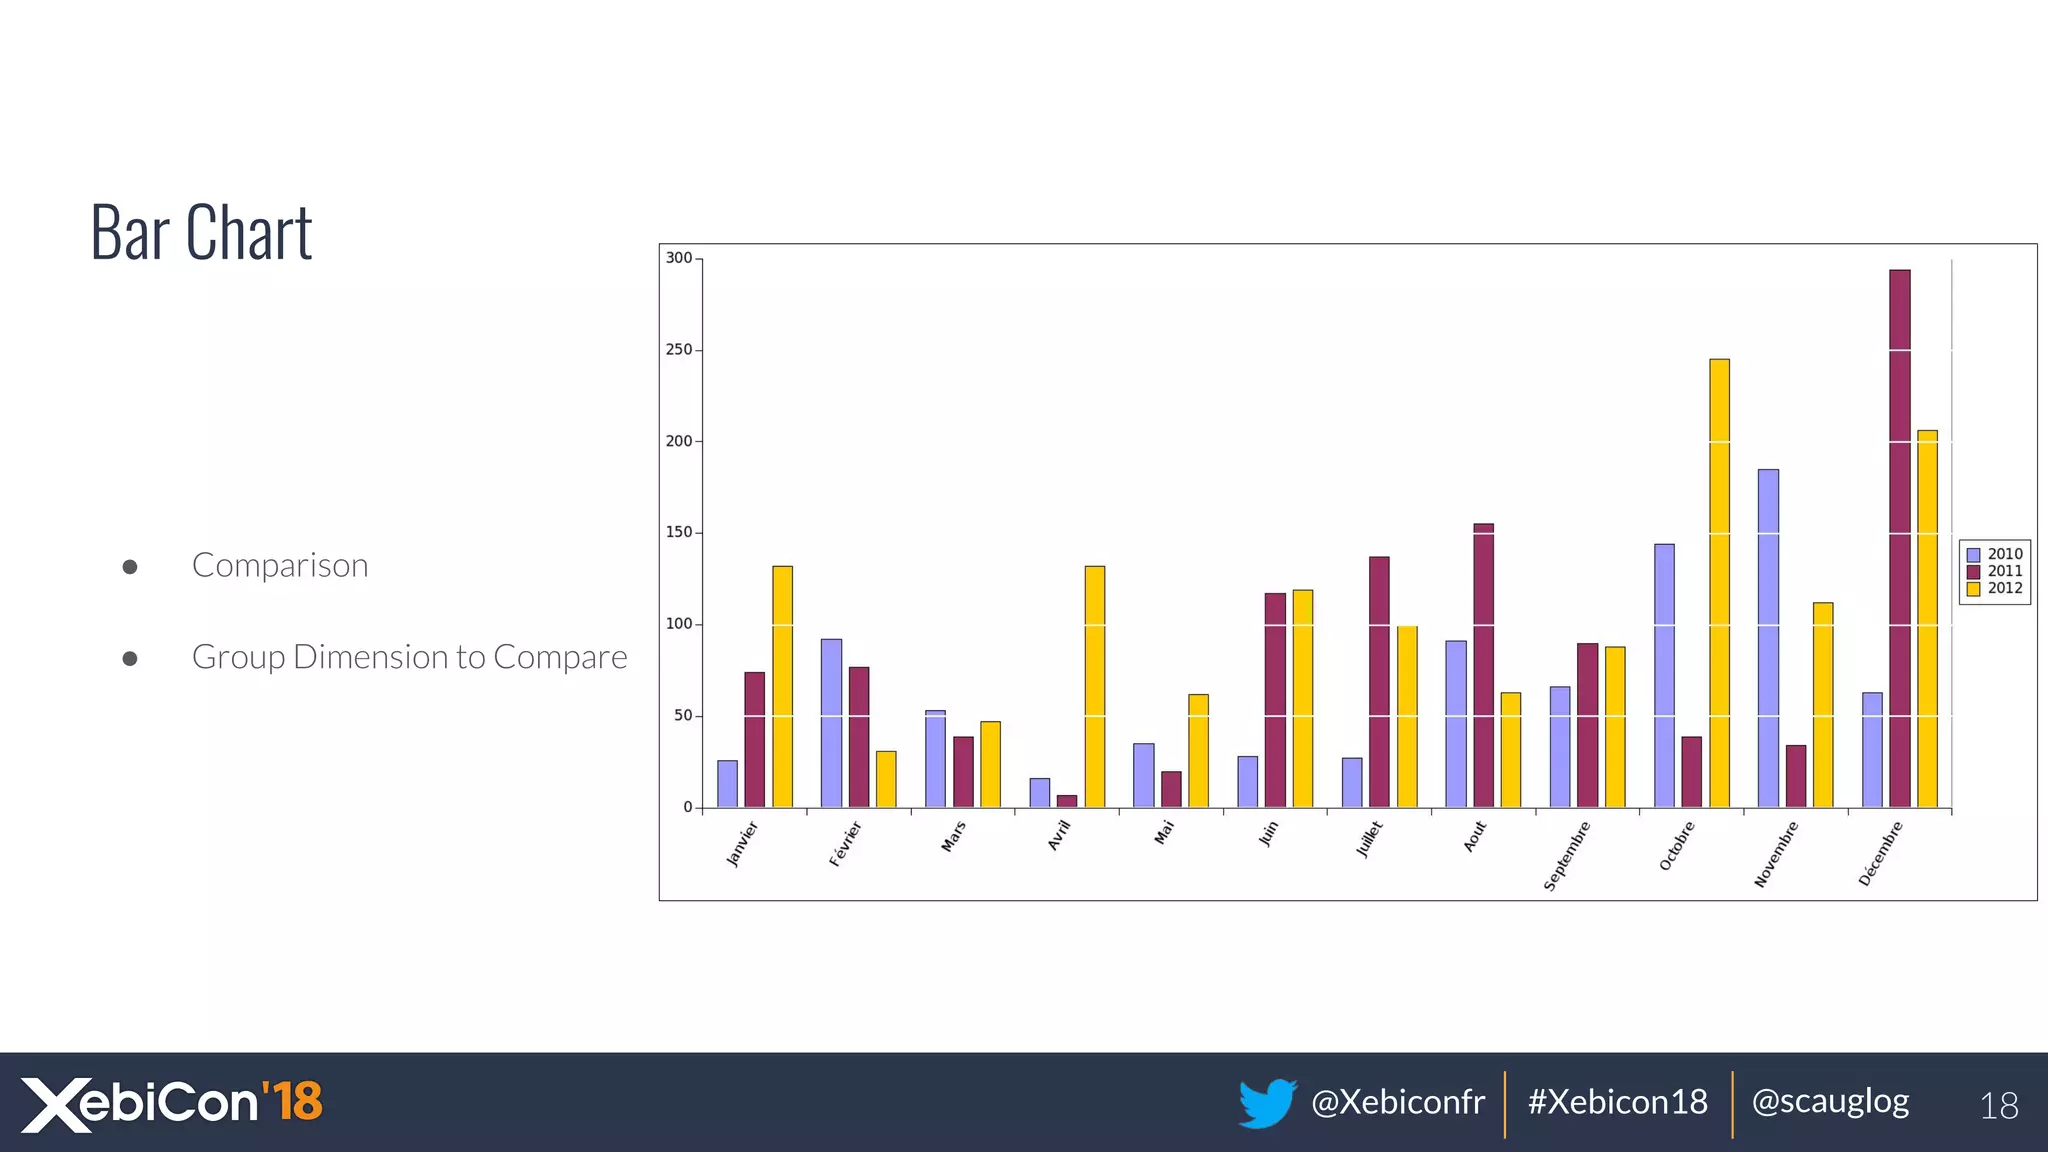

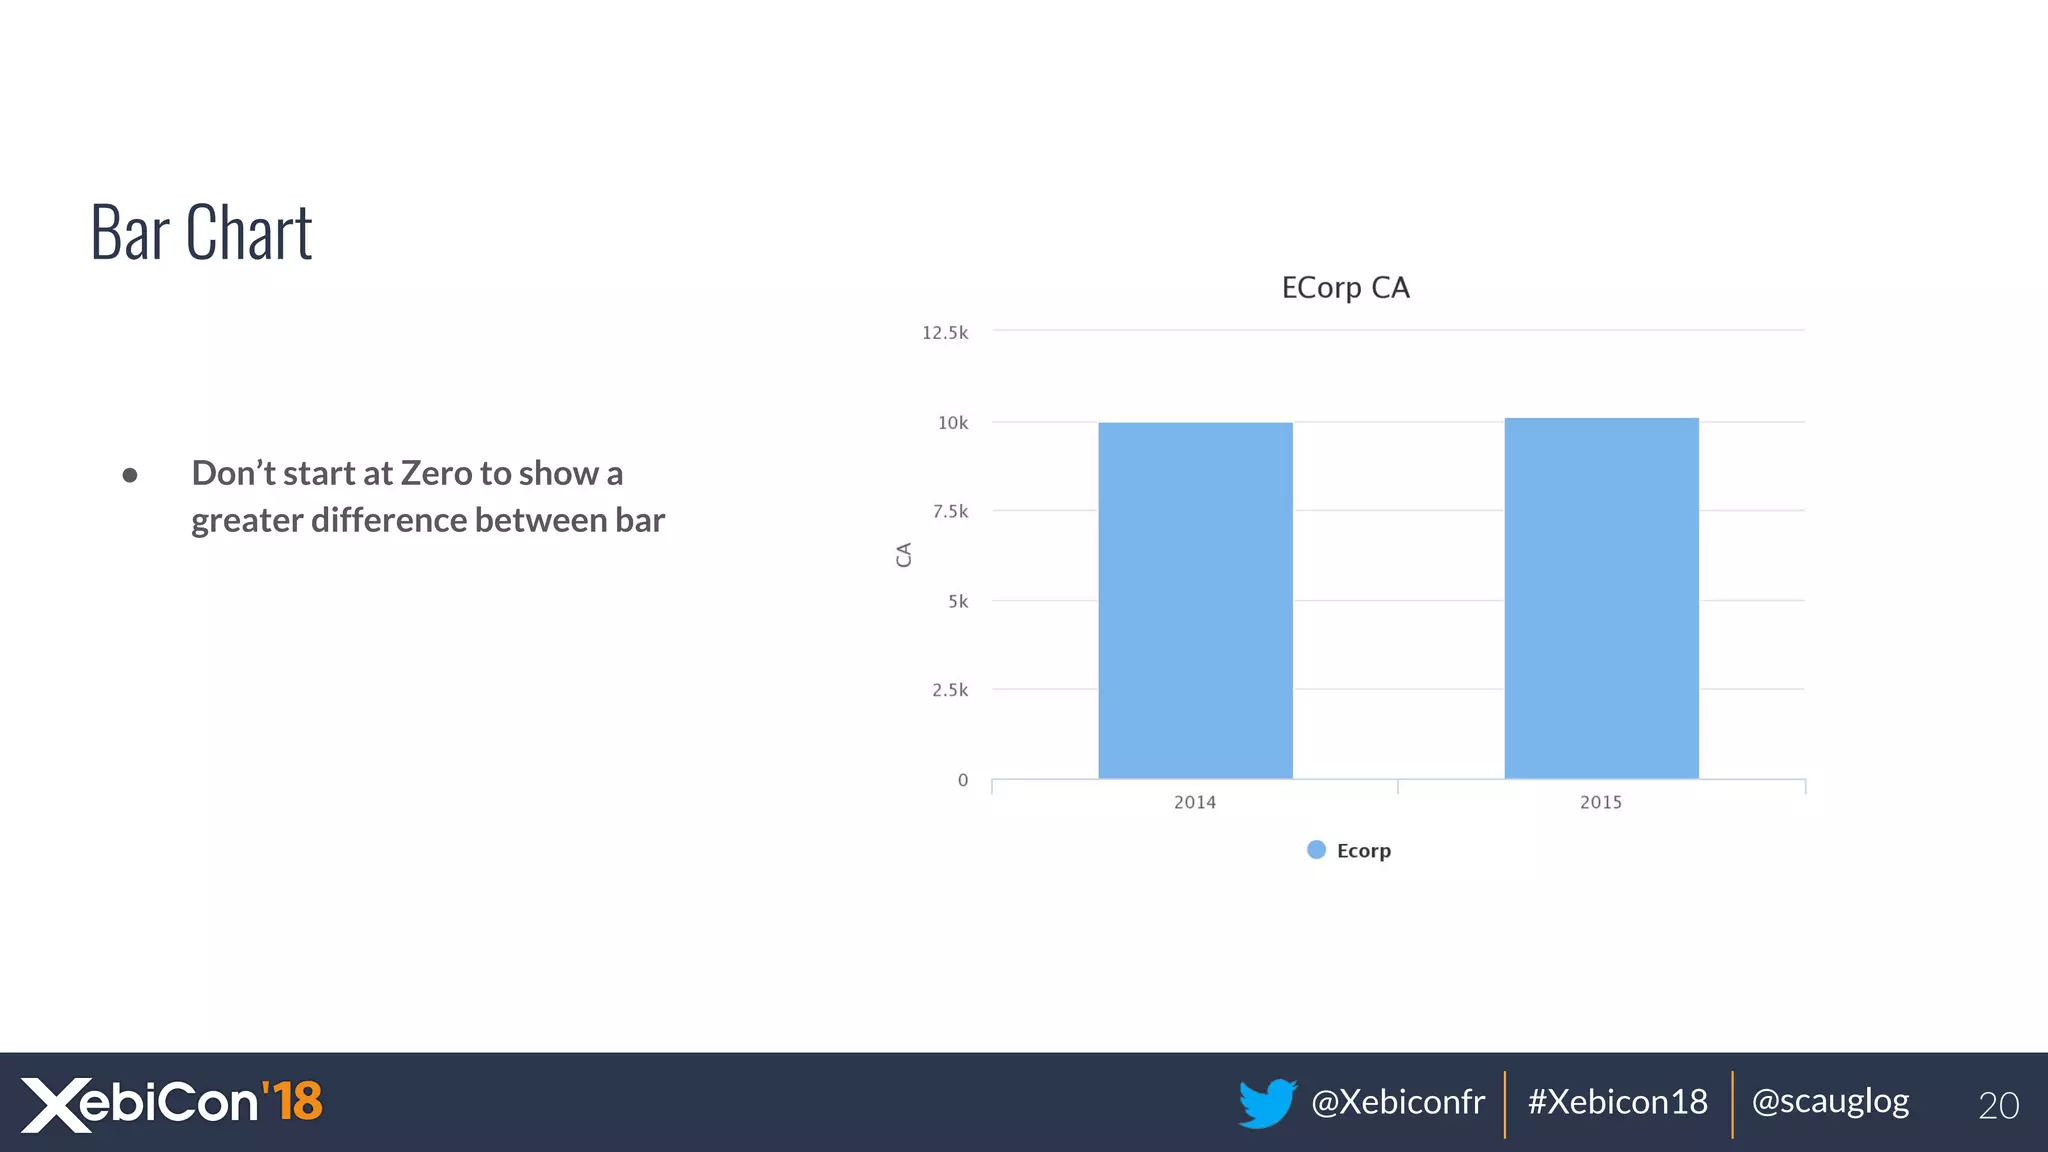
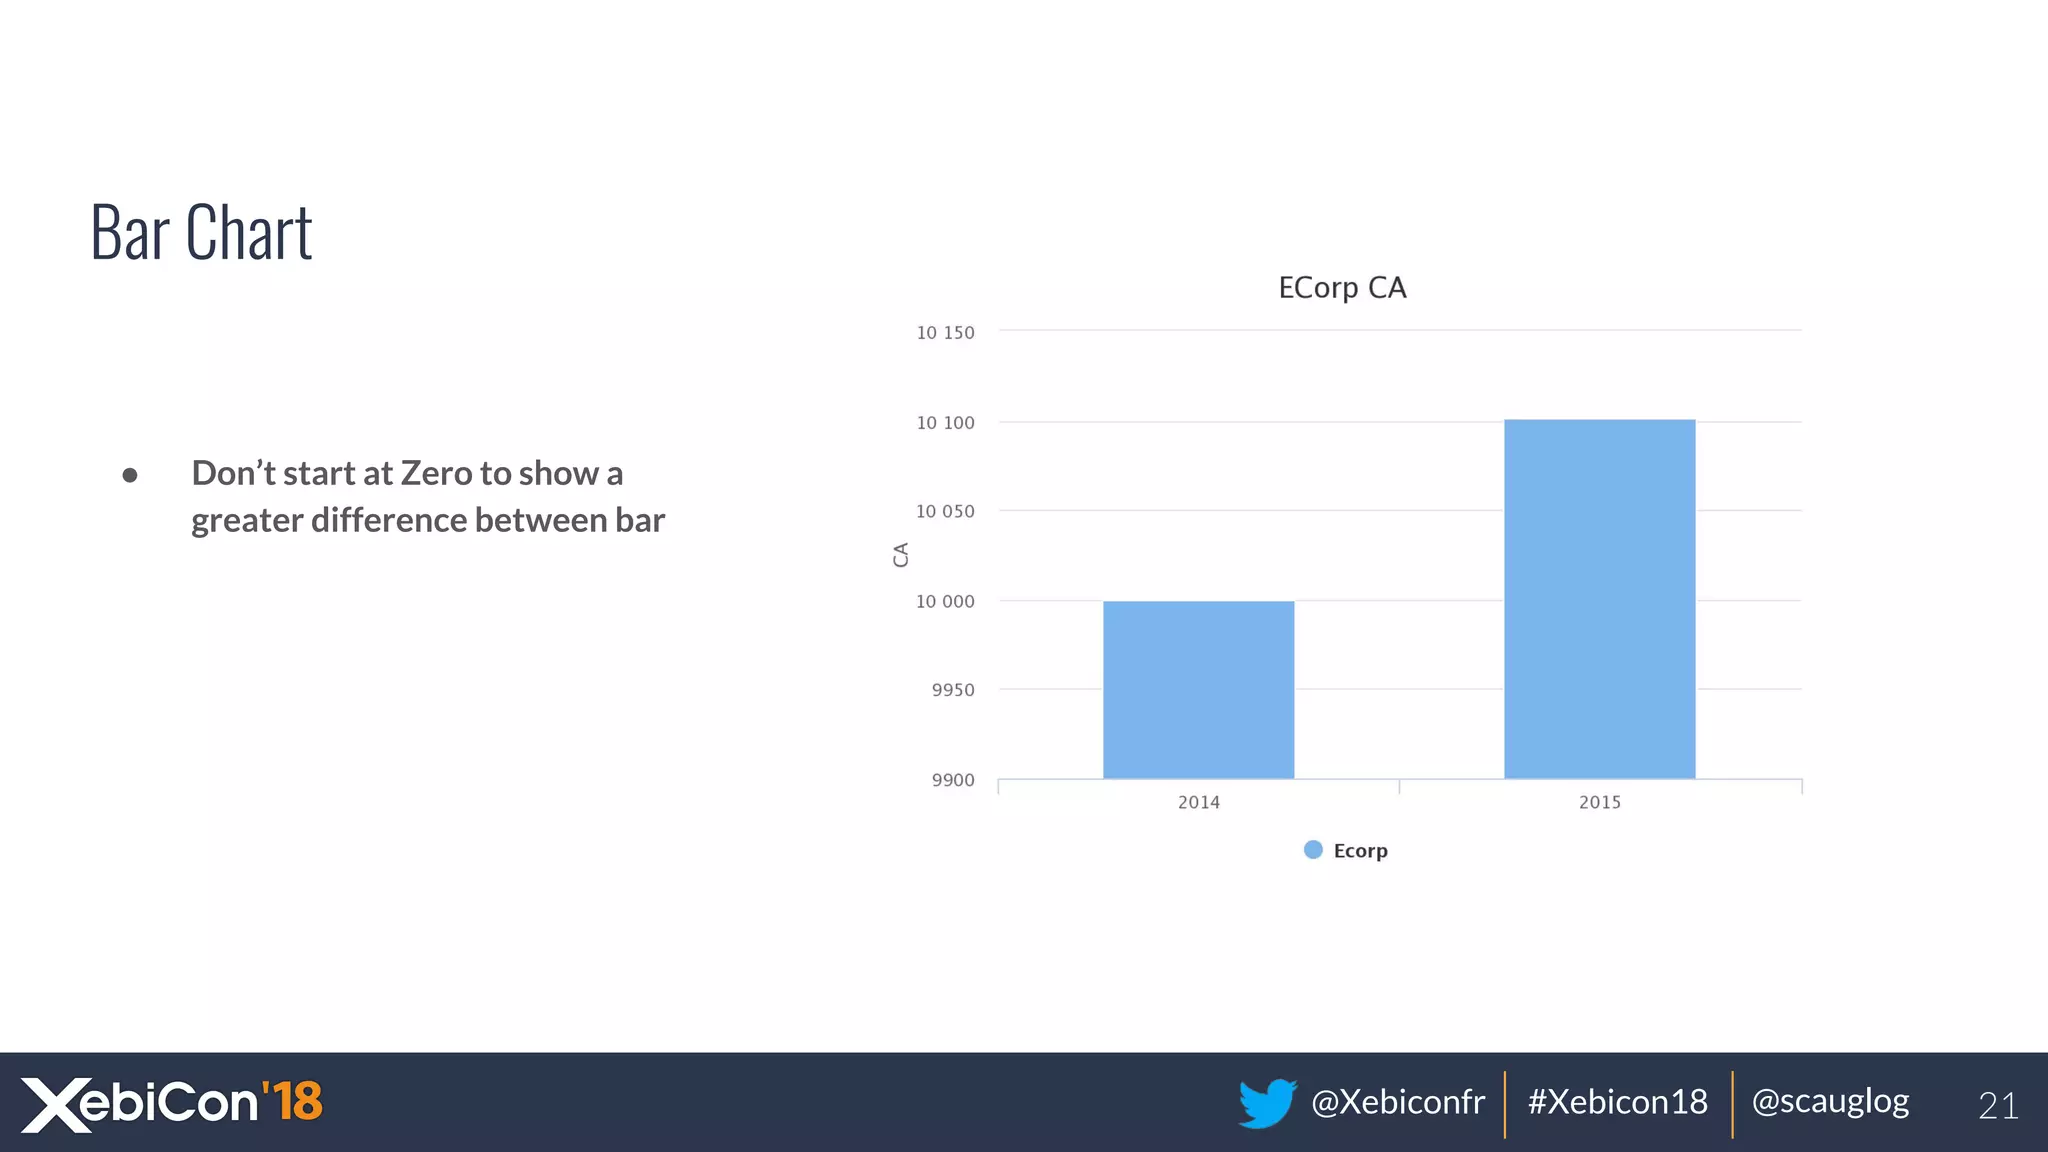
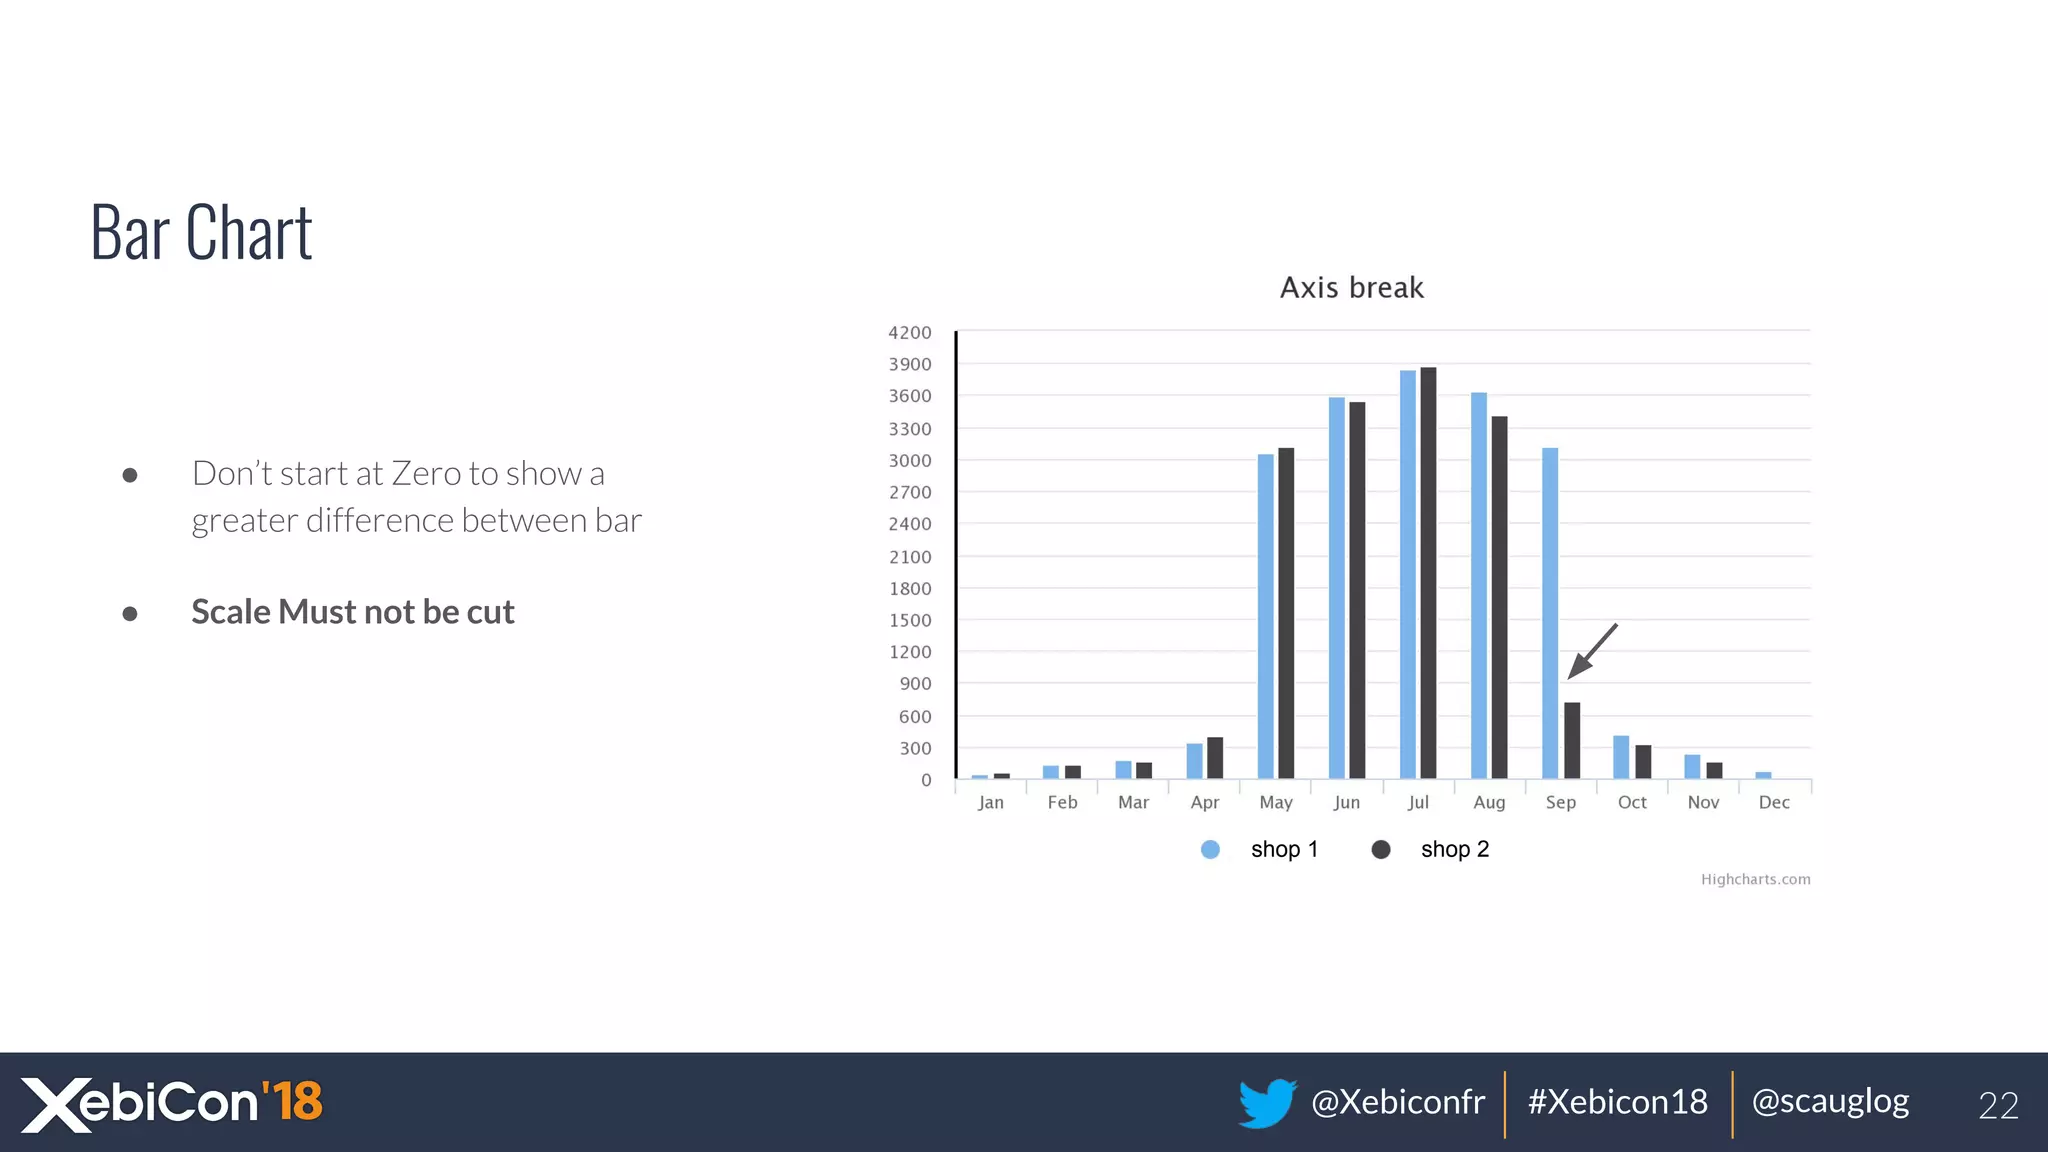
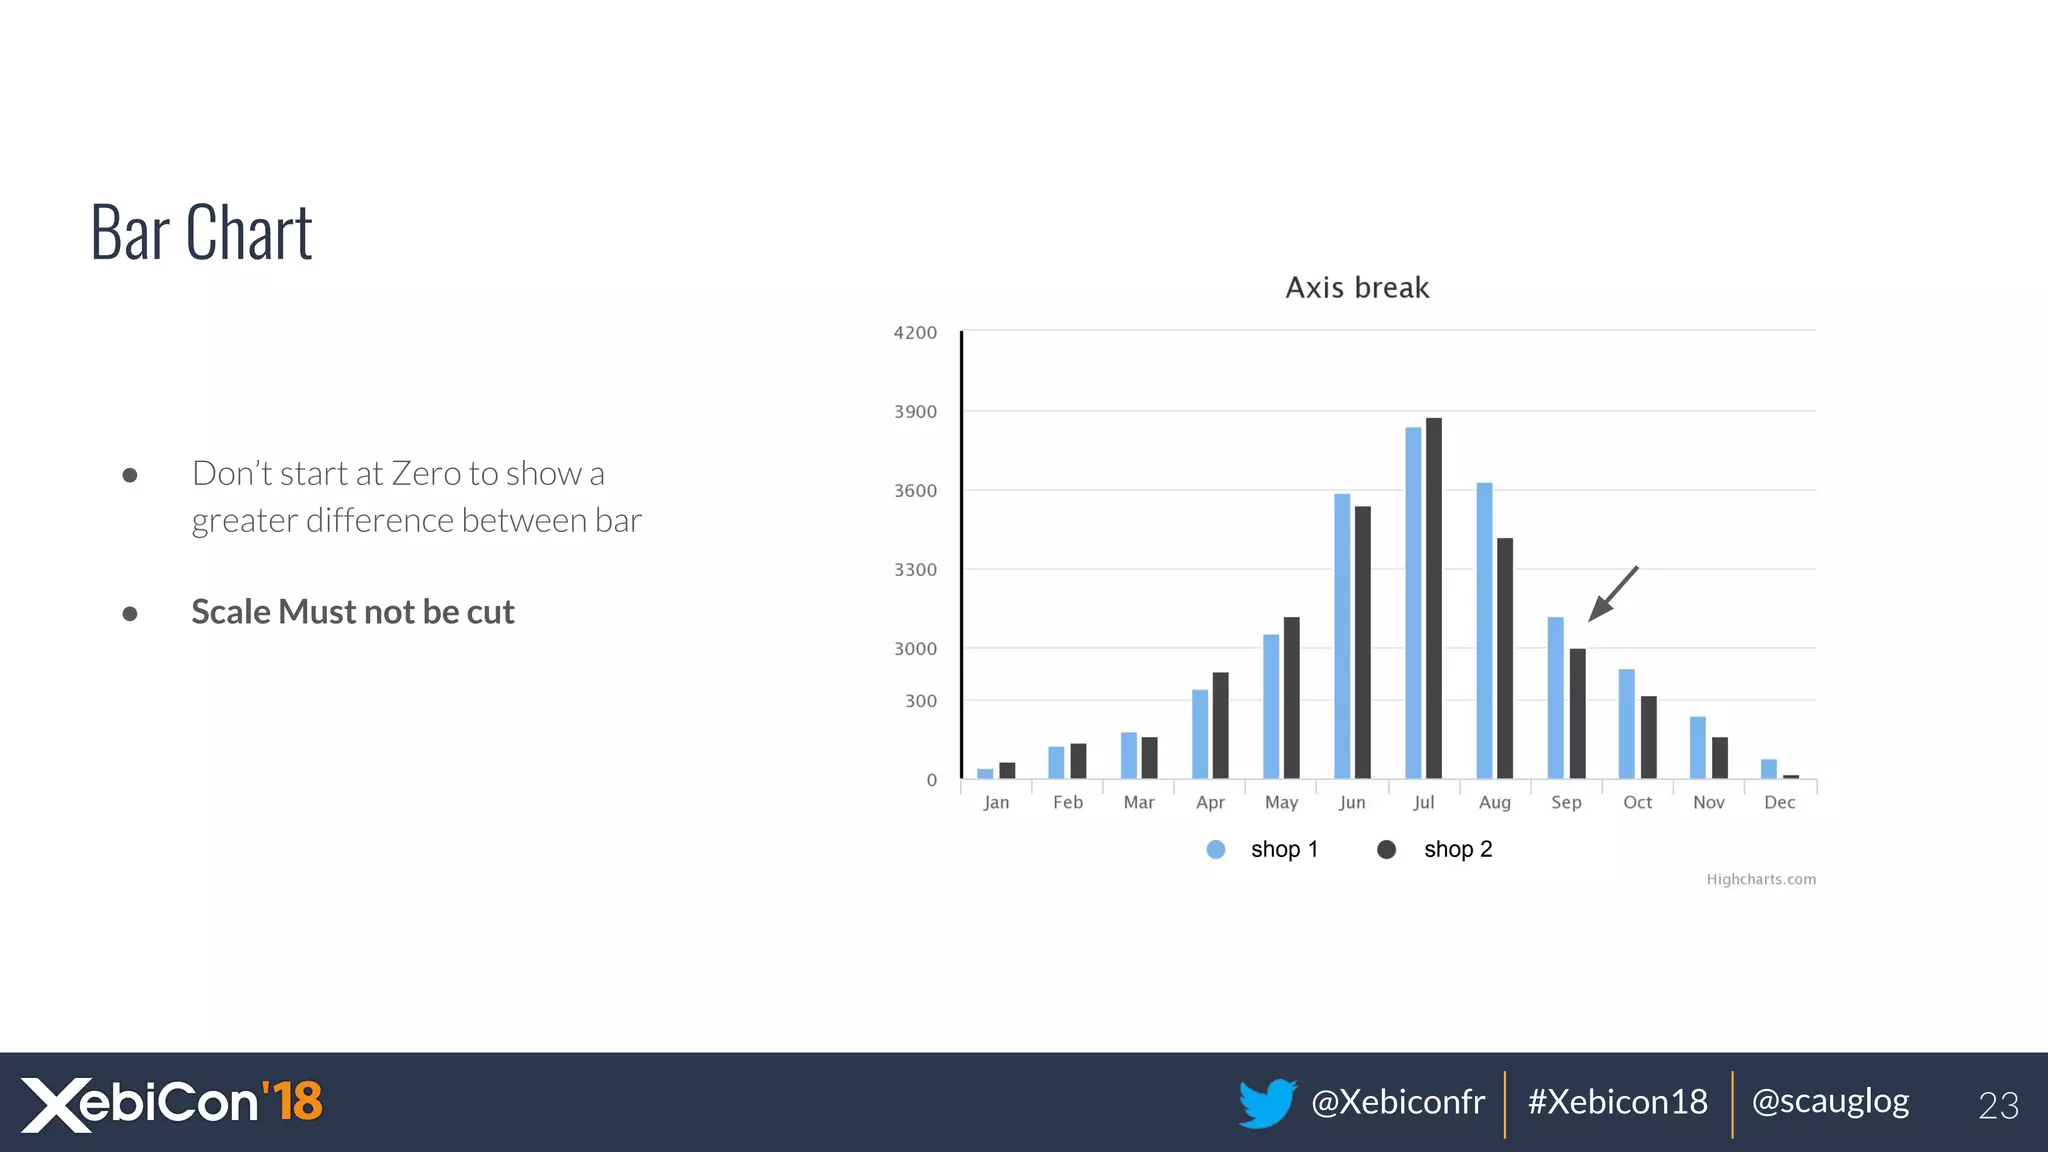
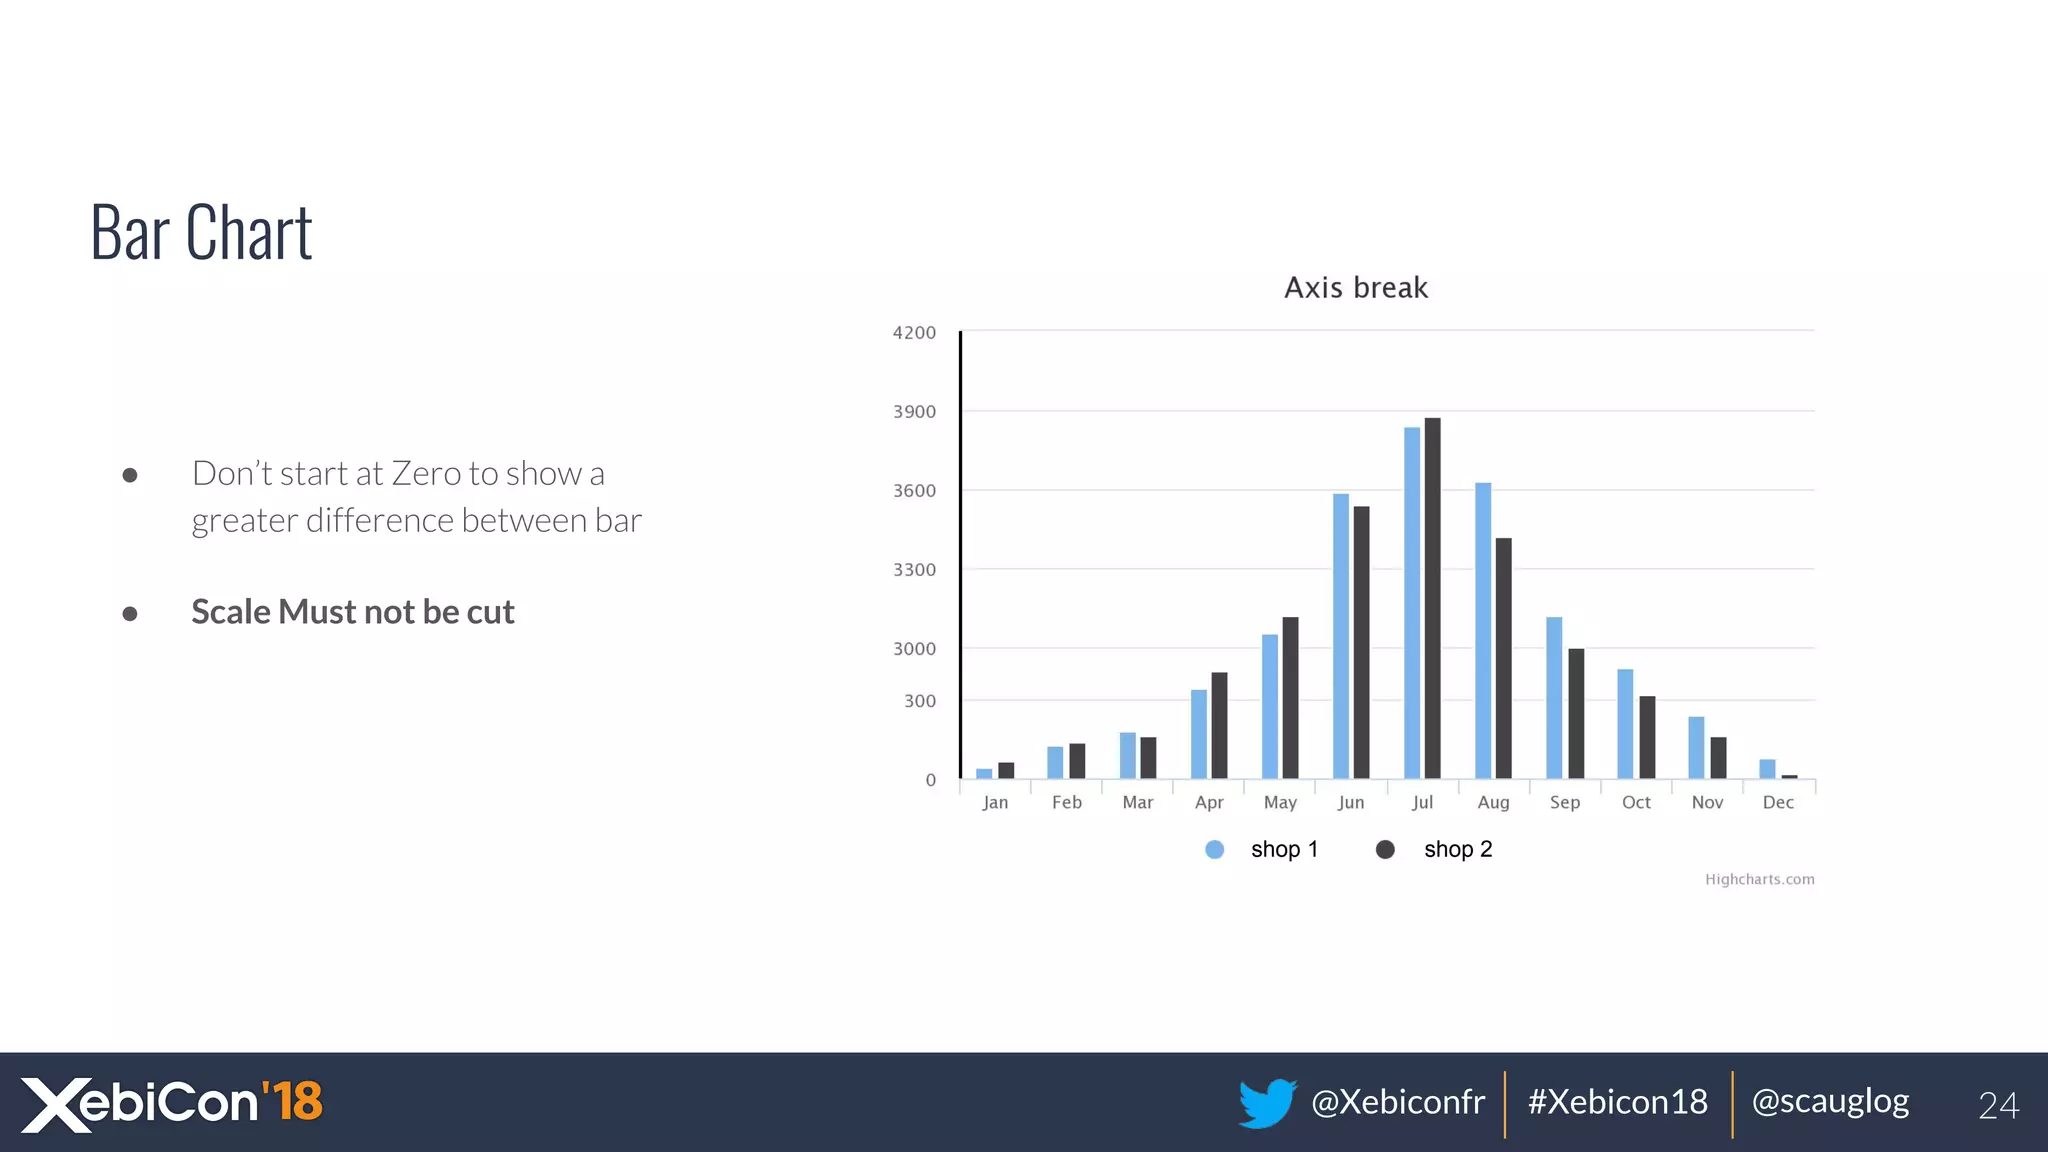
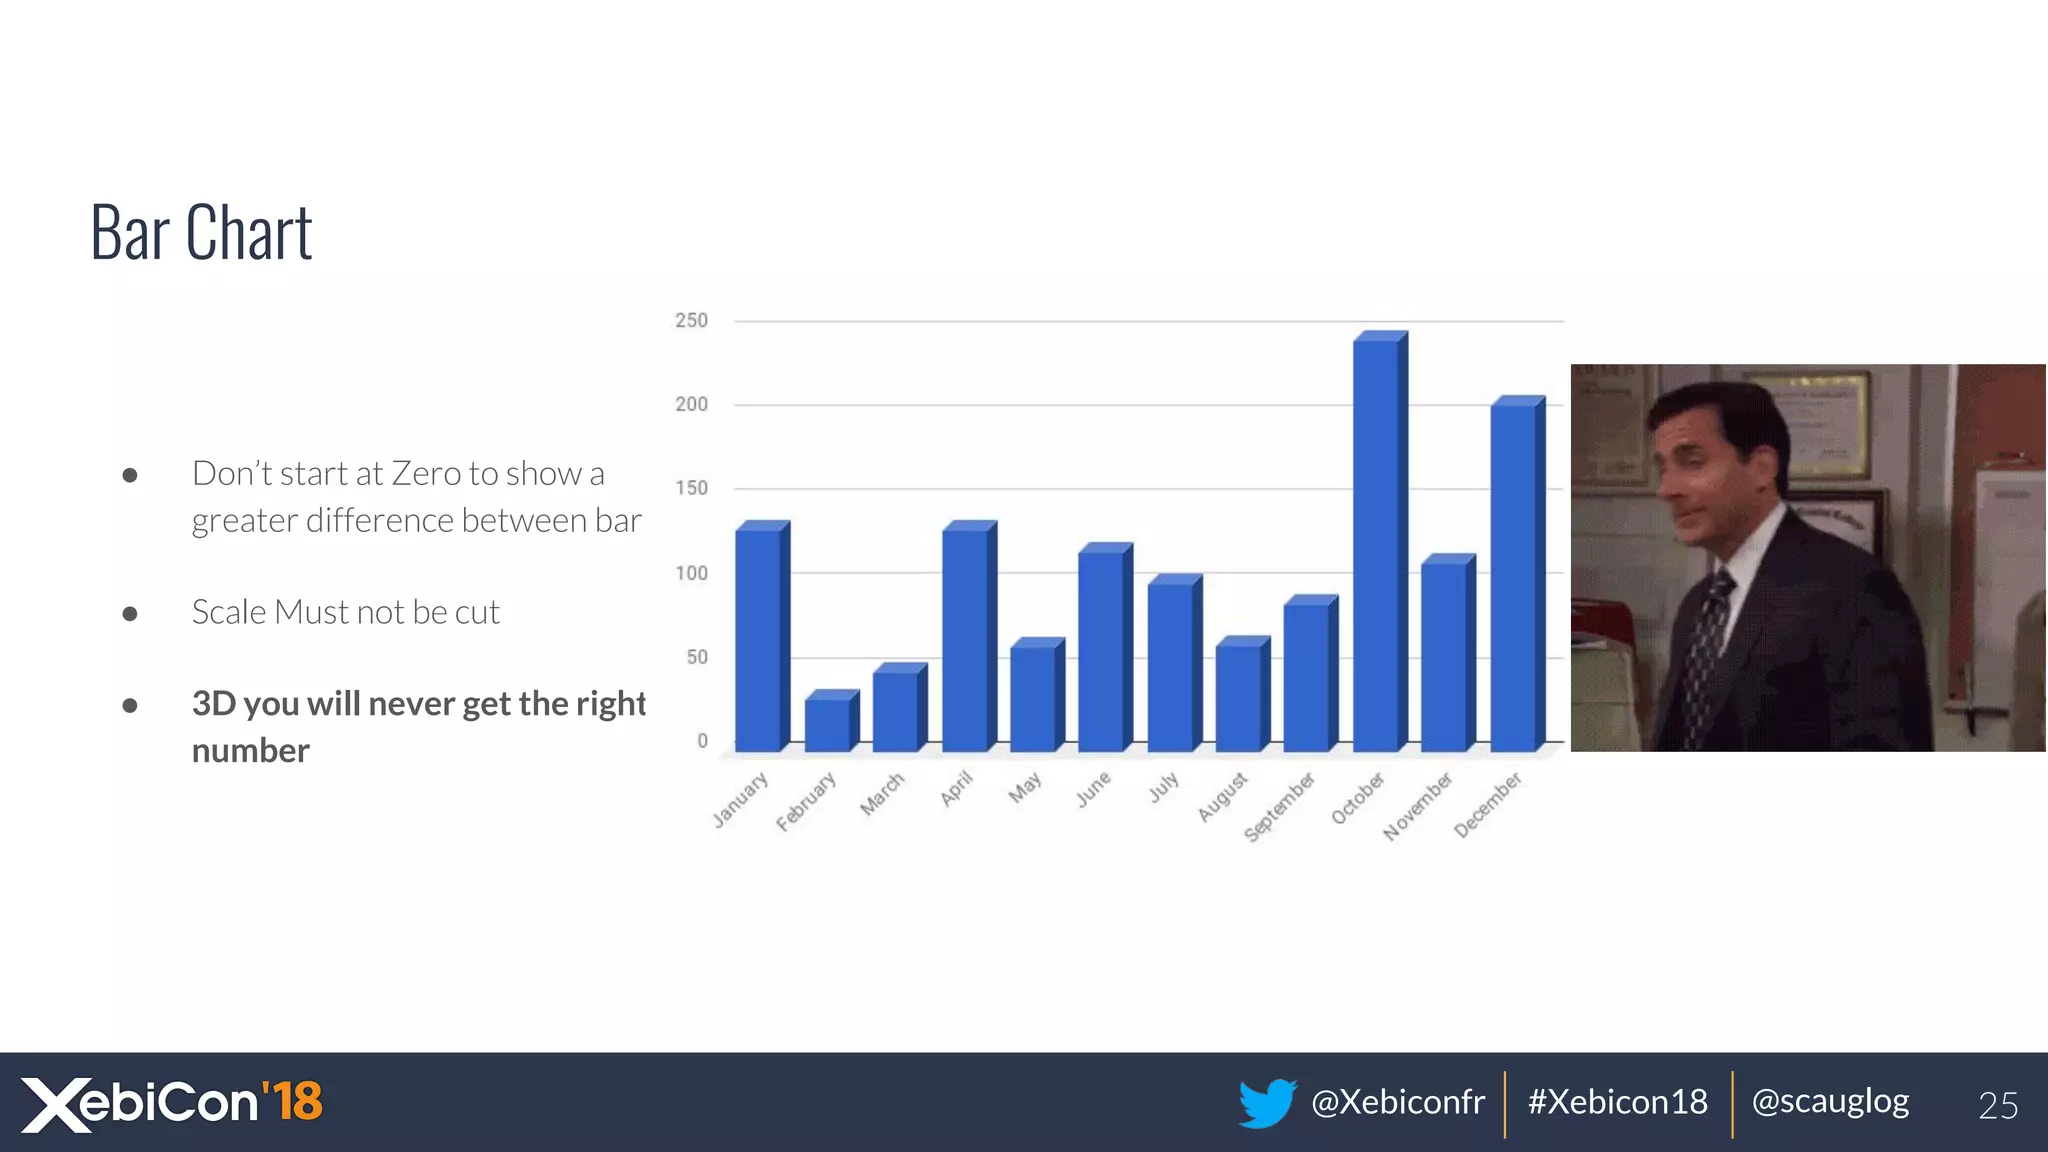
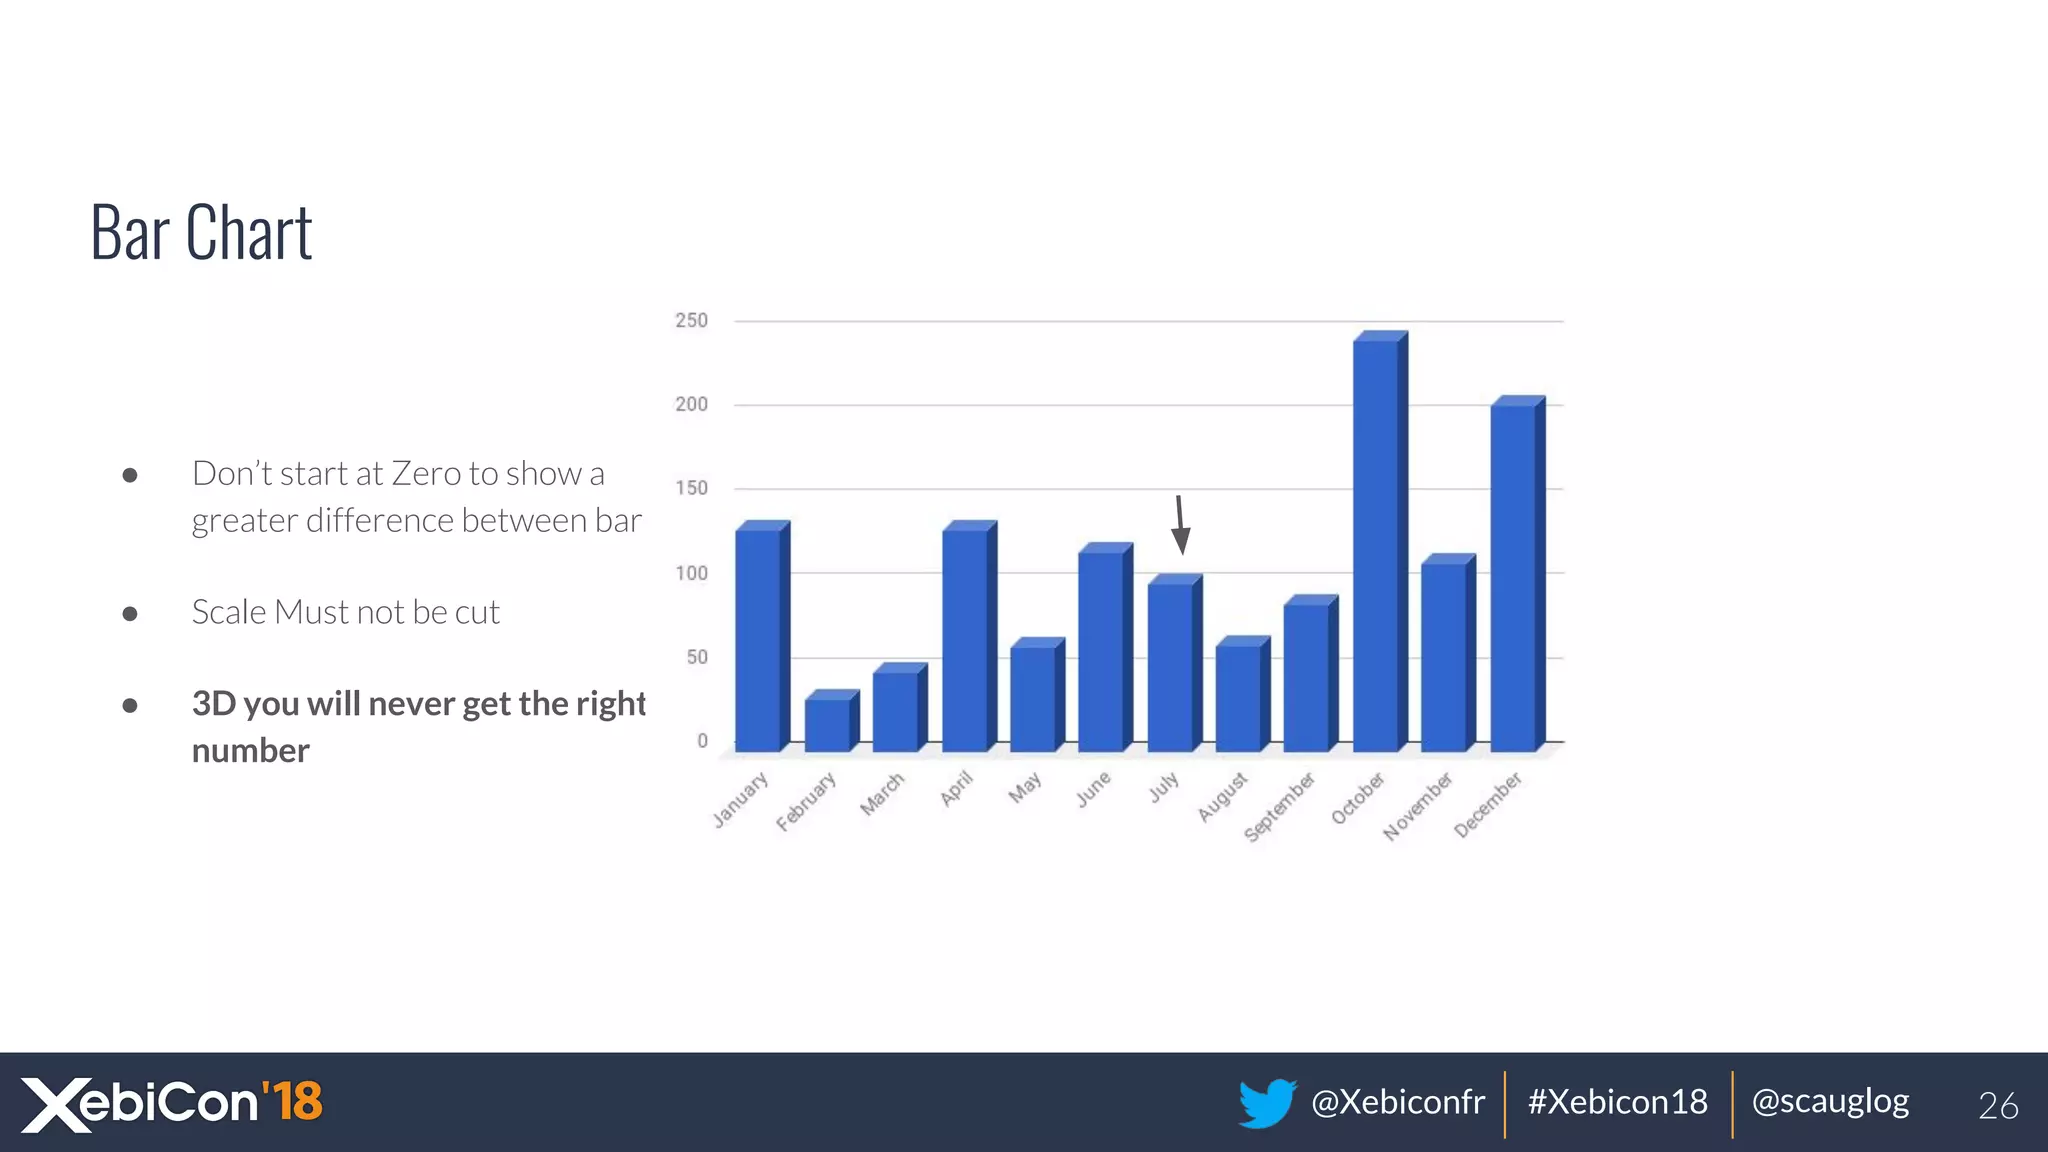

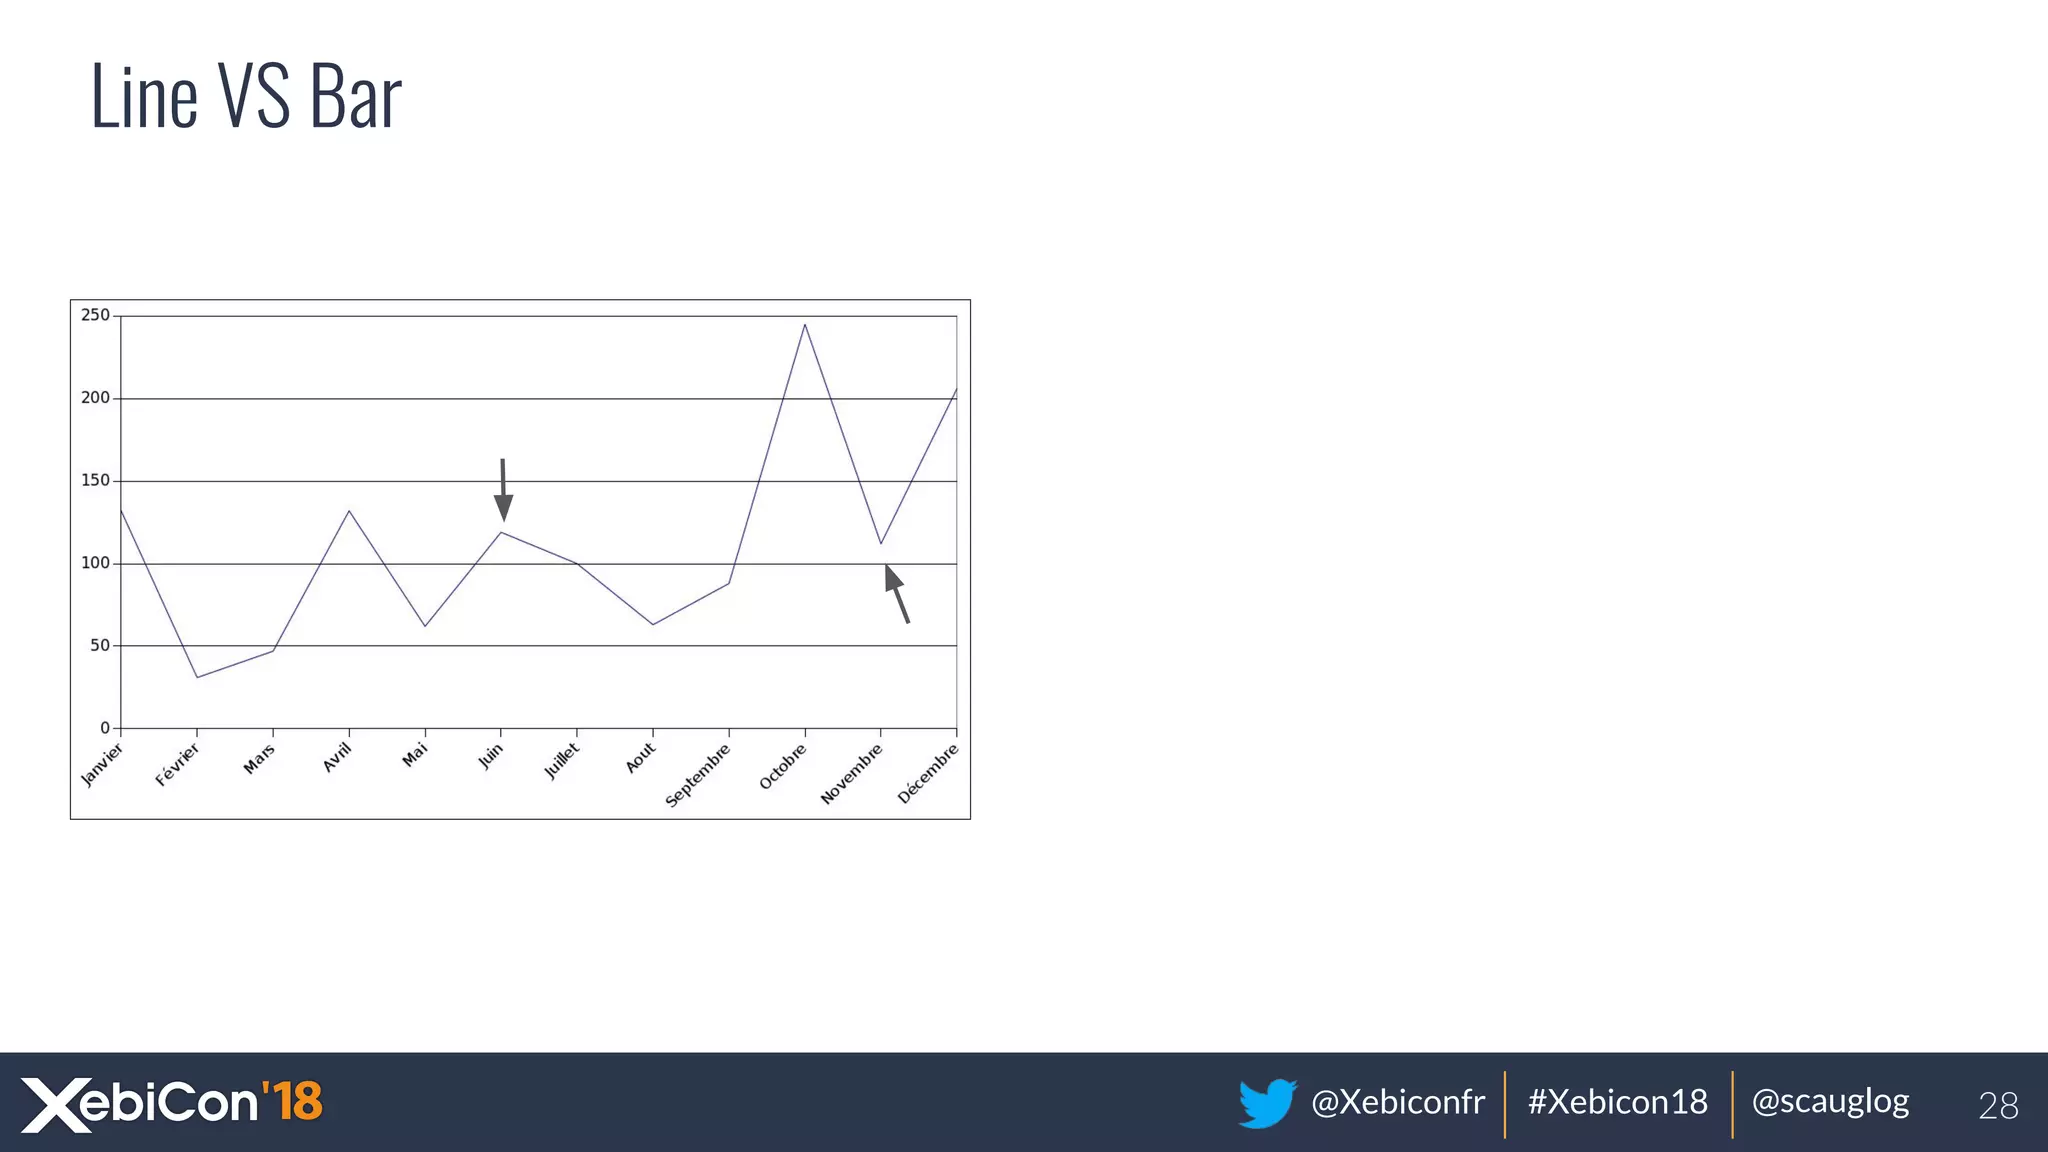
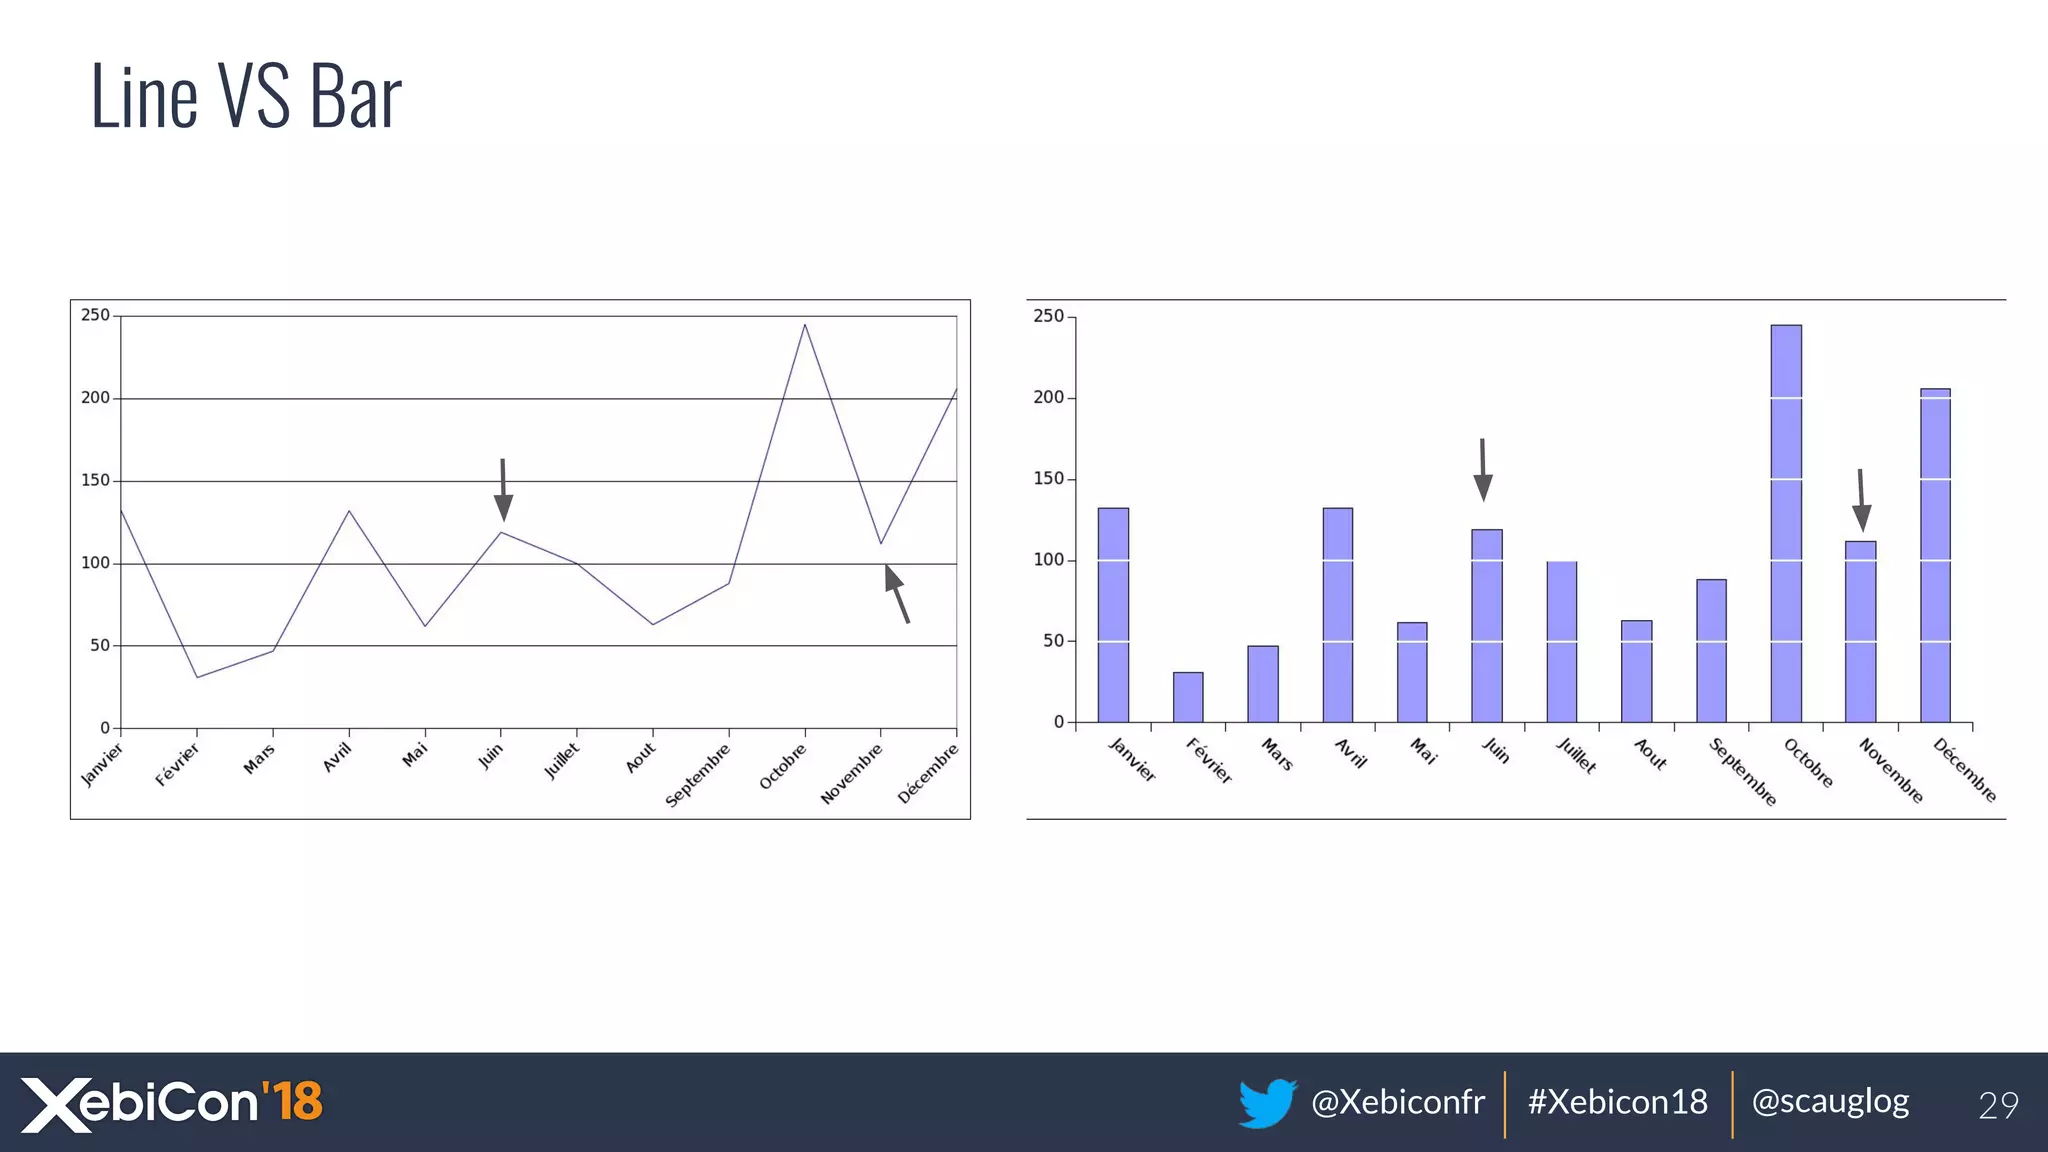
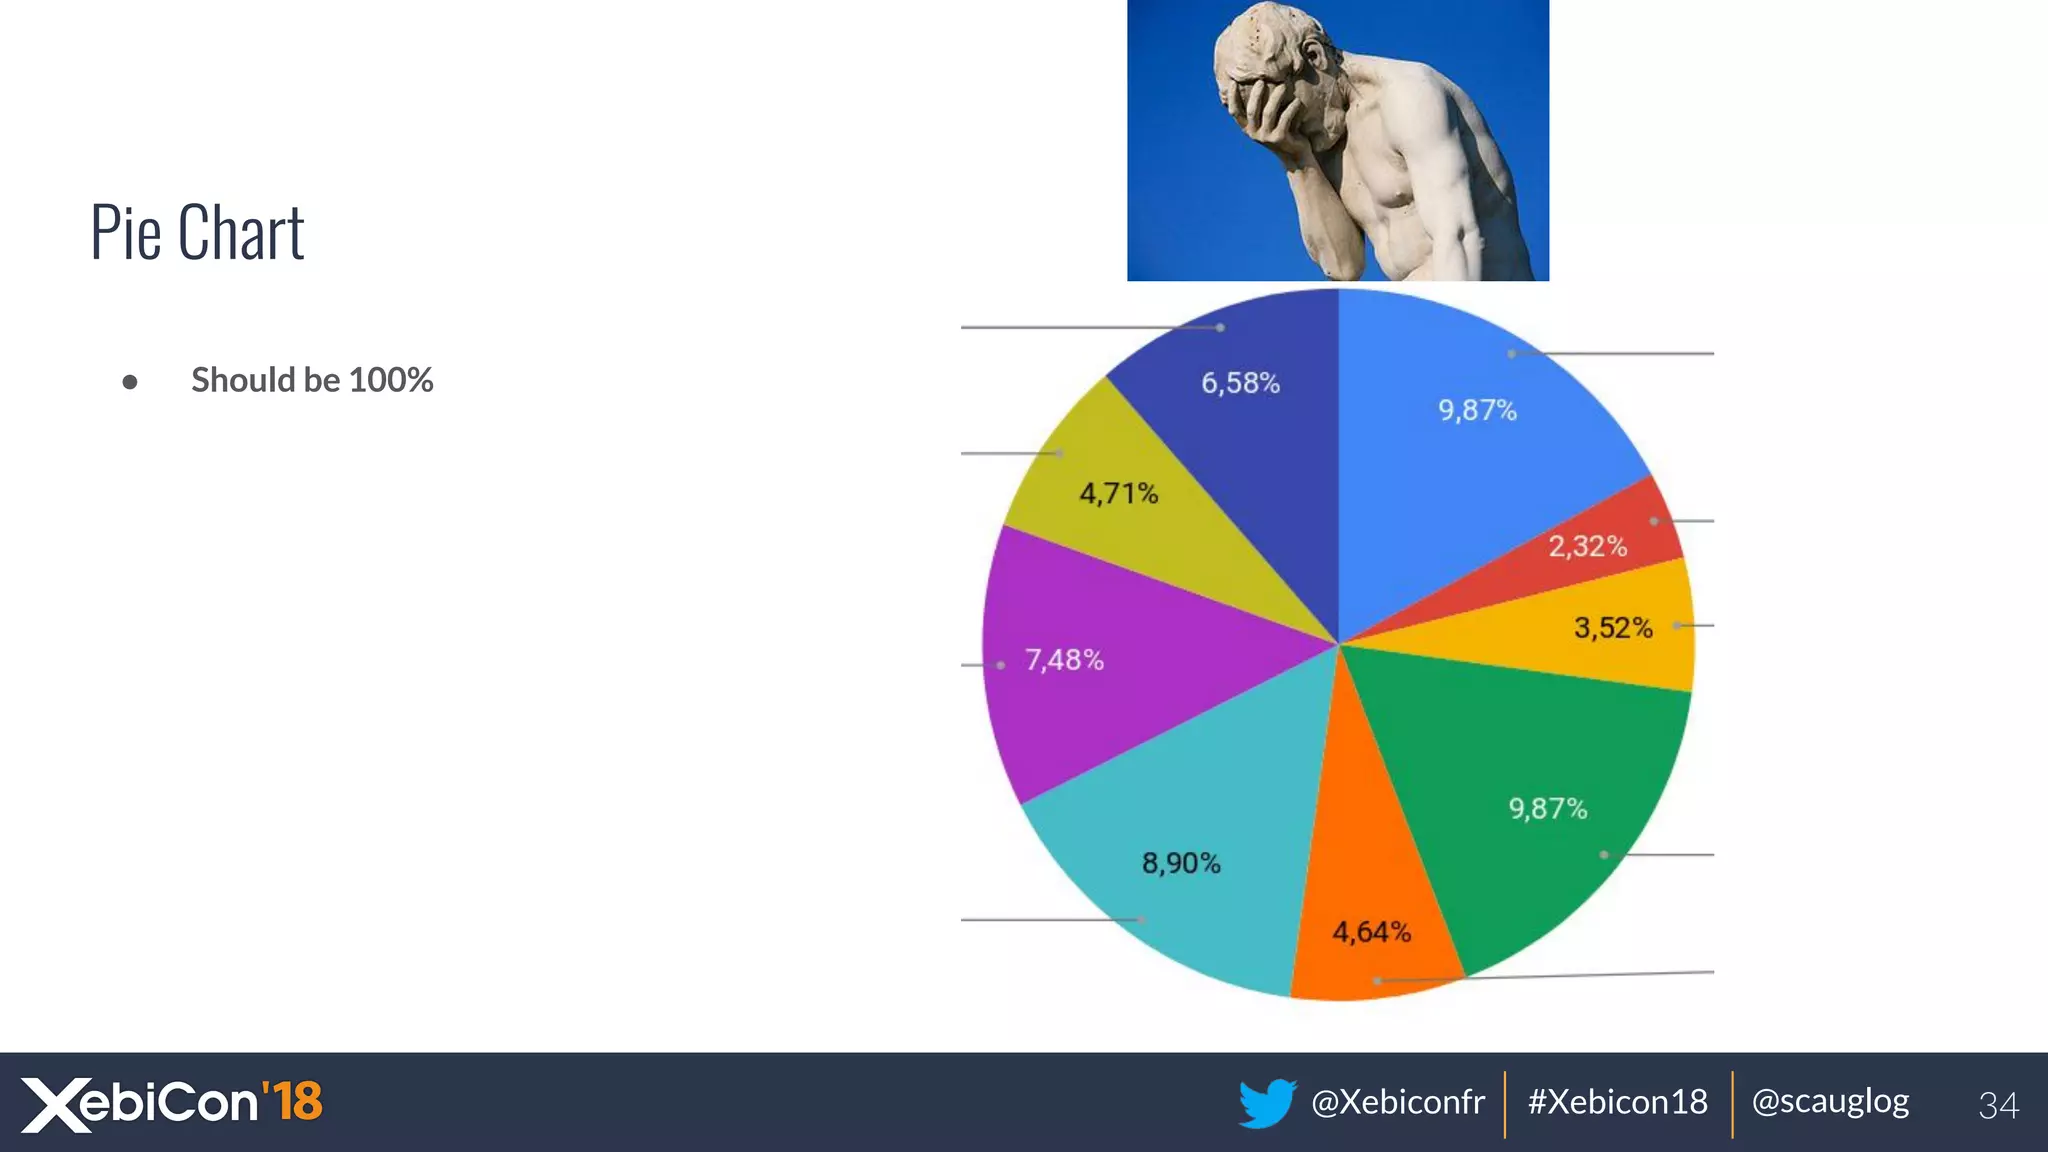
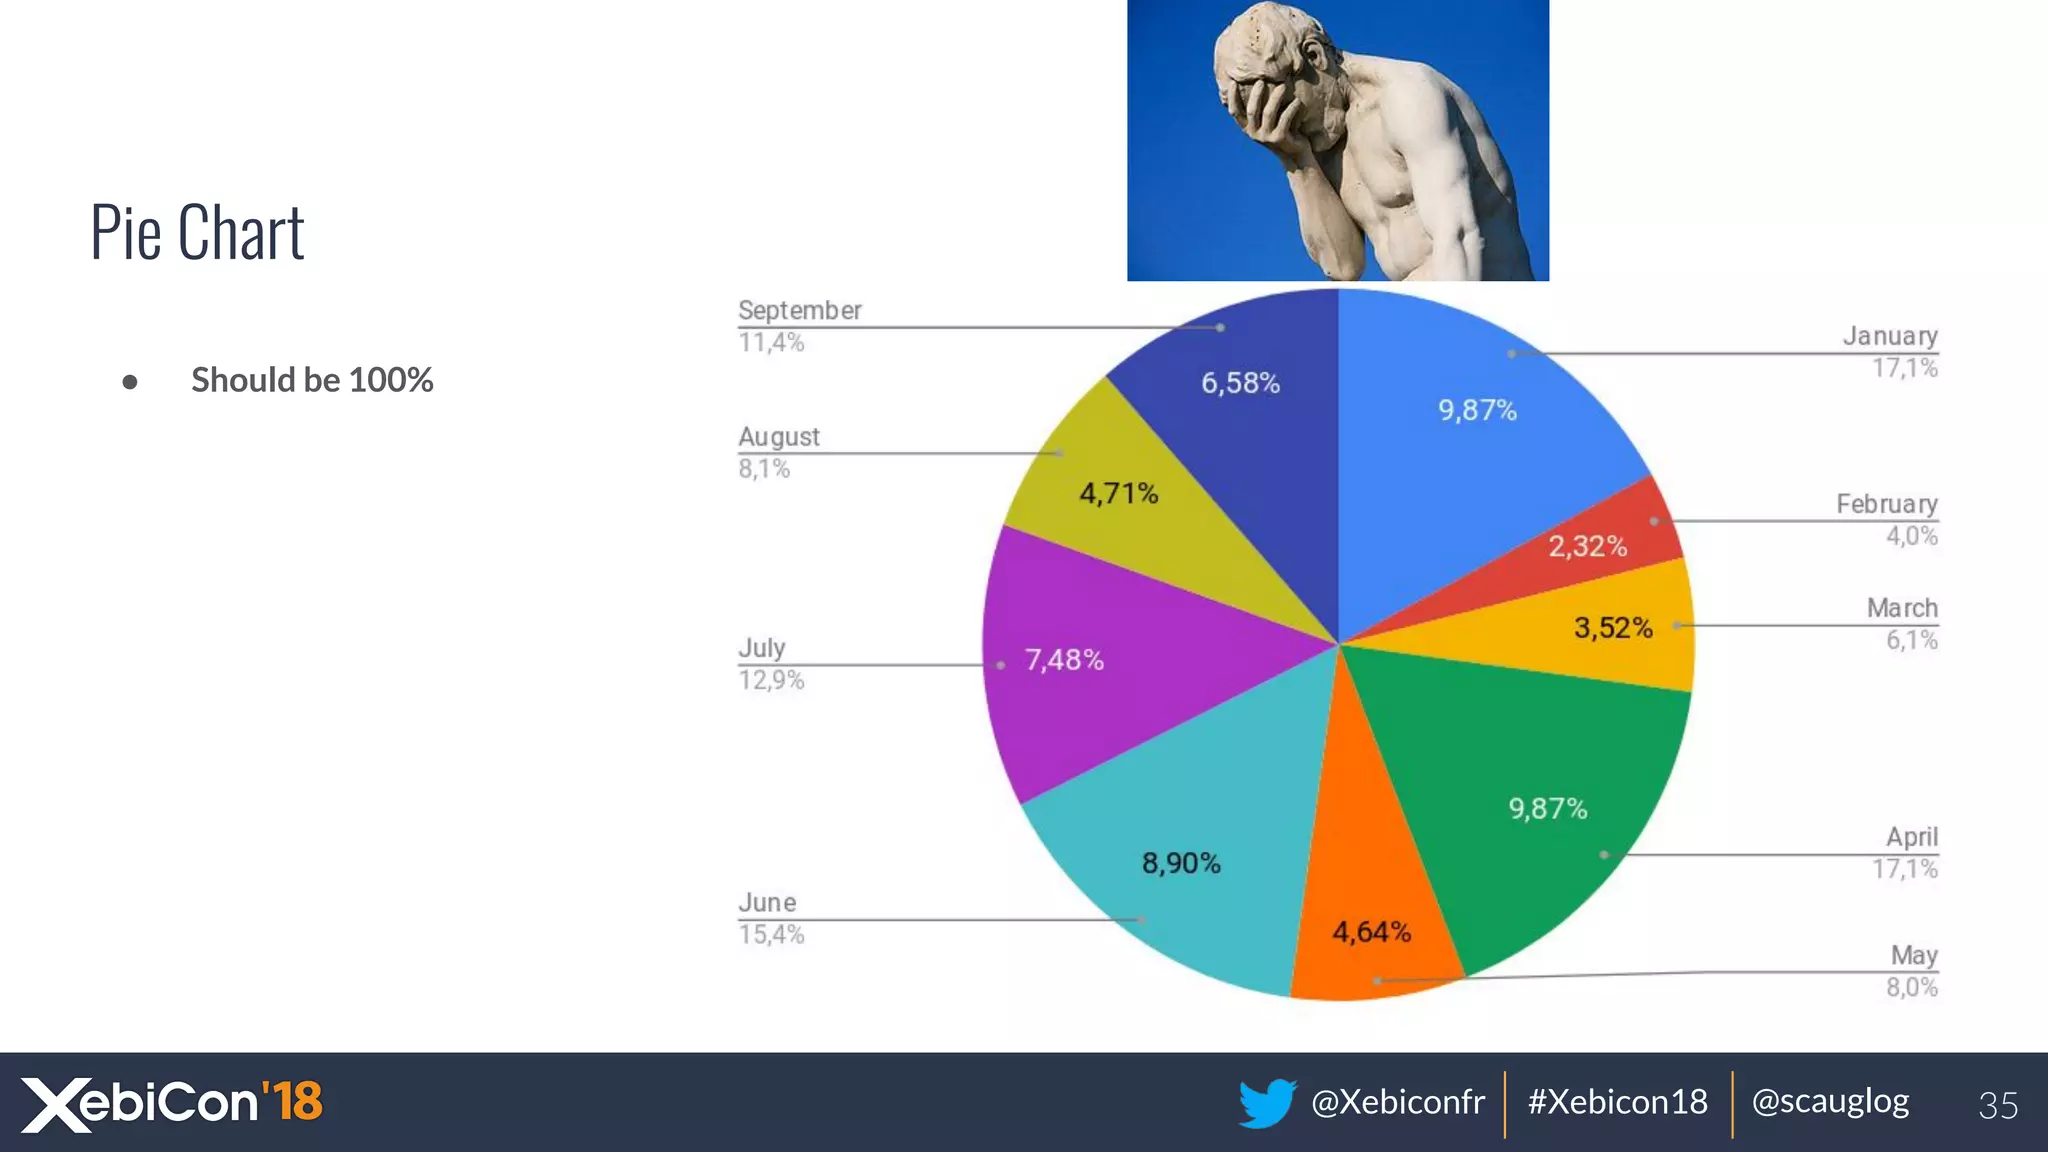
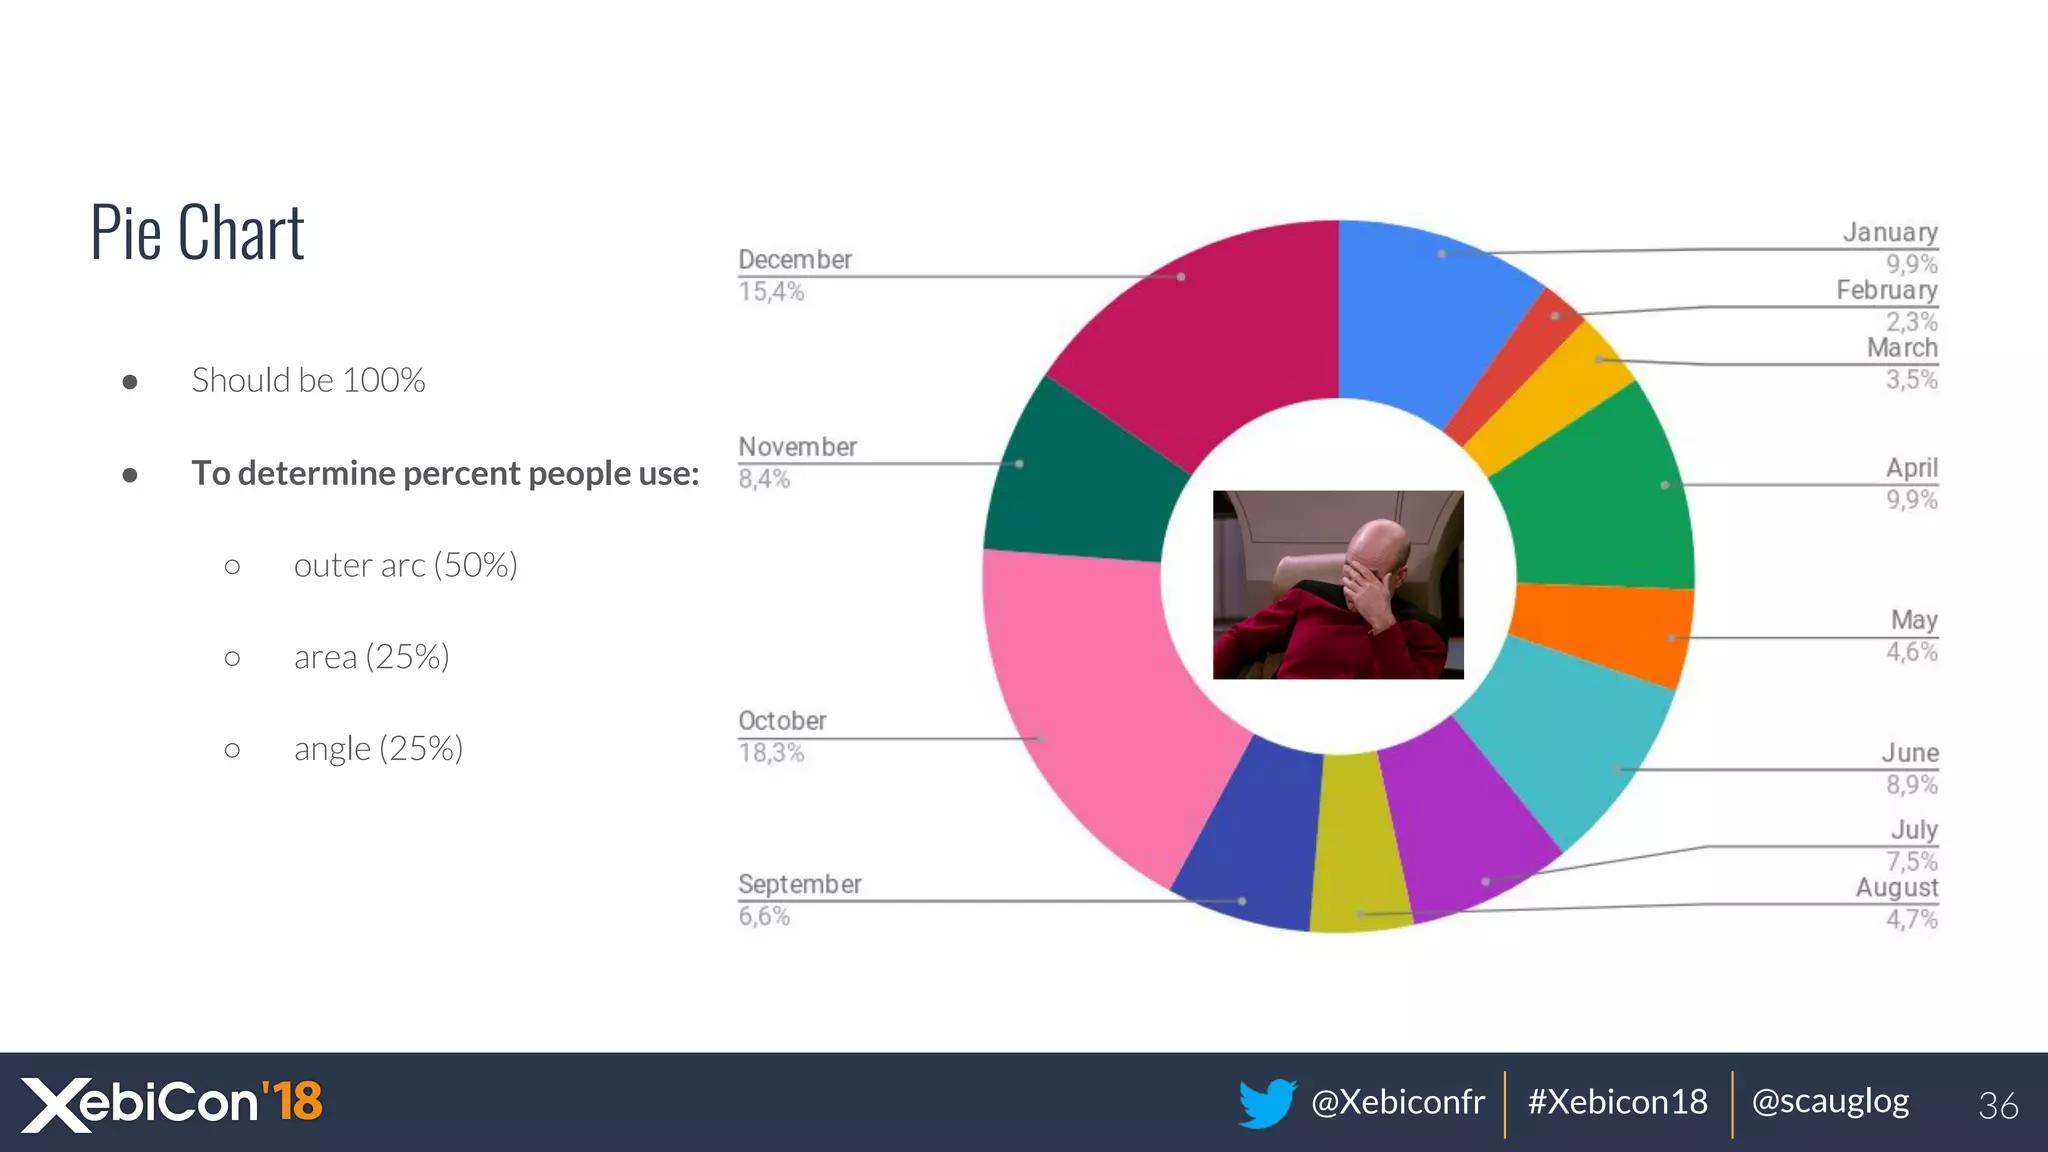
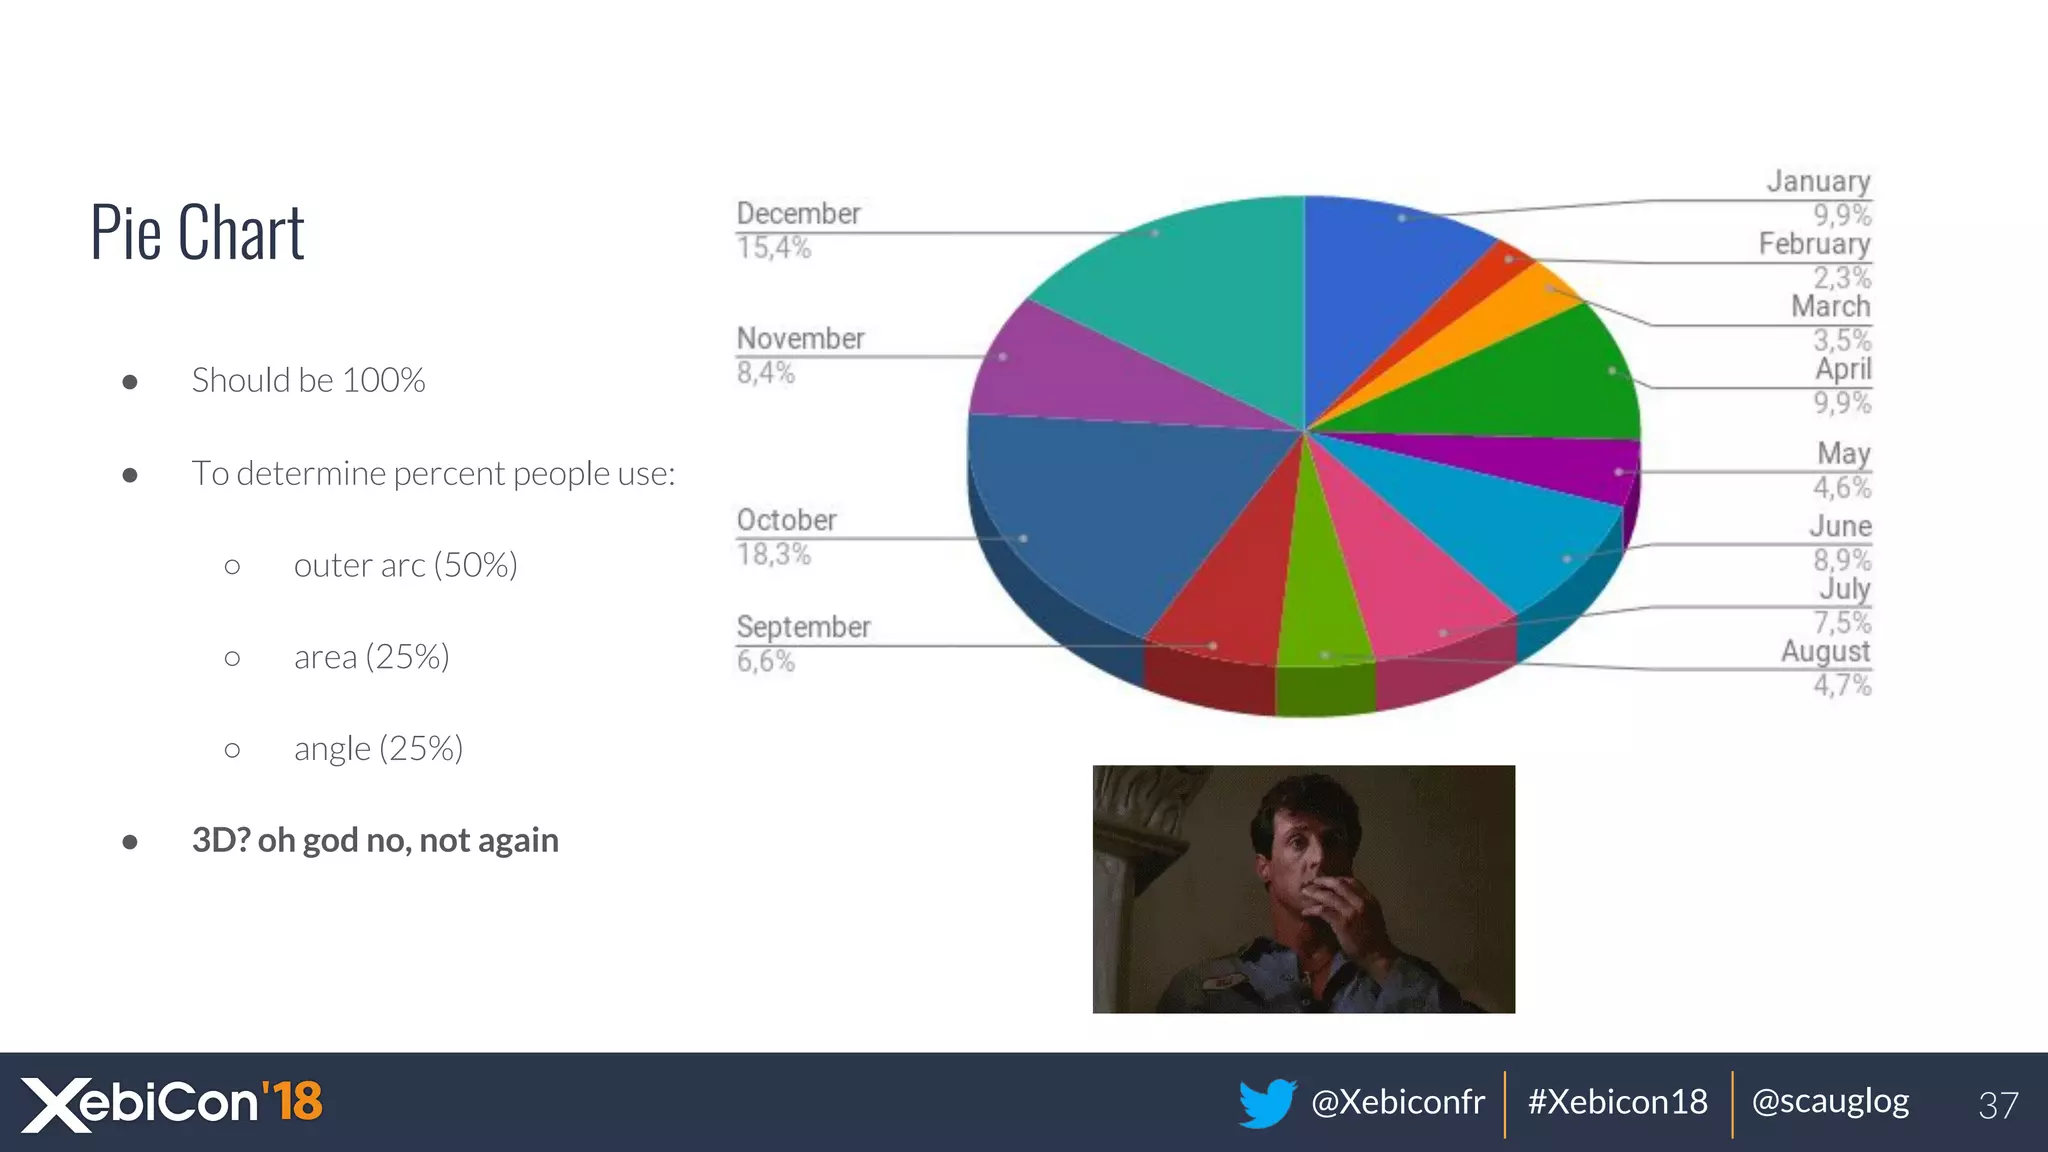
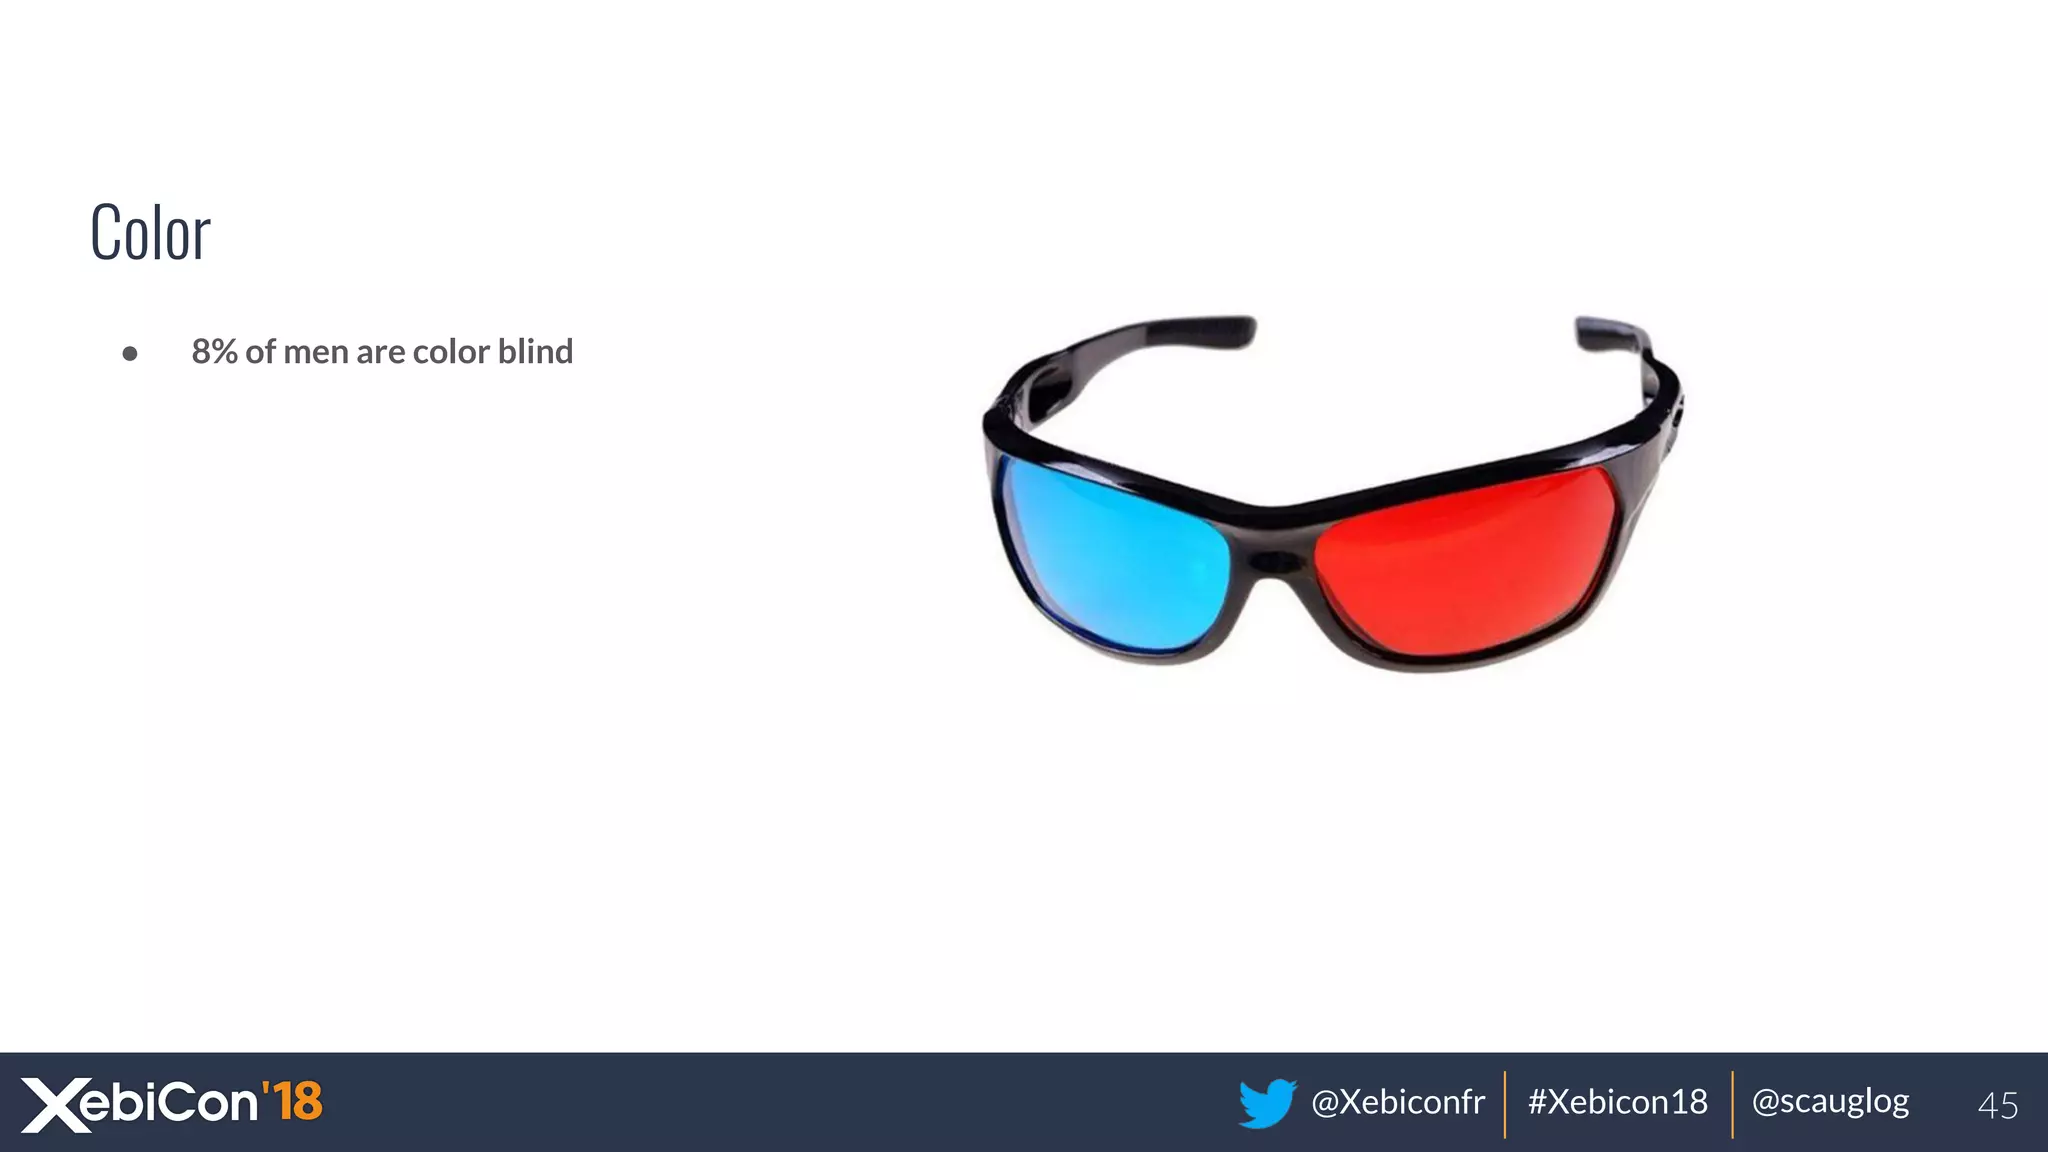
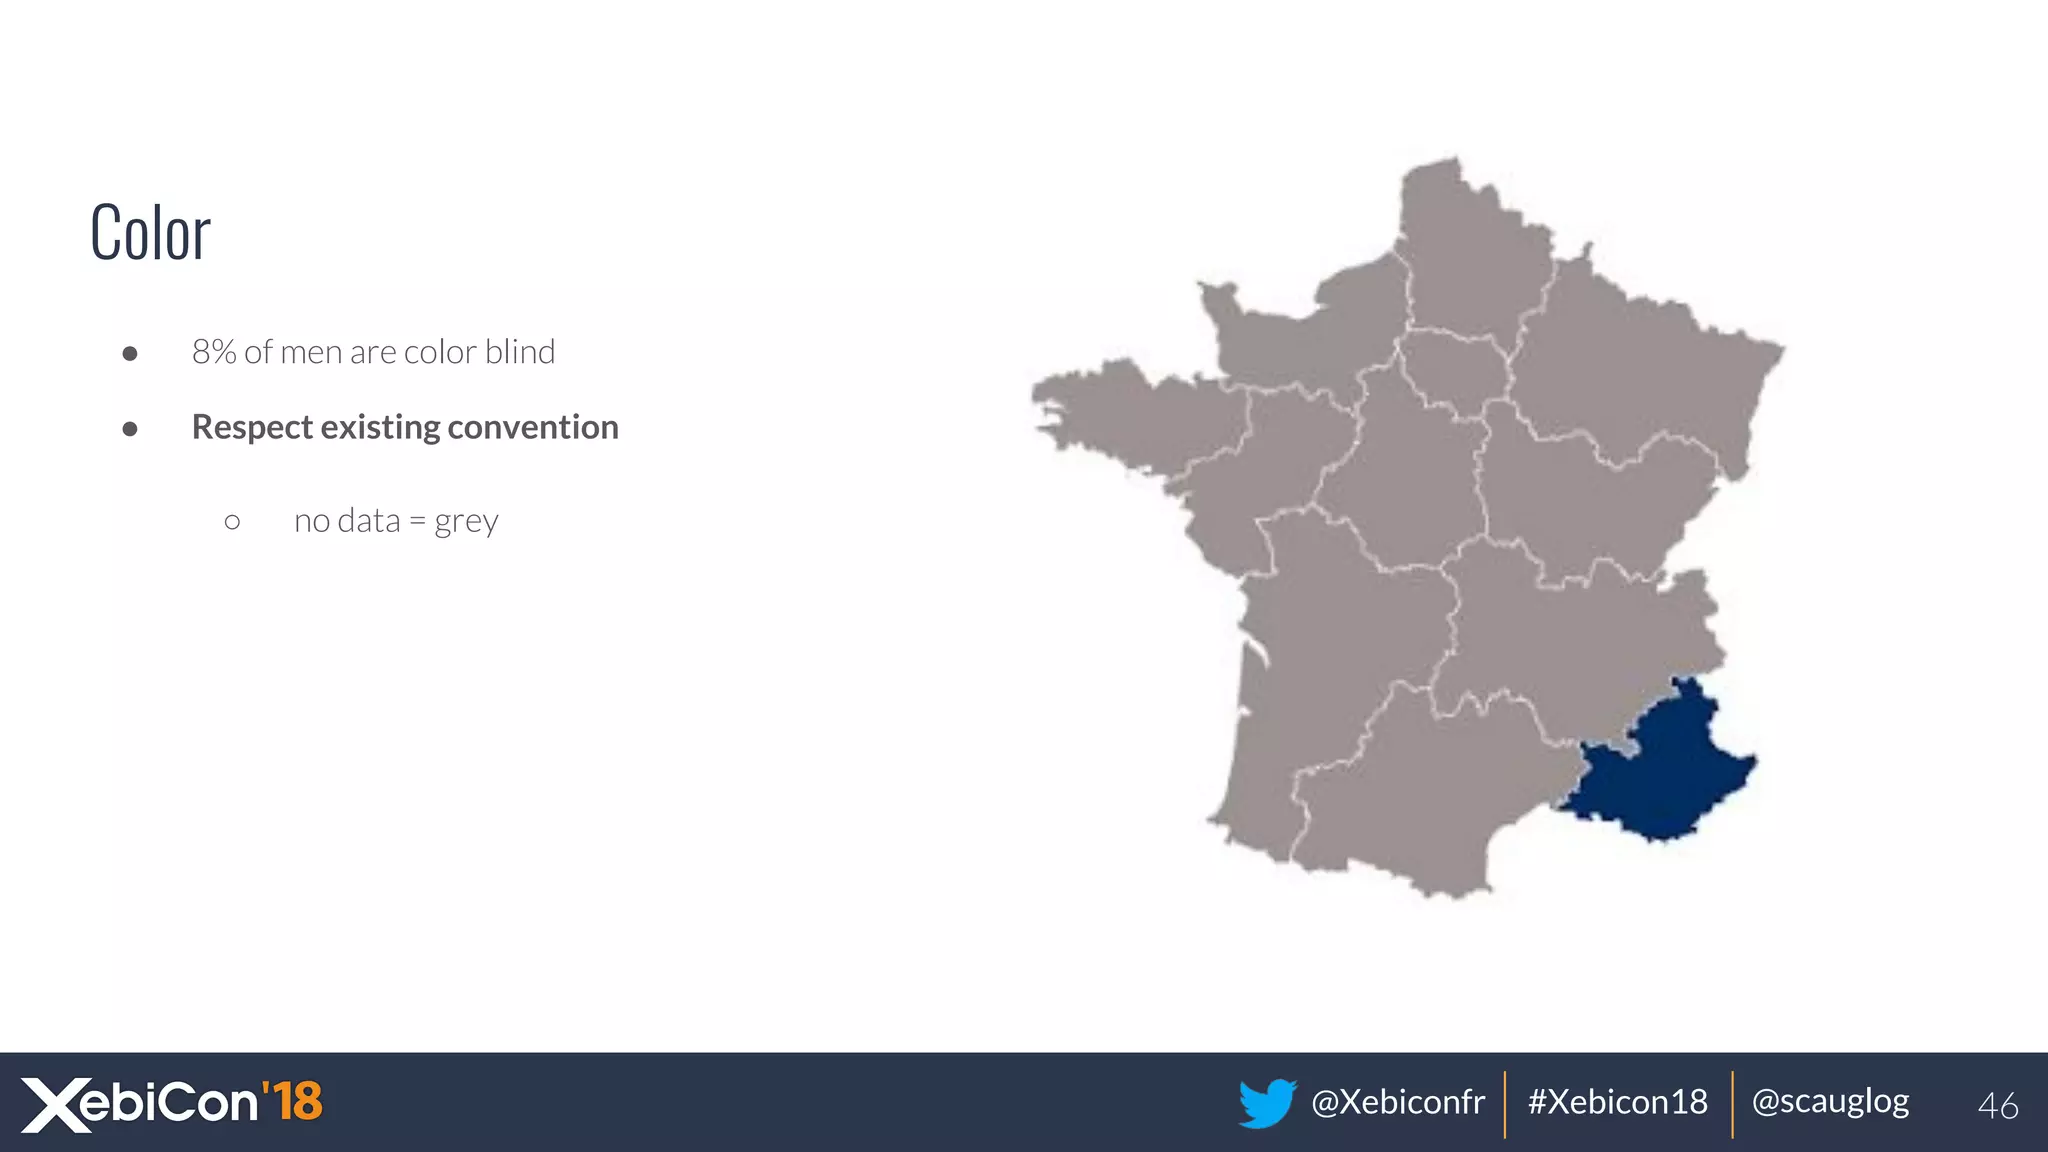
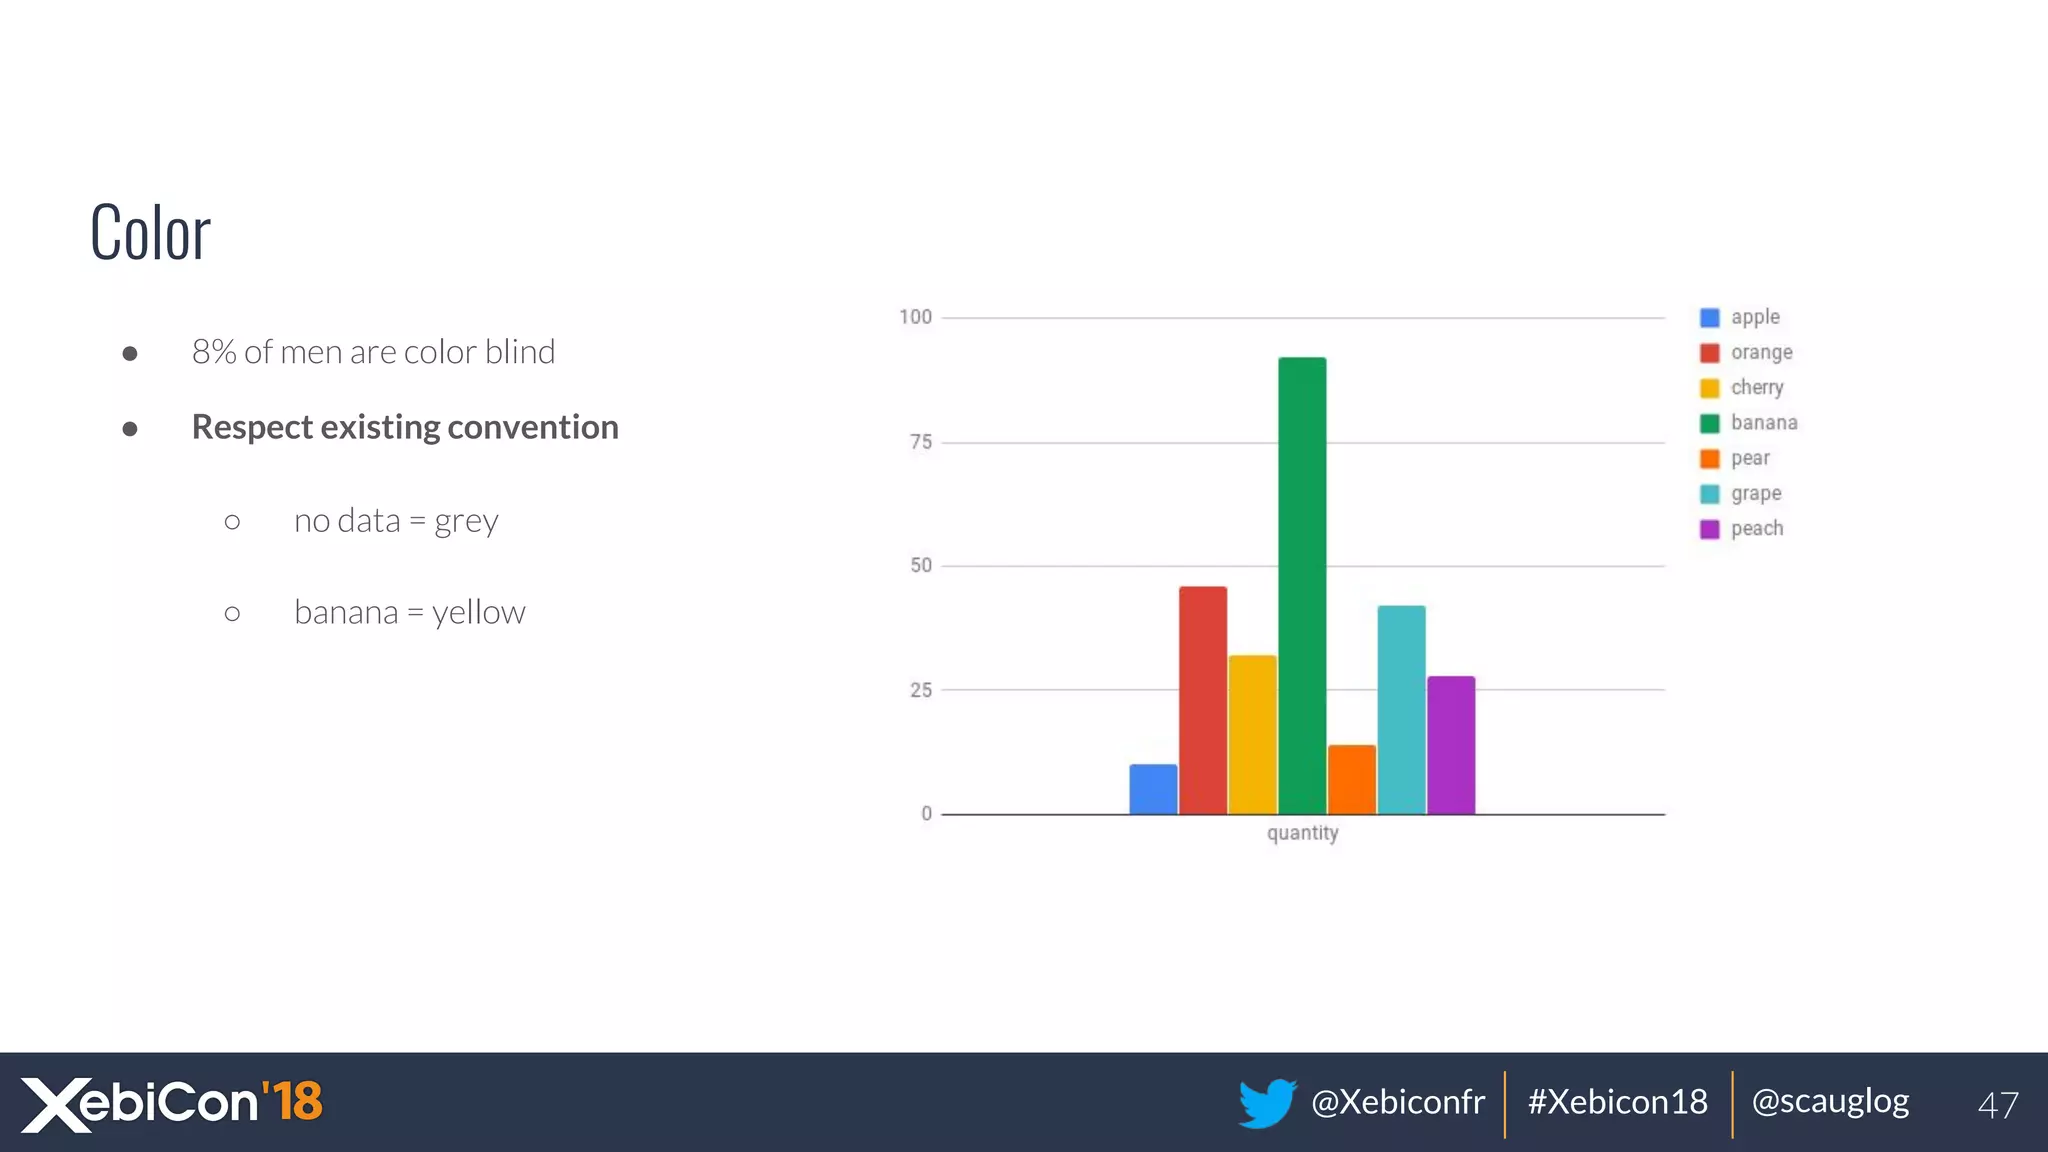
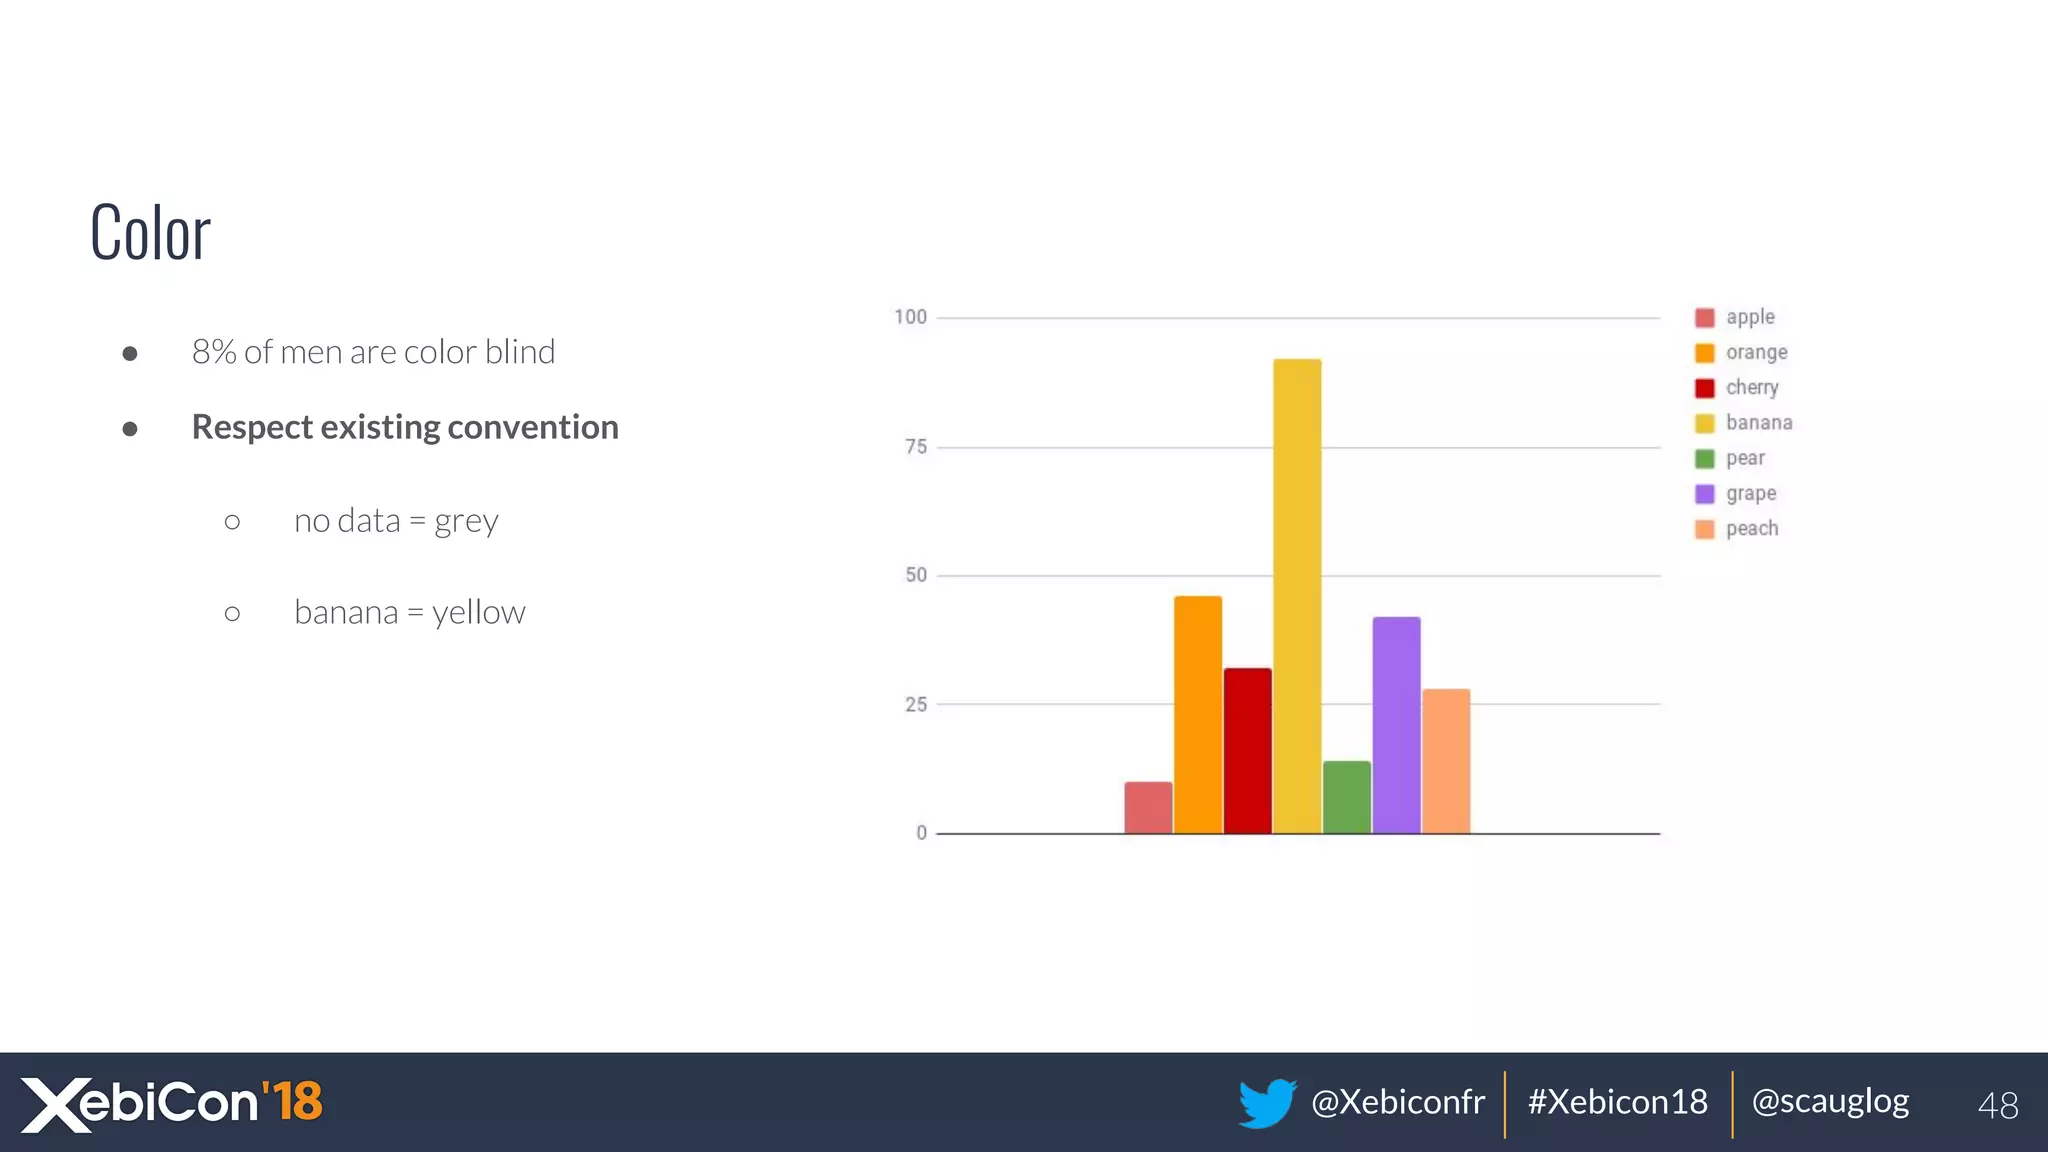


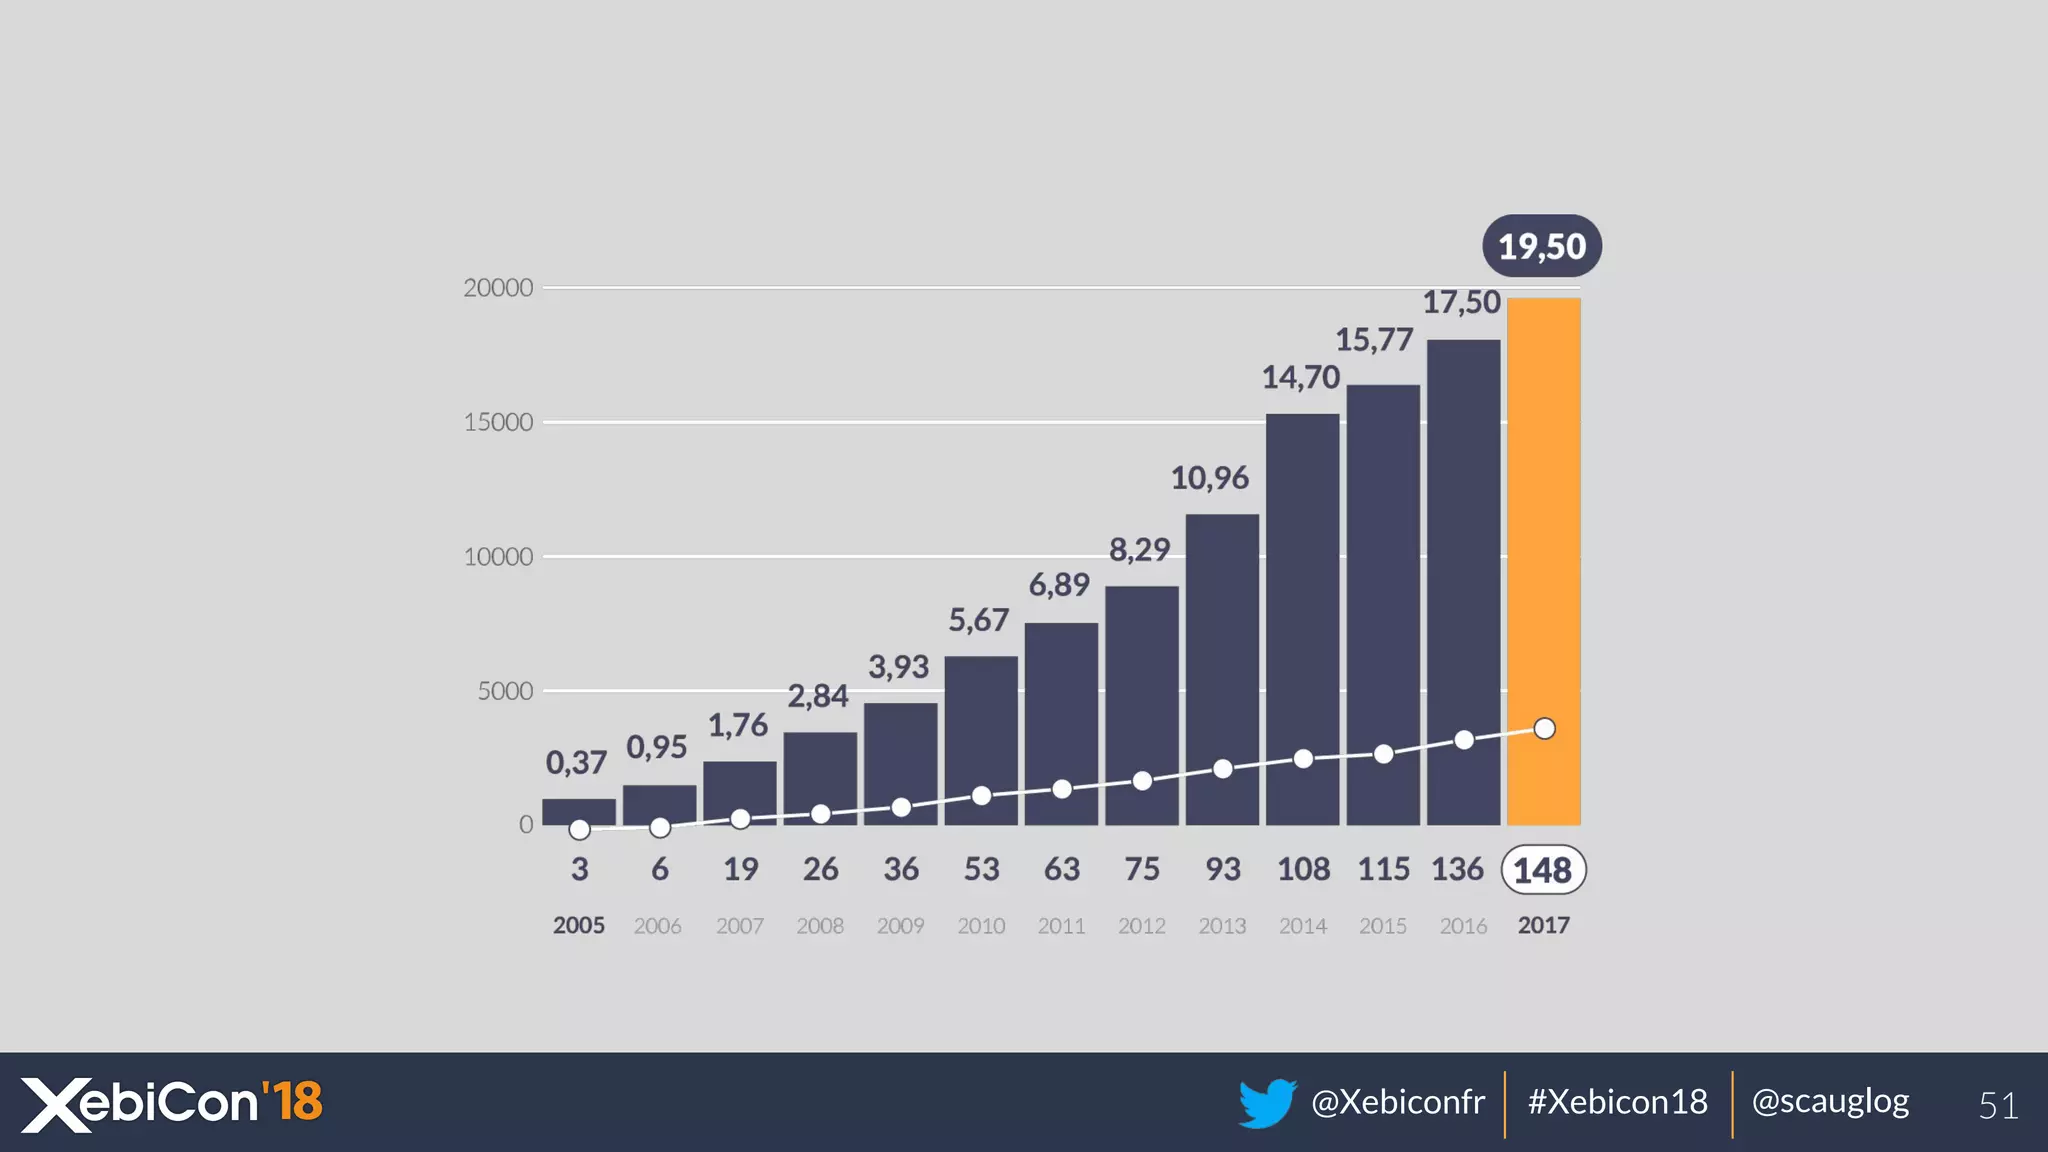


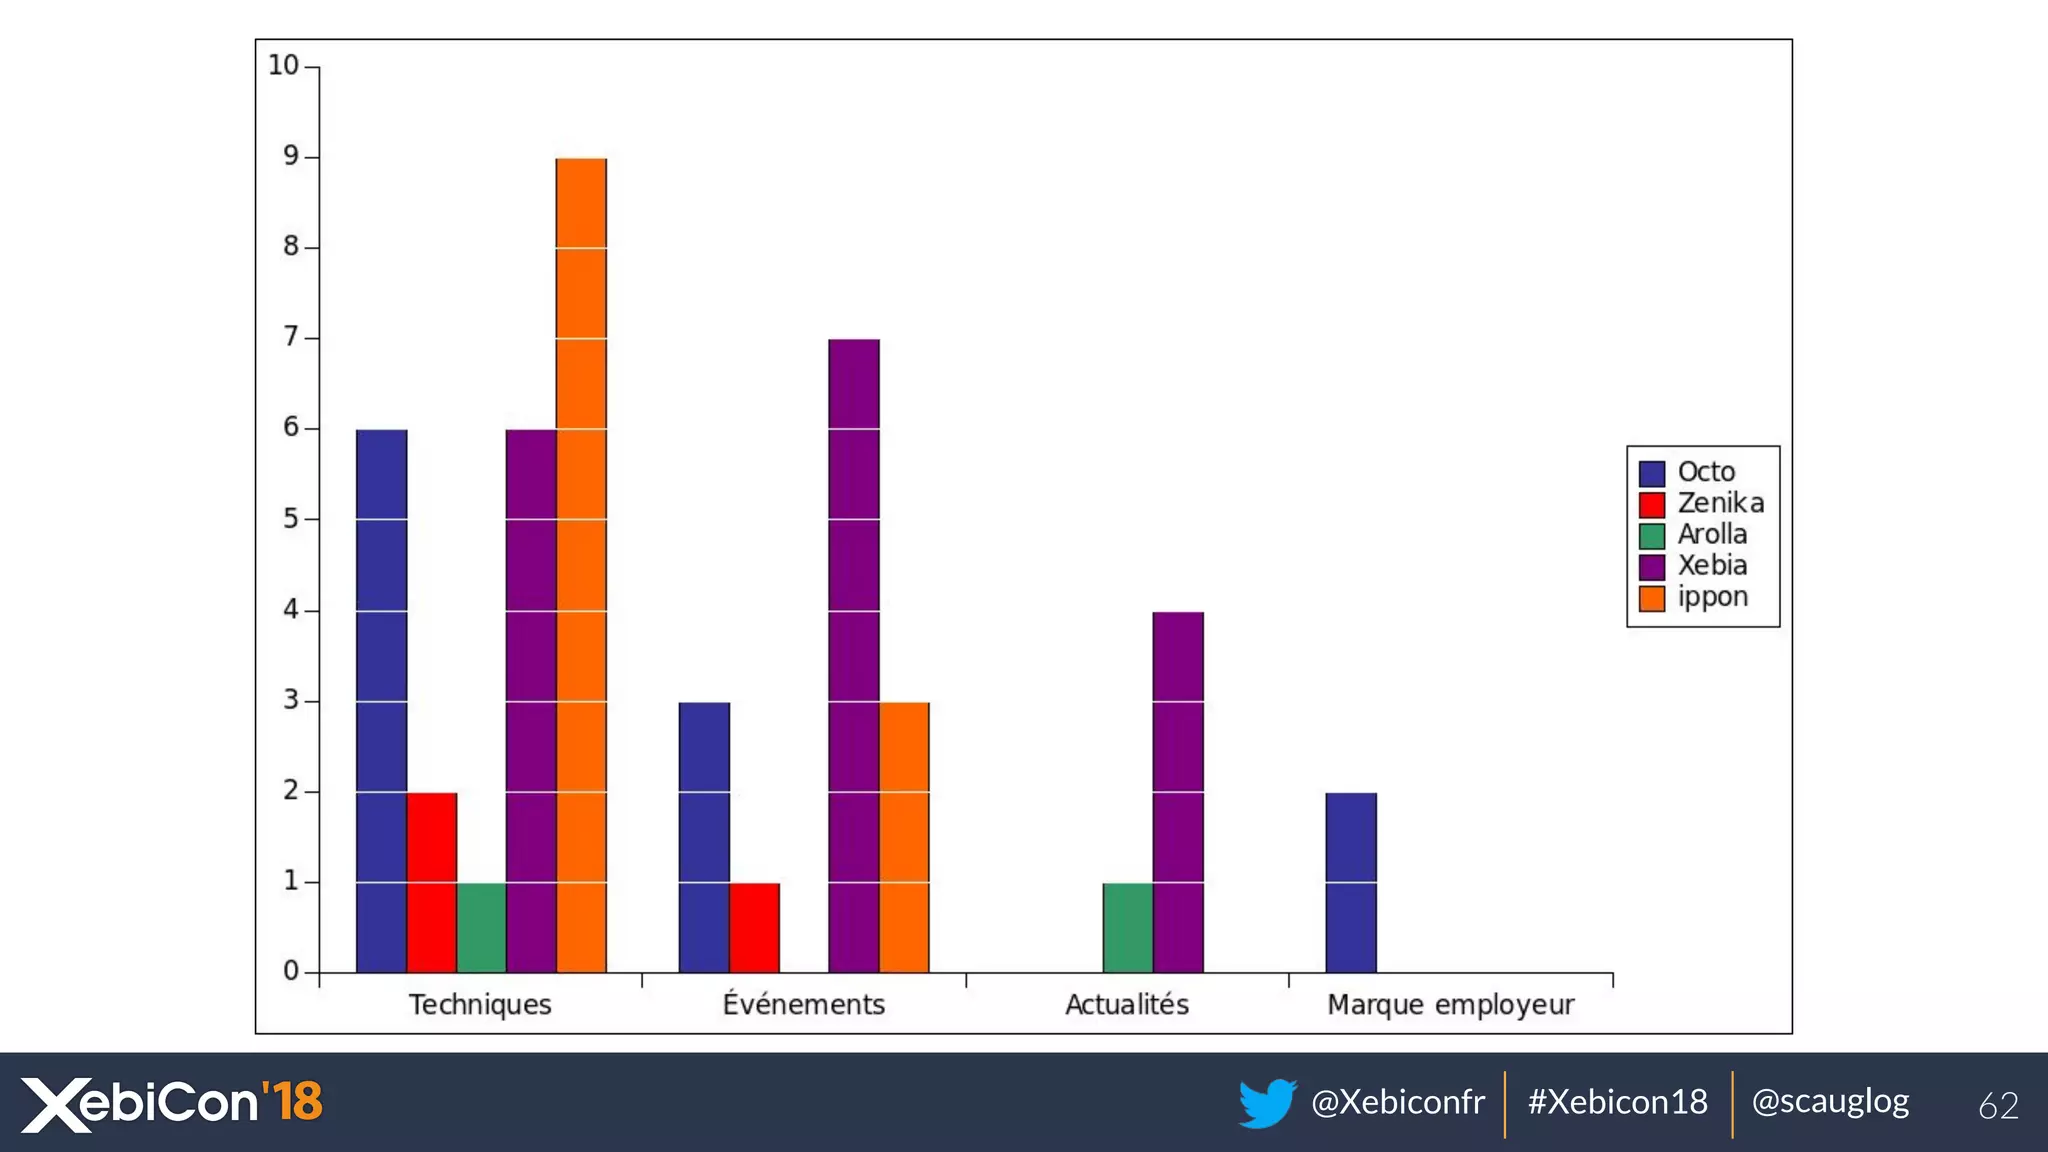
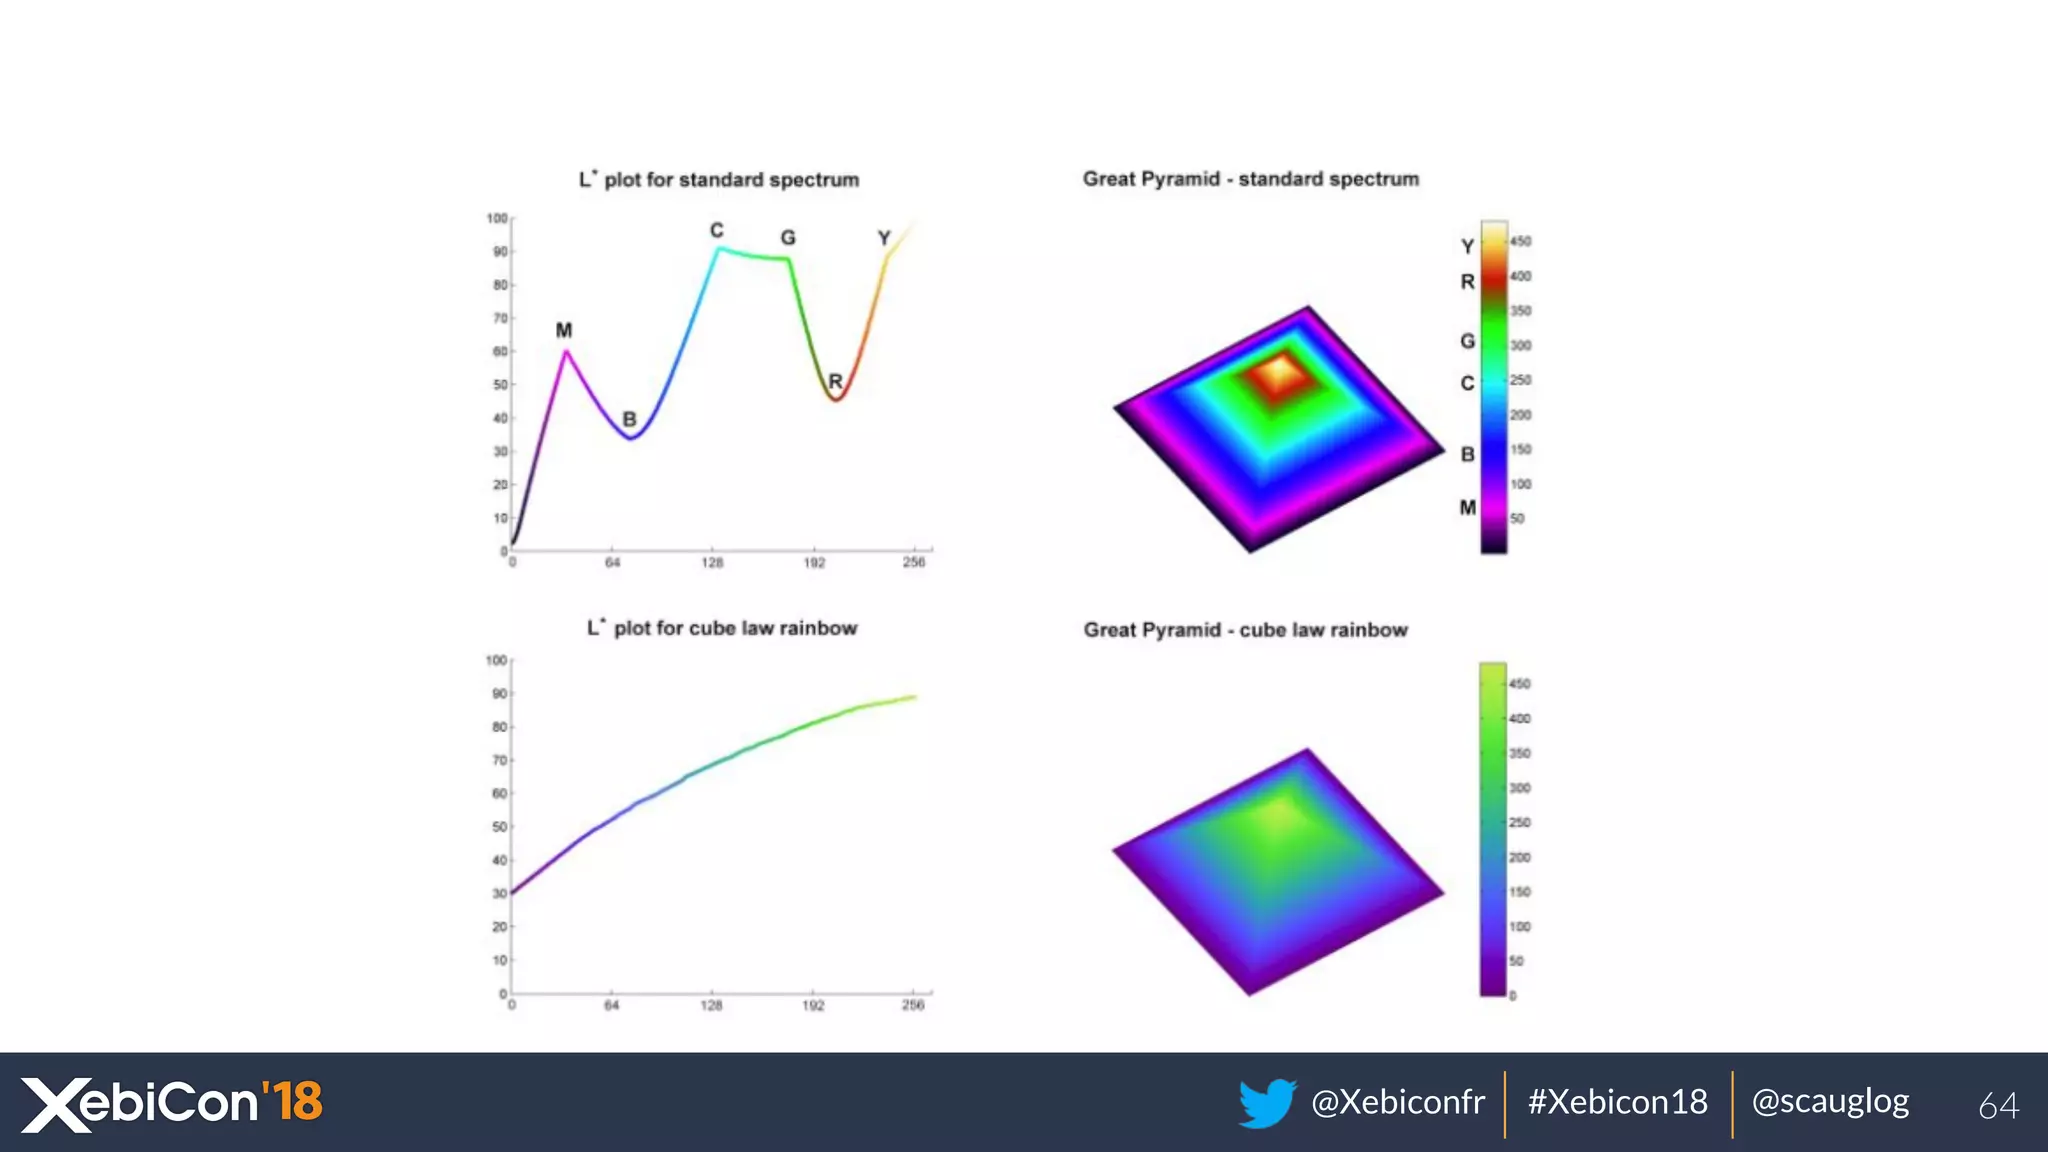

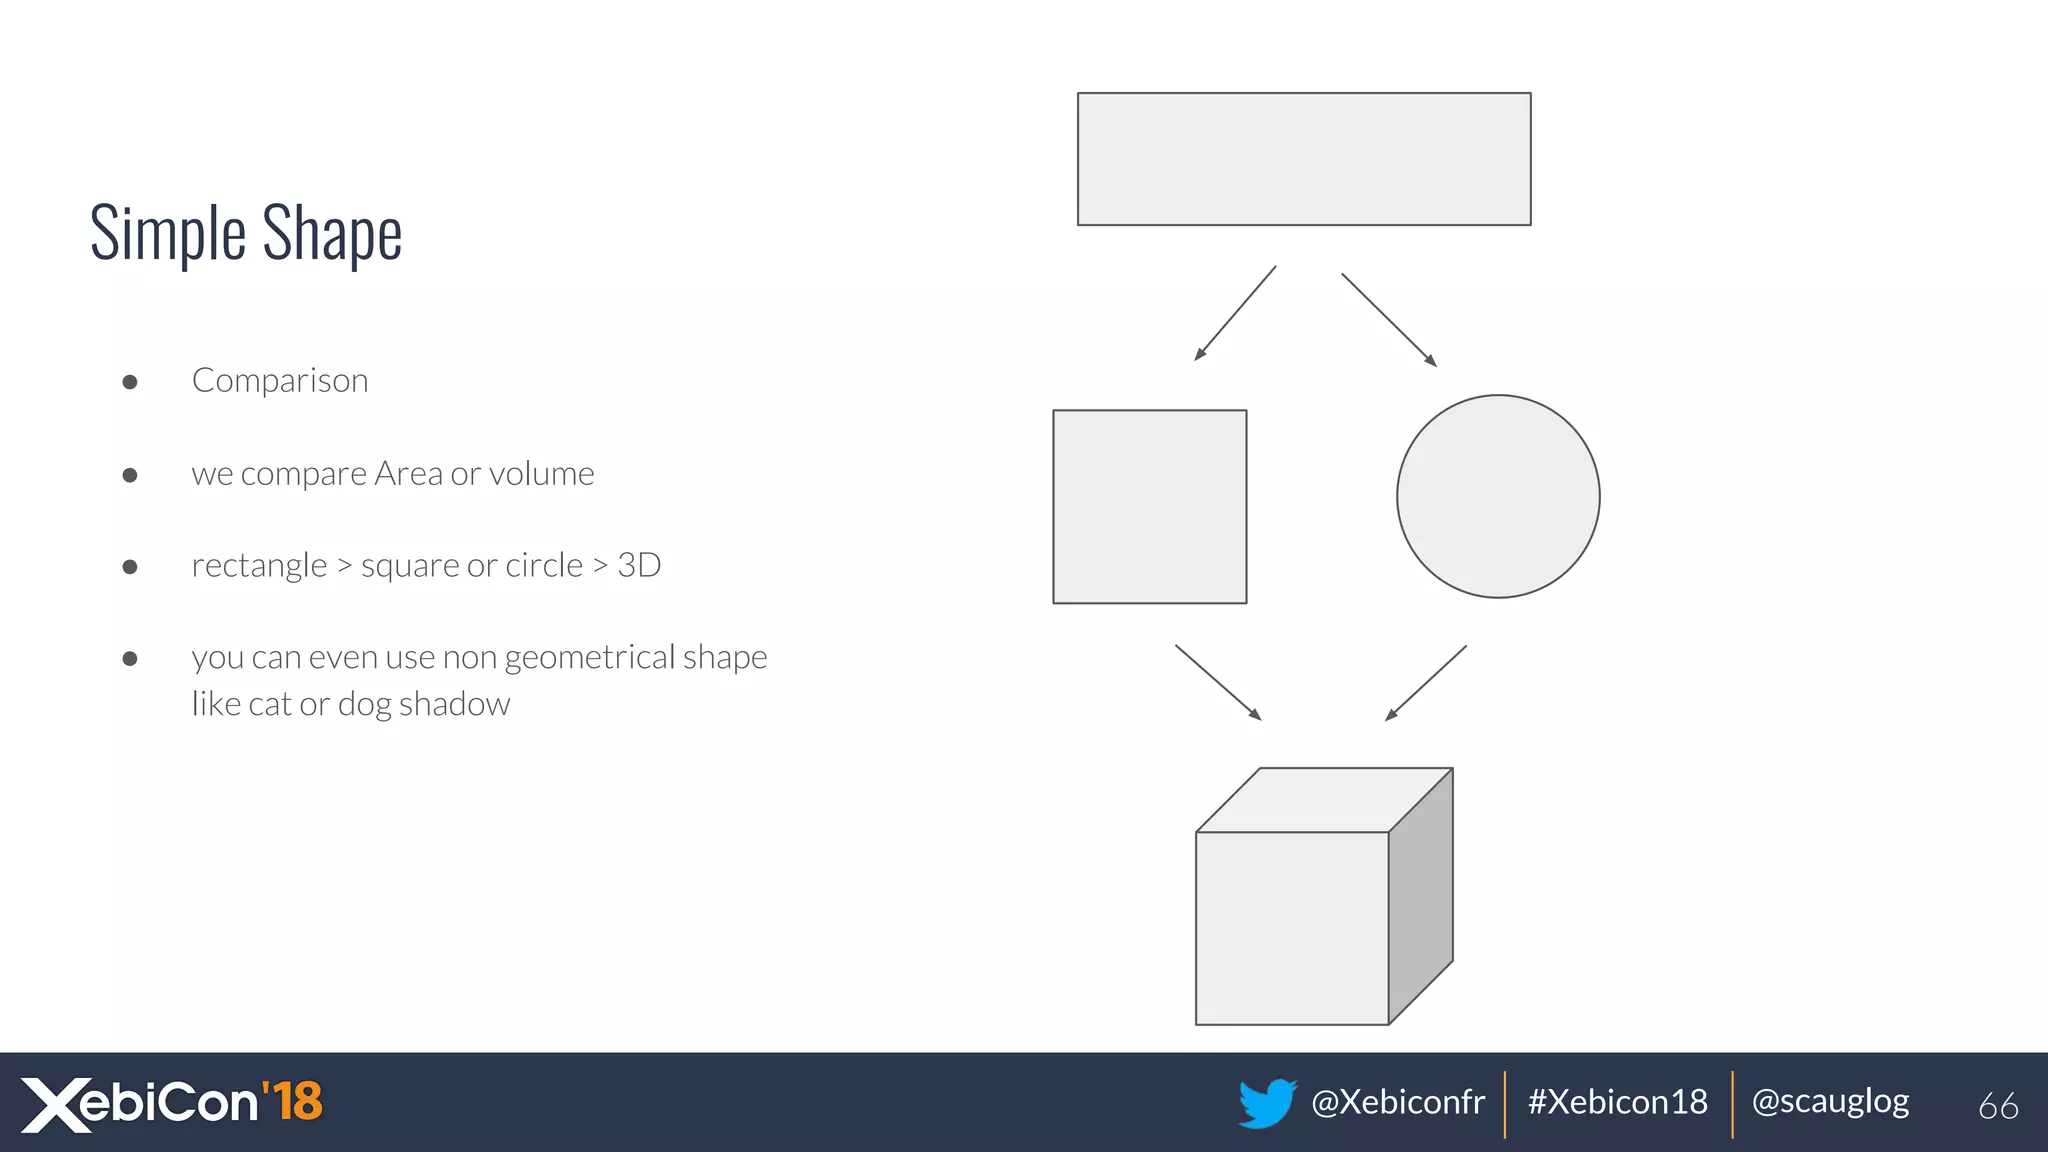

The document discusses various data visualization techniques and best practices while cautioning against common pitfalls, such as misleading representations like 3D charts. It emphasizes the importance of logical data sorting, accurate comparisons, and respecting color conventions due to color blindness. Additionally, it creatively presents how different chart types (e.g., line, bar, pie) can effectively communicate data if designed thoughtfully.


![Coded Agents – with UiPath SDK + LangGraph [Virtual Hands-on Workshop]](https://cdn.slidesharecdn.com/ss_thumbnails/codedagentsdeck-251215155422-5497c599-thumbnail.jpg?width=640&height=640&fit=bounds)


